Volume x PriceThis indicator displays the traded volume weighted by the closing price of each candle. It's useful for visualizing the intensity of capital movement in the market, beyond traditional volume.
Calculation: Volume × Closing Price
Display: Column-style histogram
Coloring:
🟩 Green if the session was bullish (close > open)
🟥 Red if the session was bearish (close < open)
Ideal for spotting high-activity zones with directional bias. It complements classic volume analysis and helps identify strong capital inflows or outflows.
Price Volume Trend (PVT)

Volume Profile — Fast Anchored (Overlay or Stacked)This script plots a fast, anchored volume profile for a chosen range of bars, slicing price into bins and scaling each row’s horizontal width by total volume. Blue shows total volume at each price level, while green marks the buy-volume portion (either as an overlay or stacked buy/sell, depending on the style you choose). The profile is positioned so it grows inward from the side of the chart and ends near recent candles using a right-gap and stretch controls, with optional POC and VAH/VAL lines. It supports both Lookback and FixedRange modes, applies multiple smoothing passes along the price axis for cleaner shelves, and includes an optional recency bias (off by default) that can weight newer bars more heavily when you want the profile to emphasize current trading activity over older history.

RR Banks HFT Order🎯 RR BANKS HFT ORDER
Professional trading system with smart signal generation and advanced trend filtering.
✨ FEATURES:
• Clear BUY/SELL signals
• Trend filter
• Multiple confirmations
• Volume analysis
• Divergence warnings
• Banks Secrets
📊 WORKS ON:
All markets (Forex, Stocks, Crypto, Commodities)
Best on: 1M,5M,15m, 30m, 1H, 4H, Daily
💡 HOW TO USE:
1. Wait for "Bank 1" or "Bank 2" signal
2. Confirm trend
3. Look for additional confirmations
4. Enter with 0.1% risk max
⚠️ Risk Warning: Trading involves substantial risk. Practice on demo first.
🚀 Add to chart and start trading smarter!
#TradingView #TradingSignals #TechnicalAnalysis

BUY LOW, BUY MORE, SELL HIGH -BUFFET STRATEGY LITE__________________________________________________________________________
Buy Low, Buy More, Sell High With Buffett Meter (LITE – JTMarketAI)
__________________________________________________________________________
Category: Quantitative Momentum & Liquidity Flow
Author: JTMarketAI
Architecture: Non-Repainting
This strategy accumulates into validated pullbacks during fear cycles, scales intelligently as price declines into liquidity support, and exits when momentum weakens after meaningful run-ups. It uses synthetic higher-timeframe OHLC data (non-repainting), liquidity imbalance confirmation, adaptive KAMA trend logic, RSI validation, and a live Buffett macro valuation gauge.
This is a patient, conviction-based accumulation engine designed for equities.
It is not a scalp bot.
__________________________________________________________________________
Core Features
__________________________________________________________________________
Non-repainting (confirmed bars only)
Synthetic HTF OHLC (no lookahead)
Dynamic trailing exit preserves ~80–87% of peak profit
Bull vs Bear liquidity dominance and flow imbalance
Rolling lowest-low tracking (LLL)
NY-session alignment (default)
Buffett Macro Meter integration
Technical Highlights
Flow-confidence derived from volume-order pressure
Adaptive KAMA smoothing for lower-lag confirmation
Daily > Weekly > Monthly synthetic aggregation
LLL progression display for trend exhaustion
Fully profiler-optimized
Supports averaging down when pyramiding enabled
__________________________________________________________________________
Why It Does Not Repaint
__________________________________________________________________________
All state updates occur only on confirmed bars
Synthetic HTFs built without lookahead
Persistent arrays freeze historical values
Trailing highs updated only after confirmation
No forward-reference to future bars
__________________________________________________________________________
Lite Edition Notes
__________________________________________________________________________
Manual trading focused
Buffett Meter enabled
Up to 20 trades per session
Visual dashboard included
No alerts, automation, or webhooks (PRO unlocks IBKR + TradersPost)
__________________________________________________________________________
Limitations
__________________________________________________________________________
Best on intraday equities (1m–4h)
Designed for US stocks only
High-resource if full visuals enabled
Avoid penny stocks and extremely low-volume tickers
Does not guard against after-hours gaps or major news moves
__________________________________________________________________________
Warnings
__________________________________________________________________________
Contrarian scaling requires discipline and patience
Expect longer-duration trades, not rapid scalps
Use on quality tickers unlikely to permanently collapse
Confirm price behavior outside cash session
Test manually before automating anything
Not suitable for every market environment or asset
Notes on Philosophy
This strategy attempts to accumulate when markets overshoot lower, and distribute after recovery momentum fades. It reflects a patient, value-driven approach built on the principle of buying fear and reducing exposure into strength.
__________________________________________________________________________
Disclaimer
__________________________________________________________________________
For research and educational use only. Not financial advice. Past performance does not guarantee future results. Test thoroughly and use appropriate risk management.
__________________________________________________________________________
Hashtags
__________________________________________________________________________
#buffett #quantstrategy #valuemomentum #accumulation #contrarian #nonrepaint #equitystrategy #swingtrading #liquidityanalysis #synthetichtf #tradingviewstrategy

BUY LOW, BUY MORE, SELL HIGH - MARKET FLOW STRATEGY LITE
TV Description - Buffett Meter Lite
body{font-family:Arial,Helvetica,sans-serif;max-width:900px;margin:32px auto;line-height:1.4} h1,h2{margin:16px 0 8px}
Buy Low, Buy More, Sell High With Buffett Meter (Lite v1283 – JTM)
Category: Quantitative Momentum & Liquidity Flow
Author: JTM
Architecture: Non-Repainting
This strategy accumulates into validated pullbacks during fear cycles, scales intelligently as price declines into liquidity support, and exits when momentum weakens after meaningful run-ups. It uses synthetic higher-timeframe OHLC data (non-repainting), liquidity imbalance confirmation, adaptive KAMA trend logic, RSI validation, and a live Buffett macro valuation gauge.
This is a patient, conviction-based accumulation engine designed for equities.
It is not a scalp bot.
Core Features
Non-repainting (confirmed bars only)
Synthetic HTF OHLC (no lookahead)
Dynamic trailing exit preserves ~80–87% of peak profit
Bull vs Bear liquidity dominance and flow imbalance
Rolling lowest-low tracking (LLL)
NY-session alignment (default)
Buffett Macro Meter integration
Technical Highlights
Flow-confidence derived from volume-order pressure
Adaptive KAMA smoothing for lower-lag confirmation
Daily > Weekly > Monthly synthetic aggregation
LLL progression display for trend exhaustion
Fully profiler-optimized
Supports averaging down when pyramiding enabled
Why It Does Not Repaint
All state updates occur only on confirmed bars
Synthetic HTFs built without lookahead
Persistent arrays freeze historical values
Trailing highs updated only after confirmation
No forward-reference to future bars
Lite Edition Notes
Manual trading focused
Buffett Meter enabled
Limit of 20 trades per session
Buffet Meter dashboard included
No alerts, automation, or webhooks (PRO unlocks IBKR + TradersPost)
Limitations
Best on intraday equities (1m–4h)
Designed for US stocks only
High-resource if full visuals enabled
Avoid penny stocks and extremely low-volume tickers
Does not guard against after-hours gaps or major news moves
Warnings
Contrarian scaling requires discipline and patience
Expect longer-duration trades, not rapid scalps
Use on quality tickers unlikely to permanently collapse
Confirm price behavior outside cash session
Test manually before automating anything
Not suitable for every market environment or asset
Notes on Philosophy
This strategy attempts to accumulate when markets overshoot lower, and distribute after recovery momentum fades. It reflects a patient, value-driven approach built on the principle of buying fear and reducing exposure into strength.
This is edge-based, not “trade every wiggle” logic
“Be fearful when others are greedy, and greedy when others are fearful.” — Buffett
“The stock market transfers money from the impatient to the patient.” — Buffett
Disclaimer
For research and educational use only. Not financial advice. Past performance does not guarantee future results. Test thoroughly and use appropriate risk management.
Hashtags
#buffett #quantstrategy #valuemomentum #accumulation #contrarian #nonrepaint #equitystrategy #swingtrading #liquidityanalysis #synthetichtf #tradingviewstrategy

Candlestick Absorption (Pure Price+Volume)📘 Candlestick Absorption (Pure Price + Volume)
An original approach to detecting hidden institutional absorption using nothing but candle structure and relative volume.
🧠 Concept
Every candle tells a story — not just in its color, but in the battle between aggressive orders and passive liquidity.
This indicator isolates those moments where one side of the market absorbs the other’s aggression — when a candle shows excess wicks on high volume but fails to extend in that direction.
Unlike traditional volume indicators or oscillators, this script focuses solely on the interaction between wick length, body size, and relative volume , giving a pure price–volume perspective of absorption and exhaustion.
⚙️ How It Works
1. Relative Volume Detection
• Compares each candle’s volume to a configurable moving average (default SMA 20).
• Marks only candles with significantly above-average activity (e.g. 1.5× SMA) as eligible for absorption.
2. Wick–Body Anatomy Analysis
• Measures the proportion of each candle’s wicks and body within its total range.
• Focuses on long wicks with small bodies , representing strong push-and-absorb behavior.
• The close must remain off the extreme by a user-defined percentage to confirm that the move was rejected.
3. Absorption Logic
• Bullish Absorption (⬆) → long lower wick, high volume, small body, close away from the low → demand absorbed selling pressure.
• Bearish Absorption (⬇) → long upper wick, high volume, small body, close away from the high → supply absorbed buying pressure.
4. Cooldown & Clarity
• A built-in cooldown prevents repetitive signals in congestion zones.
• Optional translucent absorption zones (boxes) extend forward, helping you visualize where future retests may react.
🎯 How to Use It
• Watch for Absorb ⬆ or Absorb ⬇ markers near swing highs/lows, session extremes, or fair-value gaps — these often highlight zones of institutional absorption or stop-runs.
• Combine with market structure or order-flow context rather than standalone entries.
• Use zones as potential re-entry or rejection levels when price revisits them.
• For intraday use, increase High-Volume Factor to 1.8–2.2 to filter noise.
• For higher timeframes, relax wick/body thresholds slightly to capture broader absorption events.
⸻
🔍 What Makes It Original
• Pure Price + Volume logic — no MAs, RSI, VWAP, or momentum filters.
• Uses dynamic wick-to-range ratios and relative-volume qualification instead of arbitrary thresholds.
• Adaptive visual design: the plotted boxes fade as they age, making absorption footprints visually intuitive.
• Works across any market (stocks, crypto, indices, futures) and timeframe without recalibration.
• Zero repainting. All signals are based on completed bars only.
🧩 Inputs Summary
Volume Filter : Volume SMA Length, High-Volume Factor
Defines how much higher a candle’s volume must be compared to its average
Candle Anatomy : Min Wick % of Range, Max Body % of Range, Close Off Edge %
Controls candle geometry for valid absorption
Signal Logic [/b : Cooldown Bars, color filters
Reduces clutter and false clustering
Zones : Draw Zones, Zone Forward Bars, Opacity Levels
Paints temporary liquidity footprints
Visuals : Background Tint
Highlights active absorption bars
⚠️ Important Notes
• Absorption ≠ instant reversal — it’s often a precursor to exhaustion or liquidity shift.
• Always confirm with structure, trend context, or additional confluence.
• Use at your own discretion; the script makes no performance claims.
💡 Suggested Use Cases
• Identifying trap candles at swing highs/lows.
• Spotting hidden institutional participation before reversals.
• Filtering false breakouts in tight ranges.
• Defining retest zones for Smart-Money or volume-profile strategies.

Daniel.Yer Volume Breakout Signal🧠 Summary – Daniel.Yer Volume Breakout Signal
The indicator only works on time frames of minutes.
An indicator that detects high-volume breakouts after the market opens and highlights potential entry zones.
Based on sampling the opening volume window and comparing it to the session’s volume peak.
Visually marks preparation areas (colored background) and plots BUY/SELL triangles for confirmation candles.
Includes real-time alert conditions for leading tickers: SPY, AAPL, MSFT, META, AMD, TSLA, NVDA, PLTR, GOOG, and AMZN.
Optimized for day trading — provides actionable alerts even when the user is offline.

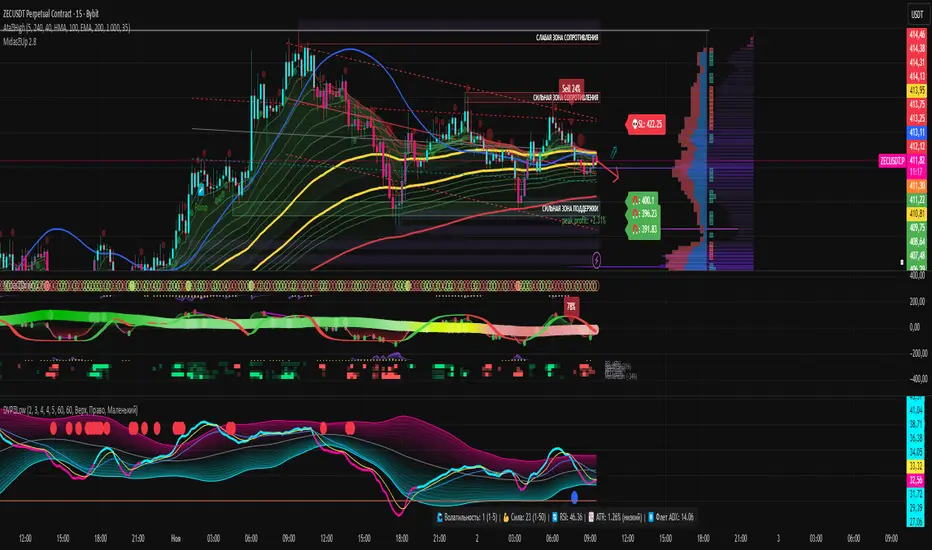
Dynamic Volume ✨ Profile PublicThis script is a comprehensive Pine Script indicator for TradingView called "Dynamic Volume Profile." It analyzes price and volume data to calculate a dynamic oscillator, adaptive midlines, and volume-weighted price deviations. The script highlights bullish and bearish zones, detects trend reversals, and plots signals for potential long and short entries using colored circles. It also visualizes probability density function (PDF) zones to identify statistically favorable trading areas. Additionally, it automatically detects trend direction, volatility, and trend strength, and can display a table of major global trading sessions with real-time status and countdowns. The script is highly customizable for different assets, timeframes, and trading styles.
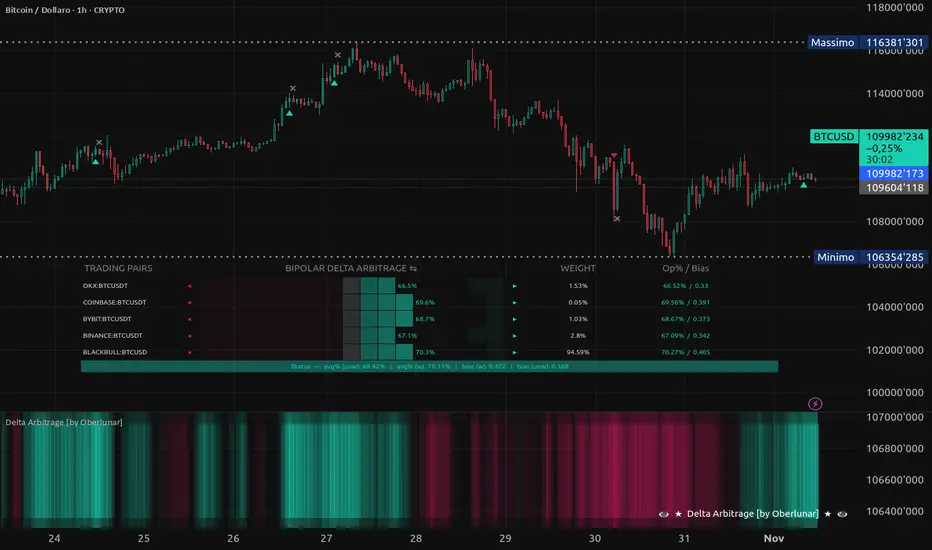
Delta Arbitrage [by Oberlunar]Delta Arbitrage turns fragmented exchange activity into a single, readable pulse. Each broker breathes at its own rhythm; this tool measures the share of “buy vs. sell” participation per broker, weights those brokers by liquidity/activity, and blends them into one continuous bias. The result is a chart you can read in seconds: aqua when buy-side dominates, red when sell-side does—stronger shades for stronger imbalances.
Delta Arbitrage indicator supports several ways to colour candles based on the aggregated, cross-venue delta, so you can match visual feedback to the strength/consensus of flow.
Examples
LONG opportunity — broad bullish agreement (>70% weighted Buy%)
In this case, a LONG setup formed because a high proportion of brokers simultaneously pushed bullish volumetric deltas (>70%).
The corridor then stayed positive across multiple bars, with sustained long strength in agreement across venues:
Follow-through:
SHORT opportunity — broad bearish agreement (<20% weighted Buy%)
Here, a SHORT setup formed because a high proportion of brokers simultaneously pushed bearish volumetric deltas (<20%).
The corridor remained negative over several bars, showing high-intensity short pressure in cross-venue agreement:
Follow-through:
Spectral mode
You can enable the spectral mode, where range candles are colored only when multiple brokers are in volumetric agreement. You’ll see bullish pressure when weighted Buy% exceeds ~70%; when direction changes, range candles fade out and the lower tiles flip red to reflect rising short pressure.
Example:
How it’s built (in plain words)
For every selected broker, the script computes a robust Buy% over a rolling window and maps it to a signed bias (−1…+1).
Venues are then combined with flexible weighting—Equal, Last Volume, SMA Volume, or Relative-to-SMA—to emphasise who is active now .
A small neutral band near zero calms noise; an intensity curve (gamma) makes strong pushes visually obvious without overshooting weak ones.
What you see
Tinted bars/background : the aggregate bias colours the chart so the prevailing side is instantly clear.
Dashboard : a compact meter for each venue (SELL⇄BUY), its normalised weight, and exact Buy%/bias, plus a summary line for the weighted & unweighted aggregates. It shows whether one venue is dragging the whole market or if participation is broad.
Lower panel (timeline) : a tile-per-bar strip using the same bias logic. Long, saturated runs = sustained participation; choppy, desaturated tiles around zero = balance/compression. The strip’s height is fixed vs. a recent range, so it remains legible on any zoom.
How to act on it (minimal, auditable rules)
Entries: a one-shot arrow when the weighted Buy% crosses a high/low threshold (e.g., >70 for longs, <30 for shorts).
Exits: trail the indicator itself—close when the weighted Buy% retraces by a set number of points from its peak (long) or trough (short).
Context: prefer entries that align with a fresh, persistent run in the lower strip and supportive rows in the dashboard; fade/exit when the strip desaturates or flips.
Do not operate when the average volumetric pressure (avg) is around 50% +- 15%
Why it matters
This is not tick-level microstructure; it’s a fast, stable cross-venue proxy designed for operational use on any timeframe. By unifying “who’s in charge, for how long, and how strongly,” the indicator reduces discretionary noise and turns participation into a tradable, testable context.
— Oberlunar 👁 ★
BUY LOW, BUY MORE, SELL HIGH - MARKET FLOW STRATEGY-JTM────────────────────────────────────────────────────────
BUY LOW, BUY MORE, SELL HIGH – MARKET FLOW STRATEGY (v594) – JTM
────────────────────────────────────────────────────────
Category: Quantitative Momentum & Liquidity Flow Strategy
Author: JTM
────────────────────────────────────────────────────────
An Adaptive Contrarian live trading strategy that scales into deep pullbacks,
rides liquidity waves, and locks profit automatically, using your TradersPost.io webhook.
────────────────────────────────────────────────────────
DESCRIPTION
────────────────────────────────────────────────────────
The "Buy Low, Buy More, Sell High" strategy combines value-based accumulation
with adaptive profit protection. It adds exposure on weakness (new lower lows
and confirmed liquidity support) and closes trades dynamically once a profitable
run-up retraces by a set percentage (default 13%).
It reconstructs multi-timeframe market structure
(Intraday → Daily → Weekly → Monthly → Yearly)
using synthetic OHLCs to avoid repainting, and integrates VWAP anchoring,
adaptive KAMA smoothing, RSI validation, and rolling lower-low tracking.
Contrarian strategies are difficult for the human to be easily comfortable with...
because but the results can be worth the wait. Believe that you truly want to Sell when everyone is buying and buy when everyone is almost done selling. Not vice-versa!
Forget about trying to time the market at the true top or the true bottom - just ride
the rolling waves and the profits will come ashore.
────────────────────────────────────────────────────────
CORE FEATURES
────────────────────────────────────────────────────────
• Non-repainting by design – only confirmed bars update persistent state
• Synthetic HTF OHLC construction avoids lookahead bias
• Adaptive trailing TakeProfit logic aims for (80–87% of peak profit retained)
• AI-like market flow dashboard with Bull/Bear liquidity dominance
• Dynamic rolling "Lowest Low" (LLL) detection and visualization
• Modular time detection and session alignment (New York market default)
• Optional Liquidity Dashboard with intraday/swing dual-mode analytics
1. Non-Repainting Architecture - Long side strategy. Not coded for short selling.
2. Works best on a 1hr/60m intraday chart with a 3hr higher Timeframe (strategy input)
3. Immediately Uncheck Show Trade Signals in the Strategy's Style Settings to eliminate
onscreen clutter
4. Market Liquidity Dashboard can be displayed by setting in the strategy's inputs.
5. You set a price range of stocks you wish to allow to trade when using an alert list.
6. You can set a preview period where gray TV trades alerts to Traderspost are withheld.
7. If you check "Do not LIVE sell any assets today" and update the alert, no Traderspost
8. As well as the Market Flow Dashboard, you can display a table of HLs, and LLs.
Trending stocks will display HLs and Vice Versa.
9. You can switch away from Big Rolling Waves Mode (default) to Intraday Short Moves mode
10. Default Big Wave Rolling Cycle is 120 bars (Recommended) 30,60,90,120 are typical.
(this affects the strategy profitability and choice of entry and exits).
11. Reference to FIFO is about the array size for the stored non-repainting HLs and LLs
12. Option to execute trades on unconfirmed bar is BETA. The strategy Only trades on
confirmed bars always, but I am wanting/hoping to eventually Take Profit on a
BIG ASS institutional candle, morning session bar when they occur.
(a new bar is unconfirmed, building, and tricky to code without
breaking the strategy's reliability). Use at your own risk.
────────────────────────────────────────────────────────
Technical Highlights
────────────────────────────────────────────────────────
• AI-inspired “Flow Confidence” through liquidity imbalance between Bull and Bear pressure.
• Adaptive KAMA smoothing for non-lag confirmation.
• Dynamic trailing take-profit computed as 80–87% of the highest profitable run-up.
• Non-repainting multi-timeframe framework (daily–weekly–monthly aggregation).
• LLL Table module for Lowest-Low progression and trend exhaustion.
• Market Flow Dashboard visualizing rolling liquidity dominance and delta pressure.
• Session-aware logic for intraday vs. swing operation.
• All logic has been tuned to peak performance that satisfies the TradingView Profiler.
• Strategy Buys again at a lower price instead of selling and taking a loss. Drawdown Peaks!
but this requires you configure TradingView Strategy Pyramiding orders to 2 or more
and % of equity.
(definitely is more $$ risky, potentially more profitable and might beat Buy and Hold profits)
See the chart above.
────────────────────────────────────────────────────────
WHY IT DOES NOT REPAINT (even thought the TradingView alert message says it might.)
────────────────────────────────────────────────────────
1. All trade, table, and OHLC updates occur only on `barstate.isconfirmed`
2. Synthetic HTFs are self-built without `lookahead` or future data
3. All arrays use `var` persistence to freeze past state
4. Trailing TakeProfit peak updates only on confirmed highs
5. No forward-referencing of real-time partial bars
────────────────────────────────────────────────────────
LIMITATIONS
────────────────────────────────────────────────────────
1. Heavy computation on long intraday histories (optimize `max_bars_back`)
2. Requires intraday chart resolution (1m–4h)
3. U.S. session defaults (09:30–16:00 ET); adjust for other exchanges
4. Arrays and tables consume memory – disable extra visuals if unneeded
5. Not for use with Crypto, Forex, or Futures.
6. Only to be used with Stocks/Tickers having volume data.
7. Live trading is coded for a TradersPost.io Webhook and a brokerage account. (IBKR)
────────────────────────────────────────────────────────
WARNINGS
────────────────────────────────────────────────────────
1. This is an Adaptive and Contrarian Trading strategy that scales into DEEP pullbacks,
rides long liquidity waves, and locks profit automatically.
2. Trades can have a long duration but are minimal. This is not a strategy that will
generate thousands of trades. It will save you on commissions to.
3. It does its best to limit losses and but I cannot guarantee it will work for
all assets, all the time. Market conditions vary. Tickers vary.
4. Use it with assets that you trust not to race to zero dollars.
5. Use this strategy with healthy tickers that have medium to high volatility.
6. To eliminate onscreen clutter, uncheck strategy settings/style/trade signals.
7. I use this strategy exclusively. TradingView alerts run for me 24/7 and ROBO trade.
but you should vet the system with manual trades signals it generates for yourself.
8. It does not prevent you from losing profits in after hours trading and Market News.
9. The BIG ASS new bar of opening candle is Not calculated into the stats until it is confirmed. Especially bothersome for me when its a big 10% down candle. You still need to watch the first 9:30 candle with your eyes. I recommend you watch liquidity at Open using a 1m timeframe.
10. This is a pro-grade coded strategy but is NOT a “Wall Street Quant grade.” strategy.
Institutions rely on:
• slippage models
• depth-of-book impact modeling
• latency simulation
• volume-weighted fills
• partial fills & queue priority
• order slicing (TWAP, VWAP, POV)
Pine Script cannot simulate the above.
11. This Pine Script strategy is market-internal (chart & volume) and for personal-use only. The code remains private to me.
12. To the full-time traders — my respect.
I live in the world of code, not charts, scalps, candles and screens,
so I engineered this 2500-line strategy to trade for me with un-emotional discipline, as you do.
If this strategy resonates with you, I provide it for you to use in the TradingView spirit of community. Backtested results are hypothetical and not indicative of future performance.
Nothing here constitutes investment advice.
Trading involves risk, and users must assume full responsibility for their trading decisions.
Remember, its not about making 'all' the money a stock theoretically could return as if you did a buy and hold many years ago - its about making good money as you navigate the waves of the stormy seas, and not sinking. It about making better trade decisions compared to the persons you are trading against. Have fun all the while making your money - work for you.
────────────────────────────────────────────────────────
“Be fearful when others are greedy, and be greedy when others are fearful.”
— Warren E. Buffett
“The stock market is a device for transferring money from the impatient to the patient.”
— Warren E. Buffett
True wealth grows through time, not reaction. A person sits in the shade today because
of a tree that somebody planted years ago.
— Warren E. Buffett
Happy Trading!

VolumeAnlaysis### Volume Analysis (VA) Indicator
**Overview**
The Volume Analysis (VA) indicator is a dynamic overlay tool designed for traders seeking to identify high-volume breakouts, retests, and multi-timeframe volume-driven price cycles. By combining volume spikes with price action and support/resistance boxes, it highlights potential trend continuations, reversals, and cycle shifts. Ideal for intraday and swing trading on stocks, forex, or crypto, it uses a Fibonacci-inspired 1.618 multiplier to detect significant volume surges, then maps them to visual boxes and key levels for actionable insights.
This indicator draws from volume profile concepts but focuses on **breakout confirmation** and **cycle momentum**, helping you spot when "smart money" volume aligns with price extremes. It's particularly useful in volatile markets where volume precedes price moves.
**How It Works**
1. **Volume Break Detection**:
- Identifies a "Volume Break" when the current bar's volume exceeds 1.618x the highest volume from the prior 5 bars. This signals unusual activity, often preceding breakouts.
- A "Volume Retest" triggers exactly 3 bars after a break if volume has been falling steadily over those 3 bars—indicating a pullback for re-accumulation/distribution.
2. **Visual Annotations**:
- **Labels**: Green/red/yellow labels mark Volume Breaks and Retests, positioned above/below the bar based on candle direction for clarity.
- **Demand/Supply Boxes**:
- Blue semi-transparent boxes form around Retest bars, extending rightward to act as dynamic support/resistance.
- Green (bullish) or red (bearish) boxes draw from Volume Breaks, based on the original candle's open/close, highlighting potential zones for continuation.
- Limited to 5 boxes max to avoid chart clutter; older boxes fade as new ones form.
3. **Box Interaction Signals**:
- When price enters a box:
- **Reversal Hints**: Maroon (bearish rejection) or lime (bullish rejection) labels on closes against the trend with opening price momentum.
- **Breakout Arrows**: Up/down arrows on crossovers/crossunders of box tops/bottoms from Retest boxes.
- Scans all active boxes for interactions, prioritizing recent volume events.
4. **Multi-Timeframe Volume Cycles**:
- Aggregates the "Volume Break Max" level (a proxy for key price extremes tied to volume spikes) across timeframes: 1min, 5min, 10min, 30min, and 65min (using `request.security`).
- Computes **MaxVolBreak** (highest extreme) and **MinVolBreak** (lowest extreme) for trend-following levels.
- Tracks **Percent Volume Greater/Less Than Close**: Sums volumes from TFs where price is below/above these levels, creating a momentum ratio.
- **CrossClose**: Plots the prior close where this ratio crosses (gray line), signaling cycle shifts—bullish below MinVolBreak, bearish above MaxVolBreak.
- **Fills**: Red fill above CrossClose/MaxVolBreak (bearish cycle); green below CrossClose/MinVolBreak (bullish cycle).
5. **Plots**:
- Black lines for MaxVolBreak (⏫) and MinVolBreak (⏬).
- Gray 🔄 for CrossClose.
- Colors dynamically adjust (green/red) based on close relative to levels.
**Key Features**
- **Trend vs. Reversal Modes**: Toggle alerts for trend-following breaks (crosses of Max/MinVolBreak) or reversal signals (crosses of CrossClose).
- **Multi-TF Fusion**: Optionally include the chart's native timeframe in Max/Min calculations for finer tuning.
- **Box Management**: Auto-prunes to 5 boxes; focuses on retest/break alignments for "inside bar" logic.
- **Momentum Filters**: Uses rising/falling opens and crossovers for label precision, reducing noise.
- **Customizable**: Simple inputs for alert visibility and timeframe inclusion.
**Settings**
| Input | Default | Description |
|-------|---------|-------------|
| Show Volume Reversal Breaks | False | Enables alerts/labels for CrossClose crosses (cycle reversals). |
| Show Trend Following Breaks | True | Enables alerts for Max/MinVolBreak crosses (trend signals). |
| Use Current Time | False | Includes chart's native TF in multi-TF Max/Min calculations. |
**Alerts**
- **Reversal Alerts** (if enabled): "Volume Reverse Bullish/Bearish Break of " on close crosses of CrossClose.
- **Trend Alerts** (if enabled): "Trend Volume Bullish/Bearish Signal" on close crosses of Max/MinVolBreak; plus notes if prior low/high aligns with levels.
- All alerts include ticker and level value for easy scanning. Use `alert.freq_once_per_bar` to avoid spam.
**Trading Ideas**
- **Bullish Entry**: Green box formation + price holding MinVolBreak + upward arrow on retest box. Target next resistance.
- **Bearish Entry**: Red box + close above MaxVolBreak + red fill activation. Stop below recent low.
- **Cycle Trading**: Watch CrossClose crosses for regime shifts—fade extremes in overextended cycles.
- **Best Timeframes**: 5-30min for intraday; combine with daily for swings. Works best on liquid assets with reliable volume data.
**Limitations & Notes**
- Relies on accurate volume data (e.g., stocks/forex); less effective on low-volume or synthetic instruments.
- Boxes extend rightward but don't auto-delete—monitor for clutter on long histories (max_bars_back=500).
- Some logic (e.g., exact 3-bar retest) is rigid; backtest for your market.
- Open-source under MPL 2.0—fork and tweak as needed!
For questions or enhancements, drop a comment below. Happy trading! 🚀

Daily Pivot Points LEVELS S-RThis indicator plots daily pivot points based on the previous day’s high, low, and close. It displays the main pivot line, as well as the first levels of support (S1) and resistance (R1), with optional second levels (R2, S2) for additional reference. Ideal for
USDJPY Fair Value Gap + Session Strategy🎯 Overview
This strategy combines Fair Value Gaps (FVGs) with session-based order flow analysis, specifically optimized for USDJPY. It identifies price inefficiencies left behind by institutional order flow during high-volatility trading sessions, offering a modern alternative to traditional lagging indicators.
🔬 What Are Fair Value Gaps?
Fair Value Gaps represent areas where aggressive institutional buying or selling created "gaps" in the market structure:
Bullish FVG: Price moves up so aggressively that it leaves unfilled buy orders behind
Bearish FVG: Price moves down so quickly that it leaves unfilled sell orders behind
Research shows approximately 80% of FVGs get "filled" (price returns to the gap) within 20-60 bars, making them highly predictable trading zones.
(see the generated image above)
(see the generated image above)
FVG Detection Logic:
text
// Bullish FVG: Gap between high and current low
bullishFVG = low > high and high > high
// Bearish FVG: Gap between low and current high
bearishFVG = high < low and low < low
🌏 Session-Based Trading
Why Sessions Matter for USDJPY
(see the generated image above)
Tokyo Session (00:00-09:00 UTC)
Highest volatility during first hour (00:00-01:00 UTC)
Average movement: 51-60 pips
Best for breakout strategies
London/NY Overlap (13:00-16:00 UTC)
Maximum liquidity and institutional participation
Tightest spreads and most reliable FVG formations
Optimal for continuation trades
Monday Premium Effect
USDJPY moves 120+ pips on Mondays due to weekend positioning
Enhanced FVG formation during session opens
📊 Strategy Components
(see the generated image above)
1. Fair Value Gap Detection
Identifies bullish and bearish FVGs automatically
Age limit: FVGs expire after 20 bars to avoid stale setups
Size filter: Minimum gap size to filter out noise
2. Session Filtering
Tokyo Open focus: Trades during first hour of Asian session
London/NY Overlap: Captures high-liquidity institutional flows
Weekend gap strategy: Enhanced signals on Monday opens
3. Volume Confirmation
Requires 1.5x average volume spike
Confirms institutional participation
Reduces false signals
4. Trend Alignment
50 EMA filter ensures trades align with higher timeframe trend
Long trades above EMA, short trades below
Prevents costly counter-trend trades
5. Risk Management
2:1 Risk/Reward minimum ensures profitability with 40%+ win rate
Percentage-based stops adapt to USDJPY volatility (0.3% default)
Configurable position sizing
🎯 Entry Conditions
(see the generated image above)
Long Entry (BUY)
✅ Bullish FVG detected in previous bars
✅ Price returns to FVG zone during active trading session
✅ Volume spike above 1.5x average
✅ Price above 50 EMA (trend confirmation)
✅ Bullish candle closes within FVG zone
✅ Trading during Tokyo open OR London/NY overlap
Short Entry (SELL)
✅ Bearish FVG detected in previous bars
✅ Price returns to FVG zone during active trading session
✅ Volume spike above 1.5x average
✅ Price below 50 EMA (trend confirmation)
✅ Bearish candle closes within FVG zone
✅ Trading during Tokyo open OR London/NY overlap
📈 Expected Performance
Backtesting Results (Based on Similar Strategies):
Win Rate: 44-59% (profitable due to high R:R ratio)
Average Winner: 60-90 pips during London/NY sessions
Average Loser: 30-40 pips (tight stops at FVG boundaries)
Risk/Reward: 2:1 minimum, often 3:1 during strong trends
Best Performance: Monday Tokyo opens and Wednesday London/NY overlaps
Why This Works for USDJPY:
90% correlation with US-Japan bond yield spreads
High volatility provides sufficient pip movement
Heavy institutional/central bank participation creates clear FVGs
Consistent volatility patterns across trading sessions
⚙️ Configurable Parameters
Session Settings:
Trade Tokyo Session (Enable/Disable)
Trade London/NY Overlap (Enable/Disable)
FVG Settings:
FVG Minimum Size (Filter small gaps)
Maximum FVG Age (20 bars default)
Show FVG Markers (Visual display)
Volume Settings:
Use Volume Filter (Enable/Disable)
Volume Multiplier (1.5x default)
Volume Average Period (20 bars)
Trend Settings:
Use Trend Filter (Enable/Disable)
Trend EMA Period (50 default)
Risk Management:
Risk/Reward Ratio (2.0 default)
Stop Loss Percentage (0.3% default)
🎨 Visual Indicators
🟡 Yellow Line: 50 EMA trend filter
🟢 Green Triangles: Long entry signals
🔴 Red Triangles: Short entry signals
🟢 Green Dots: Bullish FVG zones
🔴 Red Dots: Bearish FVG zones
🟦 Blue Background: Tokyo open session
🟧 Orange Background: London/NY overlap
📊 Recommended Settings
Optimal Timeframes:
Primary: 5-minute charts (scalping)
Secondary: 15-minute charts (swing trading)
Parameter Optimization:
Conservative: Stop Loss 0.2%, R:R 2:1, Volume 2.0x
Balanced: Stop Loss 0.3%, R:R 2:1, Volume 1.5x (default)
Aggressive: Stop Loss 0.4%, R:R 1.5:1, Volume 1.2x
Risk Management:
Maximum 1-2% of account per trade
Daily loss limit: Stop after 3-5 consecutive losses
Use fixed percentage position sizing
⚠️ Important Considerations
Avoid Trading During:
Major news events (BOJ interventions, NFP, FOMC)
Holiday periods with reduced liquidity
Low volatility Asian afternoon sessions
When US-Japan yield differential narrows sharply
Best Practices:
Limit to 2-3 trades per session maximum
Always respect the 50 EMA trend filter
Never risk more than planned per trade
Paper trade for 2-4 weeks before live implementation
Track performance by session and day of week
🚀 How to Use
Add the script to your USDJPY chart
Set timeframe to 5-minute or 15-minute
Adjust parameters based on your risk tolerance
Enable strategy alerts for automated notifications
Wait for visual signals (triangles) to appear
Enter trades according to your risk management rules
📚 Strategy Foundation
This strategy is based on:
Smart Money Concepts (SMC): Institutional order flow tracking
Market Microstructure: Understanding how FVGs form in electronic trading
Quantified Risk Management: Statistical edge through proper R:R ratios
Session Liquidity Patterns: Exploiting predictable volatility cycles

Volume Profile Two-Tone - Hit Counter - Meter V1 Volume Profile Two-Tone - Hit Counter - Meter V1
Overview
The Volume Profile Two-Tone - Hit Counter - Meter V1 is a Pine Script v6 indicator for TradingView, designed to visualize buy and sell activity distribution across price levels within a user-defined window or intraday session. It plots a dual-color horizontal histogram showing buying (green) and selling (red) volume intensity, along with optional hit-count numbers and meter overlays. The profile dynamically updates as new bars form, providing an intuitive picture of where market participants are most active.
The enhanced V1 edition introduces persistent hit counts, real-time adaptive row rebuilding, and improved memory management for smoother performance in both rolling-window and session modes.
How It Works
The indicator divides the selected range into rows (price bins) and aggregates trade volume (or tick volume) per bar.
Each bin separately sums up bullish and bearish contributions based on candle direction and delta logic, then draws side-by-side histogram bars:
• Buy Volume (green): Total volume from bullish bars within the bin.
• Sell Volume (red): Total volume from bearish bars within the bin.
A rolling or session-based window determines how many recent bars are analyzed. Value Area (VA), Point of Control (POC), and total hits per bin are computed continuously. The display auto-adjusts as price moves, keeping the profile anchored to the latest visible bars.
Behind the scenes, optimized arrays manage active boxes, lines, and labels for each bin. Functions like ensure_rows() rebuild buffers only when necessary, guaranteeing efficiency without repainting past data. Persistent hit-tracking ensures each price level maintains its count even when temporarily hidden.
Key Features
• Dual-Tone Volume Histogram: Buy/sell split with distinct colors for immediate visual contrast.
• Rolling or Session Profiles: Choose between continuous rolling windows or intraday session resets.
• Persistent Hit Counts: Displays total touches per bin, remaining stored even when bins refresh.
• Adaptive Row Management: Automatic rebuilding when zooming, scrolling, or changing resolution.
• Value Area + POC Detection: Highlights the most active price levels and volume concentration zones.
• Meter Overlay Option: Adds gradient bars or directional meters for quick trend context.
• Performance Optimized: Uses lightweight arrays and cached line handles for minimal CPU load.
• Custom Color Control: Editable buy/sell colors, opacity, row count, and profile width.
• Full Persistence Mode: Profiles remain visually consistent across bar updates without redraw gaps.
What It Displays
The Volume Profile Two-Tone - Hit Counter - Meter V1 presents an adaptive horizontal histogram beside the chart’s candles, revealing how volume is distributed across price.
• Green segments show dominant buying interest; red segments reveal selling pressure.
• POC line identifies the highest-volume price.
• Hit-count numbers quantify how often price traded at each level.
• Optional meters display relative directional strength within the same range.
This visual layering helps traders quickly identify supply/demand zones, balance areas, and developing auction profiles across intraday or multi-session contexts.
Originality
The Pine Script v6 indicator uses efficient array management (array.new_*, array.set, array.get) and native math operations for rendering.
It avoids external dependencies, relying only on built-in TradingView functions like request.security, box.new, line.new, and label.new for dynamic plotting.
Common Ways People Use It
• Scalpers: Study short-term imbalances or high-activity levels to time entries/exits.
• Day Traders: Track evolving session volume and POC migration.
• Swing Analysts: Compare rolling distributions to identify value shifts over multiple days.
• Volume Profilers: Combine with VWAP or order-flow tools for deeper context.
Configuration Notes
Profile Mode: Select Rolling Window (bars) or Session (intraday).
Rows and Width: Default = 72 rows, 44 bars width.
Colors and Opacity: Adjust to match chart theme.
Performance Mode: Choose Accurate or Fast (approximate) for speed control.
Show Hits / Meter: Enable hit-count numbers and gradient meters for added context.
Legal Disclaimer
For informational and educational purposes only—not investment, financial, or trading advice. Past performance does not guarantee future results; trading involves significant risk. Provided “as is,” without warranties. Consult a qualified professional before making decisions. By using, you accept all risks and agree to this disclaimer.

Volume x Close in CroresThis indicator provides a clear visualization of the monetary volume activity for each candle by calculating the product of trading volume and closing price and converting it into crores for easier readability.

My EMA IndicatorMy Absolutely Profitable Indicator
It can be use when ema9 crosses ema100 and so on...
Use it with Volume Oscillator...

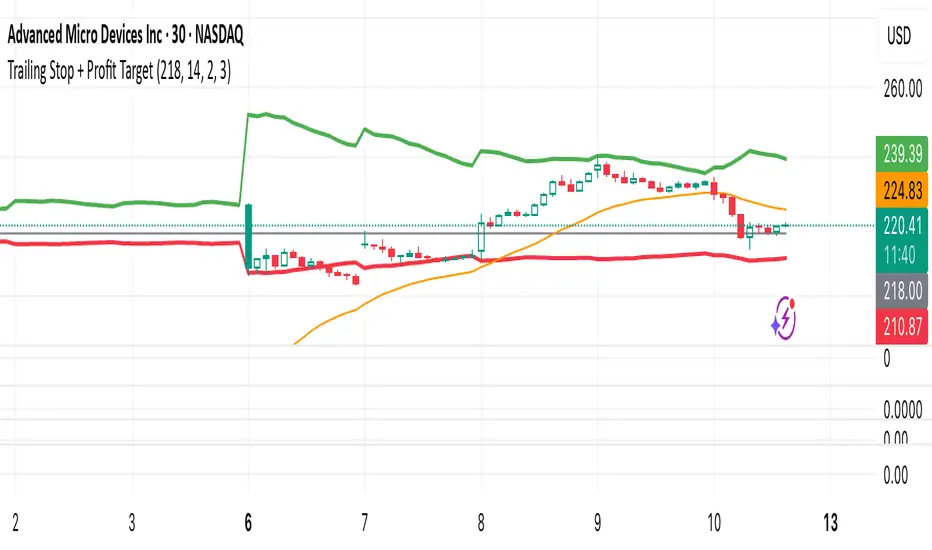
Trailing Stop + Profit TargetTrailing Stop + Exit Confirmation is a manual-entry tool designed to help traders visually manage trades with dynamic trailing stops and profit targets, based on ATR projections with a toggle button to reset calculations in real-time. Contains a “Short” toggle to work for short positions as well, which automatically inverses the PT and SL lines when toggled on.
Primary Calculations: Utilizes a manually adjustable entry price (default: $5 — ideal for options traders) that (when adjusted and recalculated) populates the chart with an adaptive ATR-based trailing stop line, dynamic profit target line, and optional 21-day EMA for directional context.
Below the Entry Price is a fully functional, manual reset toggle to reset all parameters mid-session to assess risk-reward based on entry price, risk tolerance, etc. followed by the “Short” toggle.
Primary Directions/Functions:
Enter your trade price in the “Manual Entry Price” field.
The script will begin plotting a dynamic trailing stop and profit target based on current market conditions.
Use the reset toggle to clear all calculations and start a new position at any time.
Customizable Settings:
ATR Length and Multiplier
Risk/Reward Profit Target Multiplier
Toggle to show/hide trailing stop, target, and EMA lines
Options Trading Use Case:
This tool is especially useful for options traders looking to manage premium-based entries (e.g., $5.00) on intraday or swing trades. The dynamic stop and target lines provide clear visual cues for scaling out or exiting based on price action, while allowing for tighter or looser risk depending on volatility (ATR).
This tool does not auto-detect entries or backtest positions. It is intended to complement your entry signals, not generate them. I've written an Options Momentum Signal indicator you can find right here which functions well in tandem with this tool.
Made for traders who execute trades manually and want typical preset guidelines for profit and stop loss signals but lets you recalculate them by simply clicking a button, especially if any major news or downturn causes a big change in market conditions so you can make adjustments in real time.
Wyckoff Effort vs. Result📌 Wyckoff Effort vs. Result (E/R) – Visualizing Supply & Demand Imbalance with Volume Confirmation
📖 Overview
The Wyckoff Effort vs. Result (E/R) indicator is designed to help traders interpret market behavior through the lens of volume vs. price movement — a foundational concept in Richard Wyckoff’s methodology.
This tool aims to highlight moments where the “effort” (volume) is not in proportion to the “result” (price movement) — giving insight into potential accumulation or distribution events.
By detecting high-volume candles and classifying them based on their price direction, the indicator visualizes zones where smart money might be active .
⚙️ How It Works
1. Effort Accumulation (High Volume Down Bar):
• When a candle closes lower than it opens (down bar) and has above-average volume , it’s marked as potential absorption of selling pressure (effort to push down met by buying).
• These candles are colored red and the open level is plotted, acting as a potential support or re-test zone.
2. Effort Distribution (High Volume Up Bar):
• When a candle closes higher than it opens (up bar) and has above-average volume , it’s marked as potential distribution (effort to push up absorbed by sellers).
• These candles are colored green and the open level is plotted , acting as a potential resistance or rejection zone.
3. Average Volume Calculation:
• The script calculates a simple moving average (SMA) of volume over a user-defined lookback period.
• If current volume exceeds the average multiplied by a set threshold, it’s treated as a high-effort bar .
🧪 Inputs
Input Description
Average Volume Lookback - Number of bars used to calculate the volume average
High Volume Multiplier. - Multiplier to define what qualifies as “high volume”
🖥️ Visual Output
• 🔴 Red candles = High volume on a down bar → possible accumulation
• 🟢 Green candles = High volume on an up bar → possible distribution
• 📉 Horizontal lines at bar open price mark the potential zones where effort occurred
These zones can serve as:
• Areas of support/resistance
• Trap zones where smart money absorbs liquidity
• Entry/exit filters when combined with price action
🧠 How to Use
• Use in combination with price structure, support/resistance, and volume profile tools
• Watch how price reacts when it revisits the plotted lines
• Look for effort bars that fail to lead to continuation, signaling potential reversal
• Can be used in scalping, swing trading, or Wyckoff-style phase analysis
🔒 Technical Notes
• ✅ Does not repaint
• ✅ Built with Pine Script v6
• ✅ Lightweight and customizable
• ❌ Does not generate buy/sell signals — it provides context, not predictions

Cnagda Pure Price ActionCnagda Pure Price Action (CPPA) indicator is a pure price action-based system designed to provide traders with real-time, dynamic analysis of the market. It automatically identifies key candles, support and resistance zones, and potential buy/sell signals by combining price, volume, and multiple popular trend indicators.
How Price Action & Volume Analysis Works
Silver Zone – Logic, Reason, and Trade Planning
Logic & Visualization:
The Silver Zone is created when the closing price is the lowest in the chosen window and volume is the highest in that window.
Visually, a large silver-colored box/rectangle appears on the chart.
Thick horizontal lines (top and bottom) are drawn at the high and low of that candle/bar, extending to the right.
Reasoning:
This combination typically occurs at strong “accumulation” or support areas:
Sellers push the price down to the lowest point, but aggressive buyers step in with high volume, absorbing supply.
Indicates potential exhaustion of selling and likely shift in market control to buyers.
How to Plan Trades Using Silver Zone:
Watch if price returns to the Silver Zone in the future: It often acts as powerful support.
Bullish entries (buys) can be planned when price tests or slightly pierces this zone, especially if new buy signals occur (like yellow/green candle labels).
Place your stop-loss below the bottom line of the Silver Zone.
Target: Look for the nearest resistance or opposing zone, or use indicator’s bullish label as confirmation.
Extra Tip:
Multiple touches of the Silver Zone reinforce its importance, but if price closes deeply below it with high volume, that’s a caution signal—support may be breaking.
Black Zone – Logic, Reason, and Trade Planning (as CPPA):
Logic & Visualization:
The Black Zone is created when the closing price is the highest in the chosen window and volume is the lowest in that window.
Visually, a large black-colored box/rectangle appears on the chart, along with thick horizontal lines at the top (high) and bottom (low) of the candle, extending to the right.
Reasoning:
This combination signals a strong “distribution” or resistance area:
Buyers push the price up to a local high, but low volume means there is not much follow-through or conviction in the move.
Often marks exhaustion where uptrend may pause or reverse, as sellers can soon step in.
How to Plan Trades Using Black Zone:
If price revisits the Black Zone in the future, it often acts as major resistance.
Bearish entries (sells) are considered when price is near, testing, or slightly above the Black Zone—especially if new sell signals appear (like blue/red candle labels).
Place your stop-loss just above the top line of the Black Zone.
Target: Nearest support zone (such as a Silver Zone) or next indicator’s bearish label.
Extra Tip:
Multiple touches of the Black Zone make it stronger, but if price closes far above with rising volume, be cautious—resistance might be breaking.
Support Line – Logic, Reason, and Trade Planning (as Cppa):
Logic & Visualization:
The Support Line is a dynamically drawn dashed line (usually blue) that marks key price levels where the market has previously shown significant buying interest.
The line is generated whenever a candle forms a high price with high volume (orange logic).
The script checks for historical pivot lows, past support zones, and even higher timeframe (HTF) supports, and then extends a blue dashed line from that price level to the right, labeling it (sometimes as “Prev Support Orange, HTF”).
Reasoning:
This line helps you visually identify where demand has been strong enough to hold price from falling further—essentially a floor in the market used by professional traders.
If price approaches or re-tests this line, there’s a good chance buyers will defend it again.
How to Plan Trades Using Support Line:
Watch for price to approach the Support Line during down moves. If you see a bullish candlestick pattern, buy labels (yellow/green), or other indicators aligning, this can be a high-probability entry zone.
Great for planning stop-loss for long trades: place stops just below this line.
Target: Next resistance zone, Black Zone, or the top of the last swing.
Extra Tip:
Multiple confirmations (support line + Silver Zone + bullish label) provide powerful entry signals.
If price closes strongly below the Support Line with volume, be cautious—support may be breaking, and a trend reversal or deeper correction could follow.
Resistance Line – Logic, Reason, and Trade Planning (from CPPA):
Logic & Visualization:
The Resistance Line is a dynamically drawn dashed line (usually purple or red) that identifies price levels where the market has previously faced significant selling pressure.
This line is created when a candle reaches a high price combined with high volume (orange logic), or from a historical pivot high/resistance,
The script also tracks higher timeframe (HTF) resistance lines, labeled as “Prev Resistance Orange, HTF,” and extends these dashed lines to the right across the chart.
Reasoning:
Resistance Lines are visual markers of “supply zones,” where buyers previously failed, and sellers took control.
If the price returns to this line later, sellers may get active again to defend this level, halting the uptrend.
How to Plan Trades Using Resistance Line:
Watch for price to approach the Resistance Line during up moves. If you see bearish candlestick patterns, sell labels (blue/red), or bearish indicator confirmation, this becomes a strong shorting opportunity.
Perfect for placing stop-loss in short trades—put your stop just above the Resistance Line.
Target: Next support zone (Silver Zone) or bottom of the last swing.
If the price breaks above with high volume, avoid shorting—resistance may be failing.
Extra Tip:
Multiple resistances (Resistance Line + Black Zone + bearish label) make short signals stronger.
Choppy movement around this line often signals indecision; wait for a clear rejection before entering trades.
Bullish / Bearish Label – Logic, Reason, and Trade Planning:
Logic & Visualization:
The indicator constantly calculates a "Bull Score" and a "Bear Score" based on several factors:
Trend direction from price slope
Confirmation by popular indicators (RSI, ADX, SAR, CMF, OBV, CCI, Bollinger Bands, TWAP)
Adaptive scoring (higher score for each bullish/bearish condition met)
If Bull Score > Bear Score, the chart displays a green "BULLISH" label (usually below the bar).
If Bear Score > Bull Score, the chart displays a red "BEARISH" label (usually above the bar).
If neither dominates, a "NEUTRAL" label appears.
Reasoning:
The labels summarize complex price action and indicator analysis into a simple, actionable sentiment cue:
Bullish: Majority of conditions indicate buying strength; trend is up.
Bearish: Majority signals show selling pressure; trend is down.
How to Use in Trade Planning:
Use the Bullish label as confirmation to enter or hold long (buy) positions, especially if near support/Silver Zone.
Use the Bearish label to enter/hold short (sell) positions, especially if near resistance/Black Zone.
For best results, combine with candle color, volume analysis, or other labels (yellow/green for buys, blue/red for sells).
Avoid trading against these labels unless you have strong confluence from zones/support levels.
Yellow Label (Buy Signal) – Logic, Reason & Trade Planning:
Logic & Visualization:
The yellow label appears below a candle (label.style_label_up, yloc.belowbar) and marks a potential buy signal.
Script conditions:
The candle must be a “yellow candle” (which means it’s at the local lowest close, not a high, with normal volume).
Volume is decreasing for 2 consecutive candles (current volume < previous volume, previous volume < second previous).
When these conditions are met, a yellow label is plotted below the candle.
Reasoning:
This scenario often marks the end of selling pressure and start of possible accumulation—buyers may be stepping in as sellers exhaust.
Decreasing volume during a local price low means selling is slowing, possibly hinting at a reversal.
How to Trade Using Yellow Label:
Entry: Consider buying at/just above the yellow-labeled candle’s close.
Stop-loss: A bit below the candle’s low (or Silver Zone line, if present).
Target: Next resistance level, Black Zone, or chart’s bullish label.
Extra Tip:
If the yellow label is found at/near a Silver Zone or Support Line, and trend is “Bullish,” the setup gets even stronger.
Avoid trading if overall indicator shows “Bearish.”
Green Label (Buy with Increasing Volume) – Logic, Reason & Trade Planning:
Logic & Visualization:
The green label is plotted below a candle (label.style_label_up, yloc.belowbar) and marks a strong buy signal.
Script conditions:
The candle must be a “yellow candle” (at the local lowest close, normal volume).
Volume is increasing for 2 consecutive candles (current volume > previous volume, previous volume > second previous).
When these conditions are met, a green label is plotted below the candle.
Reasoning:
This scenario signals that buyers are stepping in aggressively at a local price low—the end of a downtrend with strong, rising activity.
Increasing volume at a price low is a classic sign of accumulation, where institutions or large players may be buying.
How to Trade Using Green Label:
Entry: Consider buying at/just above the green-labeled candle’s close for a momentum-based reversal.
Stop-loss: Slightly below the candle’s low, or the Silver Zone/support line if present.
Target: Nearest resistance zone/Black Zone, indicator’s bullish label, or next swing high.
Extra Tip:
If the green label is near other supports (Silver Zone, Support Line), the setup is extra strong.
Use confirmation from Bullish labels or trend signals for best results.
Green label setups are suitable for quick, high momentum trades due to increasing volume
Blue Label (Sell Signal on Decreasing Volume) – Logic, Reason & Trade Planning:
Logic & Visualization:
The blue label is plotted above a candle (label.style_label_down, yloc.abovebar) as a potential sell signal.
Script conditions:
The candle is a “blue candle” (local highest close, but not also lowest, and volume is neither highest nor lowest).
Volume is decreasing over 2 consecutive candles (current volume < previous, previous < two ago).
When these match, a blue label appears above the candle.
Reasoning:
This typically signals buyer exhaustion at a local high: price has gone up, but volume is dropping, suggesting big players may not be buying any more at these levels.
The trend is losing strength, and a reversal or pullback is likely.
How to Trade Using Blue Label:
Entry: Look to sell at/just below the candle with the blue label.
Stop-loss: Just above the candle’s high (or above the Black Zone/resistance if present).
Target: Nearest support, Silver Zone, or a swing low.
Extra Tip:
Blue label signals are stronger if they appear near Black Zones or Resistance Lines, or when the general market label is "Bearish."
As with buy setups, always check for confirmation from trend or volume before trading aggressively.
Here’s a summary of all key chart labels, zones, and trading logic of your Price Action script:
Silver Zone: Powerful support zone. Created at lowest close + highest volume. Best for buy entries near its lines.
Black Zone: Strong resistance zone. Created at highest close + lowest volume. Ideal for short trades near its levels.
Support Line: Blue dashed line at historical demand; buyers defend here. Look for bullish setups when price approaches.
Resistance Line: Purple/red dashed line at supply; sellers defend here. Great for bearish setups when price nears.
Bullish/Bearish Labels: Summarize trend direction using price action + multiple indicator confirmations. Plan buys, holds on bullish; sells, shorts on bearish.
Yellow Label: Buy signal on decreasing volume and local price low. Entry above candle, stop below, target next resistance.
Green Label: Strong buy on increasing volume at a price low. Entry for momentum trade, stop below, target next zone.
Blue Label: Sell signal on dropping volume and local price high. Entry below candle, stop above, target next support.
Best Practices:
Always combine zone/label signals for higher probability trades.
Use stop-loss near zones/lines for risk management.
Prefer trading in the trend direction (bullish/bearish label agrees with your entry).
if Any Question, Suggestion Feel free to ask
Disclaimer:
All information provided by this indicator is for educational and analysis purposes only, and should not be considered financial advice.

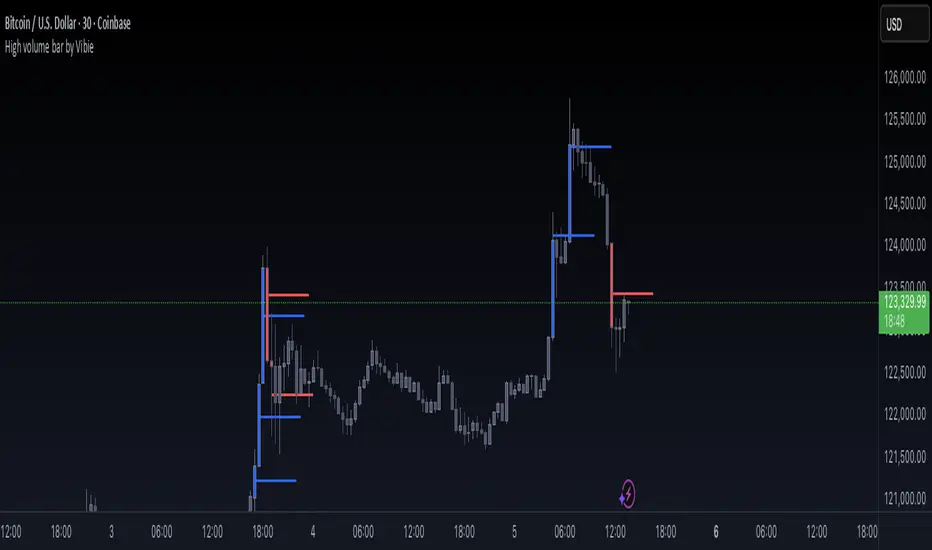
High volume bar by VibieHigh Volume Bar with Extended vPOC (Aggregation Enabled)
🧠 Concept
This indicator is designed to detect institutional activity and large traders by using statistical volume analysis and identifying key intrabar liquidity levels.
It applies Z-Score volume analysis to highlight unusually high volume candles and marks the Volume Point of Control (vPOC) inside each detected bar — the price level where the most volume was transacted.
⸻
⚙️ How It Works
1. Z-Score Volume Analysis
• The indicator calculates how far current volume deviates from its historical average using standard deviations (Z-Score).
• When the Z-Score exceeds the user-defined threshold, the candle is flagged as a High Volume Bar (HVB).
2. Multi-Exchange Aggregation
• Volumes from Binance, Bybit, and Coinbase can be aggregated into a composite volume metric.
• This provides a broader and more accurate market perspective, minimizing anomalies from individual exchanges.
3. Candle Coloring
• Bullish HVB → entire candle (body + wicks) is colored blue.
• Bearish HVB → entire candle is colored red.
• This makes large volume events immediately visible on the chart.
4. vPOC Detection
• The script examines a lower timeframe (e.g., 1 minute) within the HVB to find the price level with the highest traded volume.
• A horizontal line is drawn at that price and can be extended for multiple bars, marking a short-term liquidity zone that often acts as support or resistance.
⸻
🧭 How to Use
• vPOC levels frequently act as liquidity magnets and are often retested after the HVB appears.
• Bullish HVB + vPOC below current price = potential long entry zone.
• Bearish HVB + vPOC above price = potential short entry zone.
• Useful for identifying institutional absorption, stop runs, or hidden accumulation/distribution.
⸻
🌟 Why It’s Original and Useful
• Combines statistical volume analysis (Z-Score) with intrabar volume profiling.
• Aggregates multiple exchanges for broader accuracy.
• Offers precise liquidity levels that classic indicators don’t provide.
• Especially valuable for advanced traders looking for institutional footprints.
HUNT_line [Dr.Forexy]HUNT_line Indicator
📊 **Category:** Price Action & Market Structure
⏰ **Recommended Timeframe:** 5-minute and higher
🎯 **Purpose:** Advanced market structure visualization for professional traders
⸻
⚡ **Key Features:**
• Break of Structure (BOS) and Change of Character (CHOCH) detection
• Internal & Swing Market Structure analysis
• Order Blocks identification with smart filtering
• Fair Value Gaps (FVG) visualization
• Premium/Discount Zones
• Multi-timeframe support
• Real-time structure alerts
⸻
🛠 **How to Use:**
1. Apply on 5M or higher timeframes for best results
2. Monitor BOS/CHOCH for trend direction changes
3. Use Order Blocks as potential support/resistance areas
4. Watch for FVG fills as price inefficiency zones
5. Combine multiple confluences for higher probability setups
⸻
⚠️ **Risk Disclaimer:**
This indicator is for educational purposes only.
Not financial advice. Always conduct your own research.
⸻
🔹 **Credits:**
Inspired by LuxAlgo's "Smart Money Concepts" with custom improvements

CNagda-MomentumX - Institutional FlowMomentumX is designed to empower traders with a deeper understanding of market movements by focusing on Institutional Flow and advanced market structure analytics. The core goal is to identify and visualize where major market participants are operating, and to translate these complex footprints into clear, actionable trading signals — all in real time.
Real-time institutional activity mapping
Actionable entry and exit signals based on live market structure
Intuitive dashboard and dynamic chart visuals
Fully customizable modules for trend, liquidity, and order blocks
Core Logic Design
At the heart of MomentumX lies a robust algorithmic engine built to capture and surface institutional trading behavior. By leveraging advanced mathematical models, the indicator calculates institutional volume ratios and price momentum to pinpoint aggressive moves from large participants.
Institutional Volume & Price Momentum:
Utilizes custom volume indicators and price change analysis to detect strong buying or selling pressure, filtering out retail noise.
Liquidity Grab Detection & Activity Zones:
The script identifies liquidity grabs by monitoring abrupt price sweeps at major support/resistance levels—often where institutions trigger stop hunts or reversals. All critical activity zones are automatically color-coded on the chart for instant recognition.
Dashboard Visualization:
A fully dynamic dashboard table overlays live scores for accumulation, distribution, strength, and weakness—giving traders a real-time scan of market health.
Trendline & Order Block Architecture:
The logic auto-detects pivot highs/lows to draw smart trendlines, while the order block system highlights key reversal areas and breaker zones—making market structure clear and actionable.
MomentumX is packed with high-performance modules, each engineered to simplify complex market behavior and enhance decision-making for traders:
Institutional Flow Signals:
Instantly identifies spots where institutional players drive momentum, using unique volume and price activity analytics.
Bullish/Bearish Liquidity Grab Detection:
Marks abrupt price moves that signal stop hunts or reversals, letting traders anticipate snap-backs or trend shifts.
Trendline Auto-Detection:
Smartly draws trendlines based on significant swing highs and lows, automatically adjusting as price evolves.
Order Block System (Rejection/Breaker):
Spots and highlights key reversal zones with order block rectangles, confirming rejections or breakouts at strategic levels.
Dashboard and Bar Coloring:
A clean dashboard overlay presents live market scores, while dynamic bar coloring makes trend, strength, and high-activity periods instantly visible.
User Input Toggles for Each Module:
Every major feature is fully customizable—enable or disable modules to match individual trading setups or preferences.
Scripting/Development
MomentumX’s scripting process is modular, enabling clarity, scalability, and fast optimization throughout development:
Initialization & Inputs:
Start by defining all user input options, module toggles, color settings, and calculation parameters—ensuring maximum flexibility early on.
Core Calculation Functions:
Script advanced institutional volume and price momentum algorithms. Build out swing length logic, market state filters, and activity scoring methods.
Detection Engines:
Develop and integrate engines for liquidity grabs, automated trendline detection, and order block identification—each with dedicated functions for speed and precision.
Visual Overlays & Plotting:
Implement powerful plotting logic for colored bars, score dashboards, trendlines, reversal zones, and liquidity markers—making every data point clear and actionable on the chart.
Testing Handlers:
Add diagnostic panels and debug outputs to refine calculations and assure accuracy in every market environment.
Sample Trade Setups (Usage)
Cnagda MomentumX delivers clarity for multiple trading styles by providing timely, actionable setups grounded in institutional behavior and market structure. Here’s how traders can leverage the indicator for confident decision-making:
Liquidity Grab Reversal
Enter trades around detected liquidity grabs when price sweeps major support/resistance and the dashboard signals a momentum shift.
Example: Wait for a bullish/Bearish grab near market lows/high, with institutional flow turning positive/negative—enter long/short for potential mean reversion.
Order Block Breakout
Trade breakouts when price cleanly rejects or flips key order block zones highlighted on the chart.
Example: Short at a marked breaker block after a rejection signal, confirmed by a downward institutional activity spike.
Trendline Continuation
Ride established market moves by entering on trendline confirmations plotted by the auto-detect system.
Example: Go long after a trendline retest, confirmed by a green bar color and dashboard strength score.
Dashboard Confirmation
Combine dashboard metrics (strength, accumulation, distribution) with bar color overlays for multi-factor entries.
Example: Enter trades only when all market signals align in real time for maximum probability.
For Short Entry check -- Weakness : For Long Entry Check - Strength With Other Indications
MomentumX is not just another indicator – it’s your edge for reading the market like an insider. By transparently mapping institutional flow, uncovering hidden liquidity zones, and color-coding every major structure shift, MomentumX transforms complexity into actionable clarity. Whether you’re scalping, swing trading, or investing, you’ll gain a decisive, real-time advantage on every chart.
Embrace smarter decisions, adapt to changing market conditions instantly, and join a new generation of technically empowered traders.
Customize, observe, and let the market reveal opportunities in a way you’ve never experienced before.
Happy Trading

DEVEL Volume Intention 0.0.2Indicator that detects the price intention based on the volume of the last 20 candles. Highlighting a candle if the volume is significantly greater than the average and plotting a rectangle if so.
