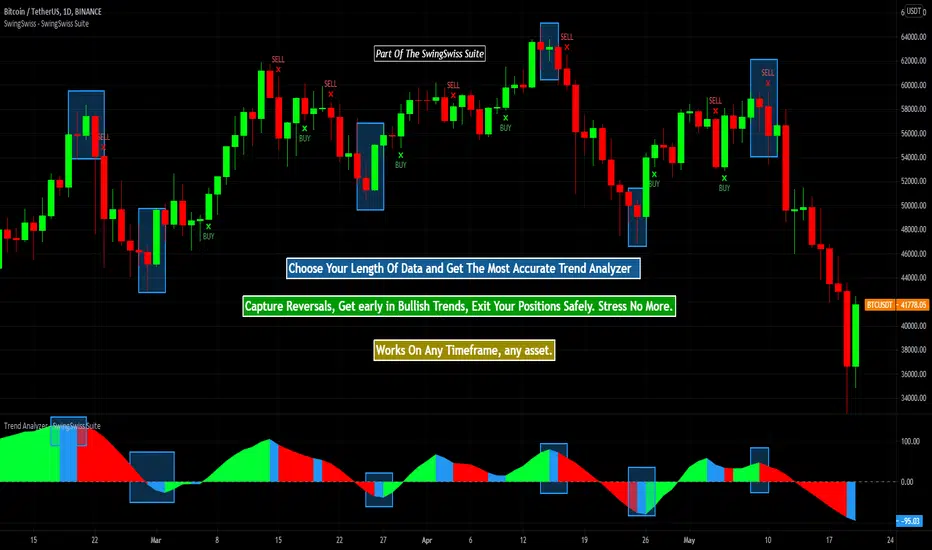
Trend Analyzer - SwingSwiss SuiteTrend Analyzer aims to define and analyze the trend of a particular asset at a given time using MACD, mathematical functions, and moving average.
It comes in very handy when determining an overall strategy or when you need to decide on whether a trade makes sense or not.
Finally, you can build a complete strategy around the indicator.
QUICK OVERVIEW
When the histogram is green, it means that the asset is currently bullish. Blue shows a possible reversal while red is synonymous with a bearish trend.
In the configuration panel, you can change the length of the data analysis.
The lower the number, the more recent the data captured is. Therefore, it's more predictive.
USE CASES
- You want to make a long trade on a 30mn chart but the indicator is red on the 30mn chart but also in the lower charts showing that the trend is not likely to reverse... You should think twice about that trade.
- You want to short the market on a 2h chart but on the lower charts, the green indicator is showing... Wait for a little bit, you might short at a higher price.
POSSIBLE STRATEGY
Let's take the BTCUSDT Future on the 2h chart :
You can display the indicator twice.
The first one with a length of 5, the second one with a length of 4.
To enter a long trade, wait for the green on length 5 and exit it at blue or red on length 4! It works like magic ;)
Disclaimer:
Trading and investing in the financial markets involves substantial risk of loss and is not suitable for every investor.
All trading strategies are used at your own risk.
Trend Analyzer is part of the SwingSwiss Suite, contact me for more info
Prediction
MACD Trendprediction Strategy V1A trend following indicator based on the MACD and EMA. In this case, signals are not generated by crossing the signal lines as with the MACD, but as soon as the distance between the signal lines increases or decreases. A profit factor of 1.6-3.5 is achieved.
Ein Trendfolge-Indikator, auf der Basis des MACD und EMA. Dabei werden Signale nicht wie bei dem MACD per Kreuzung der Signallinien generiert, sondern sobald ein der Abstand der Signallinien zu oder abnimmt.

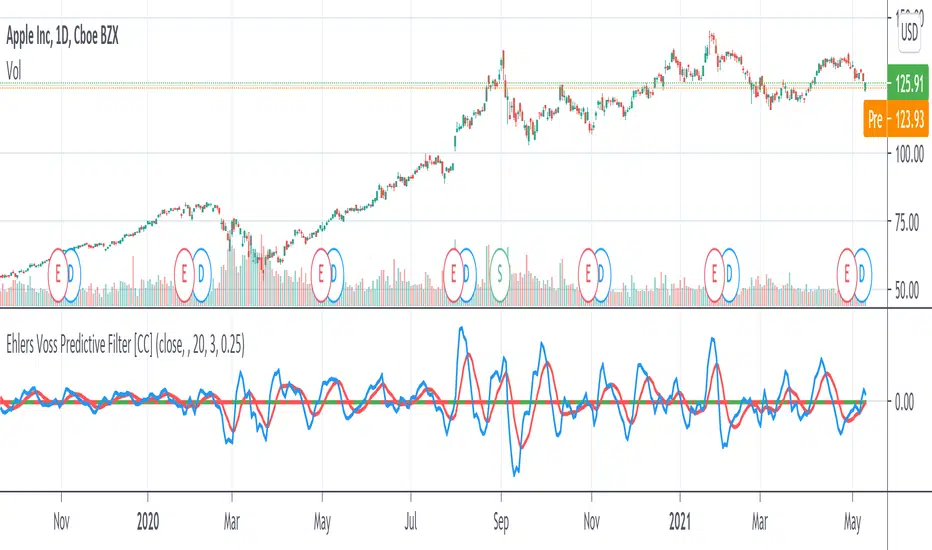
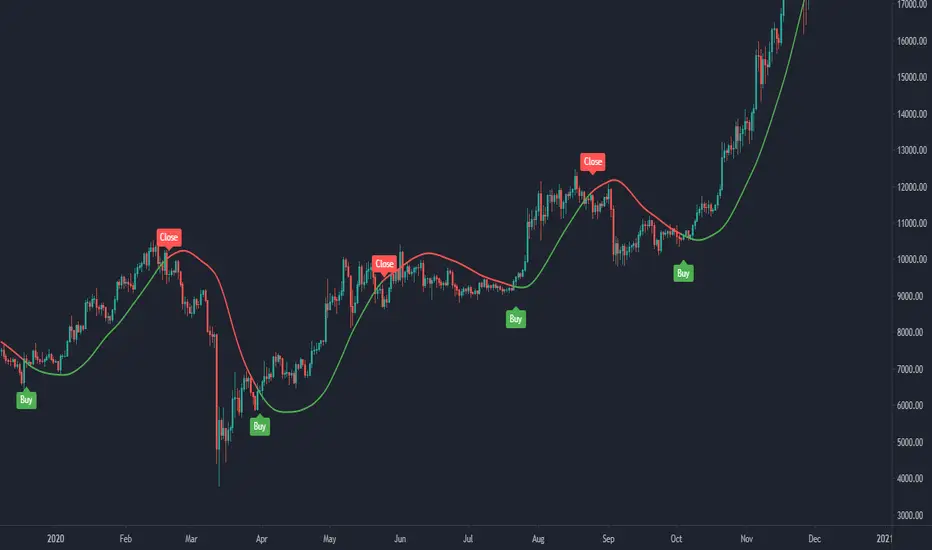
Ehlers Voss Predictive Filter [CC]The Voss Predictive Filter was created by John Ehlers (Stocks and Commodities August 2019) and this is a unique indicator in that it tries to predict future price action. I have color coded the middle line to show buy and sell signals so buy when the line turns green and sell when it turns red.
Let me know if there are any other indicators you want me to publish!
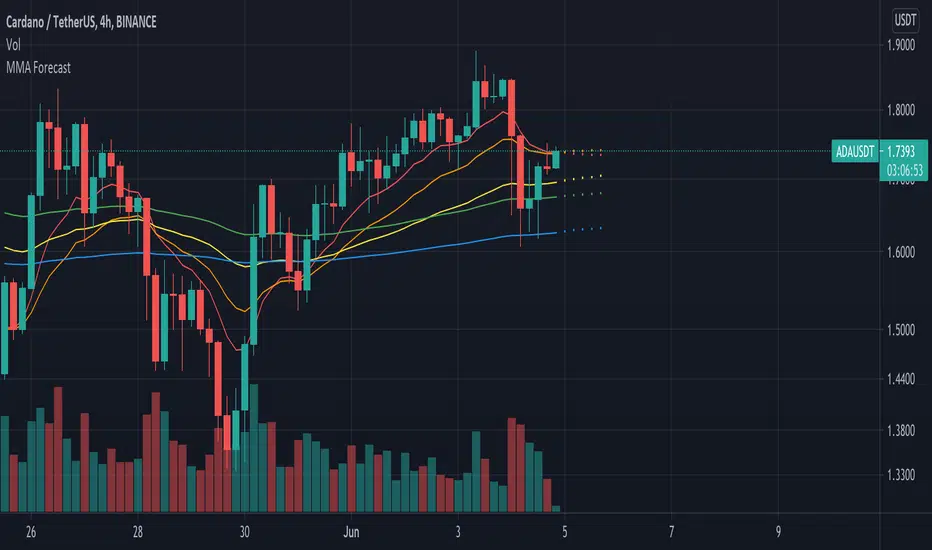
Multi Moving Average with ForecastThis script allows to use 5 different MAs with prediction of the next five periods.
[CADCHF] DinhChienFX's Predict signaltrend: crossing 2 times upper 2/lower 2 - stop/profit: 1/1 - Entry: Upper/lower 1, Entry 2: 0.66 (66%)
HH-HL/LL-LH: 15:15; ADX: 38, smooth: 9, DI: 9.
Order 1: 92 trades - 65.22% - R/R: 1/1
Order 2: 64 trades - 54.02% - R/R - 1/1.94 (fibonacci 66%)
Total 2 order: 156 trades - 59.62% - Net Profit: 201.46% - Max drawdown: 9.02%.
Commission: 4usd/trade
slippage: 2
1. Identify the trend
* On the chart:
a. Part of Dow theory: multi-trades active at the impulse waves.
Uptrend trend:
- HH / Higher High: The following peak is higher than the previous one .
- HL / Higher Low: The back bottom is higher than the previous one .
Downtrend:
- LL / Lower Low: The back bottom is lower than the previous one .
- LH / Lower High: The posterior peak is lower than the previous one
Pivot left: 15
Pivot right: 15
b. Keltner price channel:
- Uptrend: Go above Upper 2 two times
- Downtrend: Down to Lower 2 two times
* Under Chart:
ADX indicator: Used to identify a strong trend
- ADX smooth: 9
- DI: 9
- ADX = 38
2. Entry point:
- Buy: Buy limit at the Upper Keltner channel.
- Sell: Sell limit at the Lower Keltner channel.
3. Take profit, stoploss
ATR indicator (20) ( Average true range ) * 2

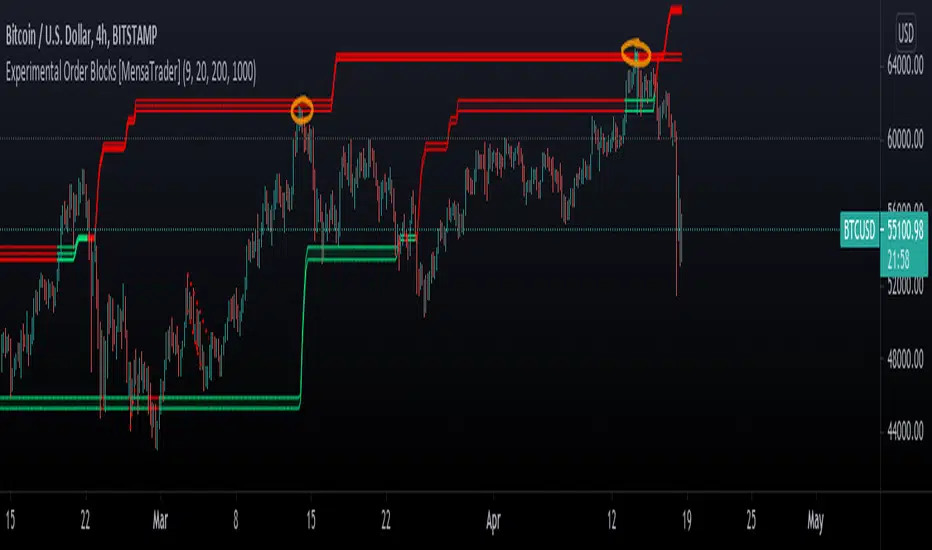
Experimental Order Blocks [MensaTrader]Boxes highlight Strong Support and resistance, Used to help find buy/sell or take profit zones.
Please note that this is experimental and far from perfect. feel free to play about with the variables in the settings, I've Found changing the look back length to 500 or 2000 can give very differnt results.
feel free to comment any suggestions I hope to update this in the near future
The script is written in version 4
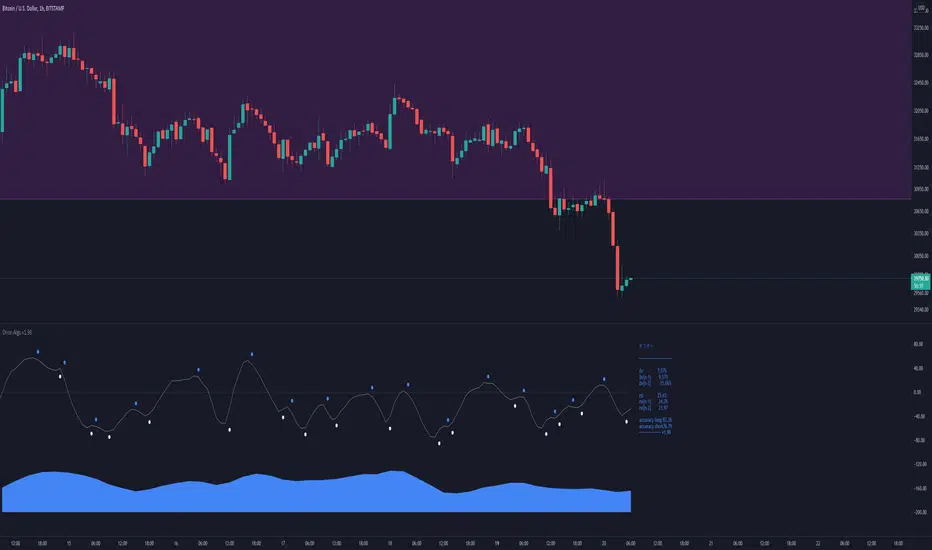
Orion AlgoOrion Algo is a next-gen trading algorithm designed to help traders find the highs and lows of the market before, during, and after they happen. We wanted to give an indicator to people that was simple to use. In fact we created the algorithm in such a way that it currently only needs a single input from the user. Since no indicator can predict the market perfectly, Orion should be used as just another tool (although quite a sharp one) for you to trade with. Fundamental knowledge of price action and TA should be used with Orion Algo.
Being an oscillator, Orion currently has a bias towards market volatility. So you will want to be trading markets over 30% volatility. We have plans to develop future versions that take this into account and adjust automatically for dead conditions. Also, while there are some similarities across all oscillators, what sets ours apart is the prediction curve. The prediction curve looks at the current signal values and gives it a relative score to approximate tops and bottoms 1-2 bars ahead of the signal curve. We also designed a velocity curve that attempts to predict the signal curve 2+ bars ahead. You can find the relative change in velocity in the Info panel. The bottom momentum wave is based on the signal curve and helps find overall market direction of higher time-frames while in a lower one.
Future Roadmap:
Create secondary on-bar indicator to pair with Orion Algo
Automatically adjust internal variables based on market volatility
Indicator style selection
Simple Strategy:
1. Start at a high time-frame to get an overview of the market you are wanting to enter. Daily is usually a good starting time.
2. If you can, add Orion to a second chart with a lower time-frame such as 4H.
3. Check the lower time frame to find potential medium term entry points based on where the trend was heading from the higher time-frame.
4. Step even lower to the 1H to find your optimal entry based on the higher times and technical analysis of the charts (support/resistance, patterns, etc)
5. The momentum wave can be used to find overall trend of the market. When it starts curving up, the market is bullish. When it curves down, the market could be bearish.
Intermediate Strategy:
1. Use simple strategy first.
2. Use the Prediction and ∆v curves to see future reversals in the works.
3. You can use these curves as potential entries as well as exit points.
4. Take into account potential divergence of the signal lines and price action.
Settings and How to Use them:
User Agreement – Orion Algo is a tool for you to use while trading. We aren’t responsible for losses OR the gains you make with it. By clicking the checkbox on the left you are agreeing to the terms.
Super Smooth – Smooths the main signal line based on the value inside the box. Lower values shift the pivot points to the left but also make things more noisy. Higher values move things to the right making it lag a bit more while creating a smoother signal. 8 is a good value to start with.
Theme – Changes the color scheme of Orion.
Info – Turns on a dashboard with useful stats, such as Delta v, Volatility, Rsi, etc. Changing the value box will move the dashboard left and right.
Pivots – Toggles main bull/bear dots.
Prediction – A secondary prediction model that attempts to predict a reversal before it happens (0-2bars). This can be noisy some times so make your best judgement. Curve will toggle a curve view of the prediction. Pivots will toggle bull/bear dots.
∆v – Delta v (change in velocity). This shows momentum of the signal. Crossing 0 signals a reversal. If you see the delta v changing direction, it may signify a reversal in the several bars depending on the overall momentum of the market.
Divergence – Toggles divergence lines. Hidden will show hidden divergences. Cross will show divergences that cross the 0 line.
Momentum Wave – Uses the signal as a macro trend indicator. Changes in direction of the wave can signify macro changes in the market. Average will toggle an averaging algorithm of the momentum waves and makes it easy to understand.
OBOS – Overbought/Oversold lines. Dyn will convert them to dynamic OBOS lines. The value box will adjust the smoothing.
Gartley PredictorThis script predicts the Gartley pattern.
What does it mean "predicts"? It checks the recent high/low points and tries to fit them into the X, A, B, and C points of the Gartley formation (both bearish and bullish). If there is a match, it draws the possible location for point D.
Does it mean that if there is a Gartley prediction, the price will surely go in that direction? Absolutely not! It means that if the price starts going in the direction of point D, it can change direction again around point D (it's called Potential Reversal Zone). In the above chart, it's more likely that the price will keep going up instead of turning direction and going down towards point D. You can read more about "good" and "bad" predictions on our blog.
"Gartley Predictor" a lightweight version of our Harmonic Predictor script that predicts all the common harmonic patterns (Gartley, Butterfly, Bat, Alternate Bat, Crab, Deep Crab, and Cypher).

[FTA] Logarithmic MACD with Regular and Hidden DivergencesThis is a highly stable, volatility adaptive, Moving Average Convergence Divergence (MACD) that uses a modified calculation based on improved logarithmic measurements of the momentum.
1- This MACD provides the trader with most accurate detection of divergences, both regular and hidden ones, and shows them on the MACD Histogram.
2- Furthermore, the MACD/Signal divergences are also easily detectable (unlike the regular MACD which often does not provide accurate divergences; see the screenshot for comparison).
3- Finally, due to some different calculation methods, this MACD, unlike the regular MACD, is highly stable in higher time frames even in the most volatile markets (such as BTC, ETH, ADA, etc...) and thus can easily be utilized for the market prediction state in the crypto (see the screenshot for comparison).
Use it and let me know what you think about it in comparison to regular MACD!

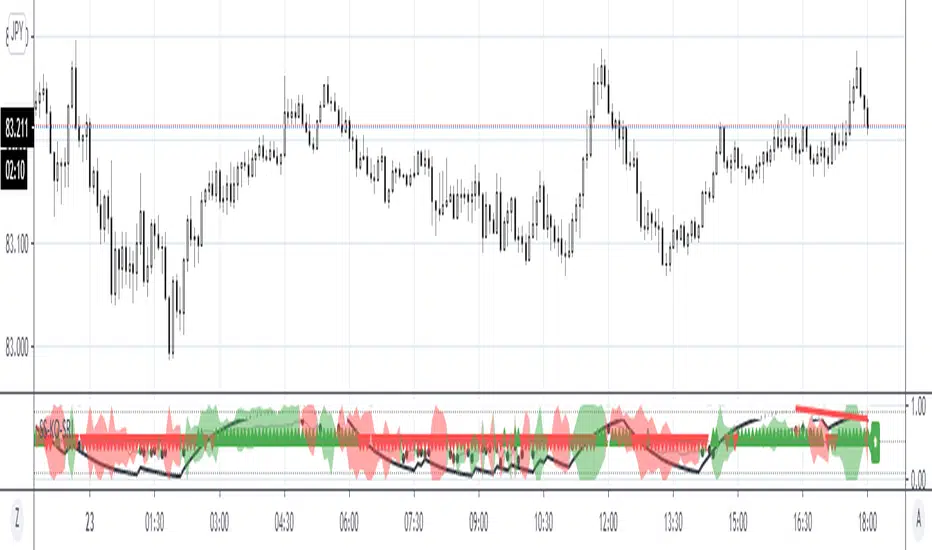
Similarity Search, Karobein and Seasonal Random IndexSimilarity Search, Karobein oscillator (KO) and Seasonal Random Index (SRI)
Description:
This indicator uses dynamic capabilities of Pinescript version 4 coupled with Seasonal Random Index (SRI) and Karobein Oscillator (KO). SRI (green/red areas) is employed to detect trends and KO (black curce) is used to find historical similarities to predict the next bar's direction. The midline arrows are the predictions produced by the similarity search algorithm.
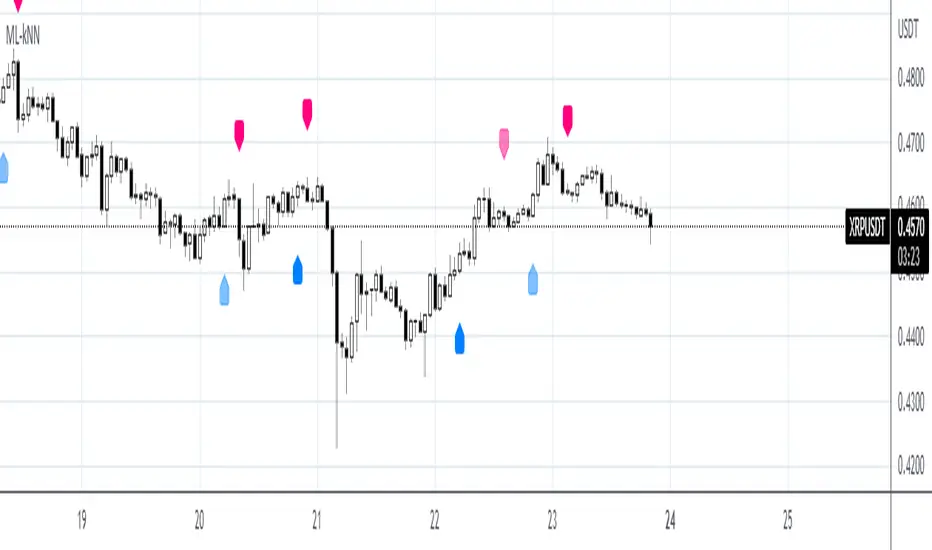
Machine Learning: kNN-based Strategy (update)kNN-based Strategy (FX and Crypto)
Description:
This update to the popular kNN-based strategy features:
improvements in the business logic,
an adjustible k value for the kNN model,
one more feature (MOM),
a streamlined signal filter and
some other minor fixes.
Now this script works in all timeframes !
I intentionally decided to publish this script separately
in order for the users to see the differences.

Betelgeuse-Good entry/exit zoneHello everyone and welcome!
This is the my first indicator and also the first version of Betelgeuse script,I hope you will like it.
The indicator was designed to be used on cryptocurrencies
The idea is to be able to identify good entry and exit points in the market, traders often try to identify the minimum or maximum points and this is why Betelgeuse was born.
Betelgeuse should be combined with your analysis and other indicators to find good entry and exit zones and not a precise point.Obviously the more the indicator will be used
over long time frames the more accurate the signals will be.
You can decide to wait for a good signal from the RSI or from the MACD and add up
the Betelegeuse confirmation for a good entry or exit from the market.
The MA based indicator will give you an idea of the direction of the medium term trend.
Direct message me for acces.
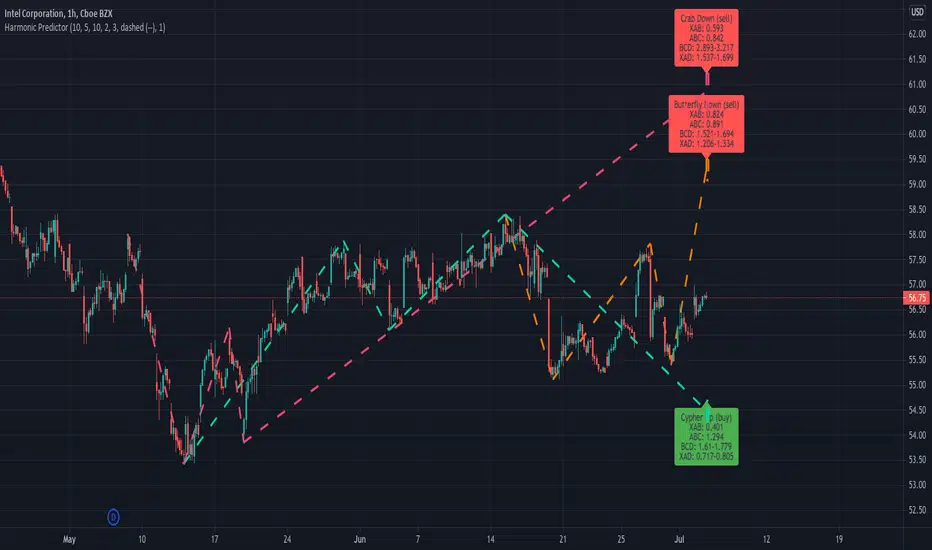
Harmonic PredictorHarmonic Predictor tries to predict where a harmonic formation might show up in the future. It checks the high/low points on the chart and tries to match them to the first 4 points of the XABCD formation. If there is a match, it estimates at what price level the last point (point D) will appear. And then it draws it with some error margin.
It can detect the Gartley, Butterfly, Bat, Alternate Bat, Crab, Deep Crab, and Cypher.
You can buy access to Harmonic Predictor on our website: www.patternshunters.com
It works nicely with the Harmonic Scanner :
Machine Learning: kNN-based StrategykNN-based Strategy (FX and Crypto)
Description:
This strategy uses a classic machine learning algorithm - k Nearest Neighbours (kNN) - to let you find a prediction for the next (tomorrow's, next month's, etc.) market move. Being an unsupervised machine learning algorithm, kNN is one of the most simple learning algorithms.
To do a prediction of the next market move, the kNN algorithm uses the historic data, collected in 3 arrays - feature1, feature2 and directions, - and finds the k-nearest
neighbours of the current indicator(s) values.
The two dimensional kNN algorithm just has a look on what has happened in the past when the two indicators had a similar level. It then looks at the k nearest neighbours,
sees their state and thus classifies the current point.
The kNN algorithm offers a framework to test all kinds of indicators easily to see if they have got any *predictive value*. One can easily add cog, wpr and others.
Note: TradingViews's playback feature helps to see this strategy in action.
Warning: Signals ARE repainting.
Style tags: Trend Following, Trend Analysis
Asset class: Equities, Futures, ETFs, Currencies and Commodities
Dataset: FX Minutes/Hours+++/Days
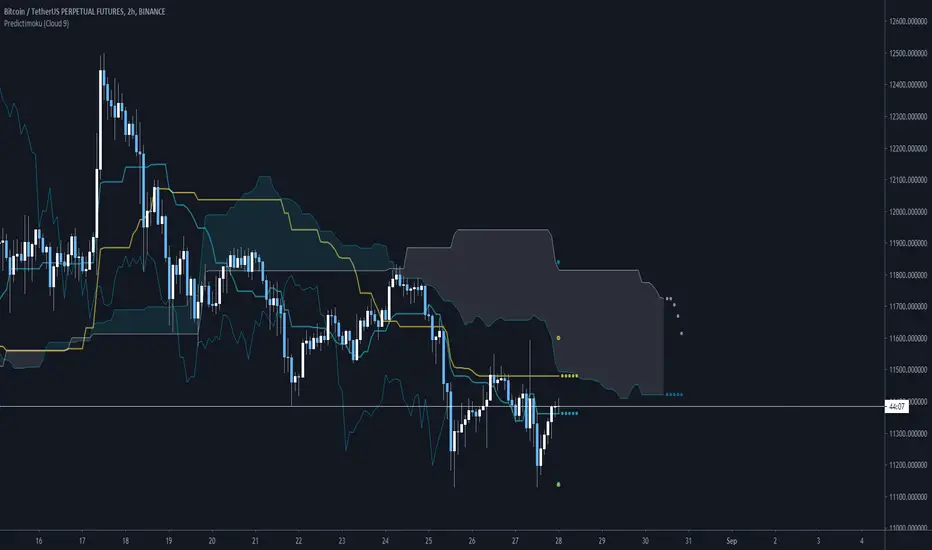
Predictimoku (Cloud 9) - Modified Ichimoku by Cryptorhythms [CR] Predictimoku (Cloud 9) - Modified Ichimoku by Cryptorhythms
📜Intro
New spin on the old standby ichimoku!
Predictimoku (Cloud 9): This indicator uses a proprietary algo to forecast the kijun tenkan & senkou spans accurately out into the future.
📋Background
Unfortunately you may have seen it around twitter as part of a paid for course with indicator set. These influencers claim its "their proprietary indicator". Well the truth is that the source code was stolen from me without payment by some folks who will remain nameless... Then they published the indicator as a private script to avoid moderation/ban (cowards!)
Lesson learned... this is why you never trust anyone until the money is in your hand. And if you see the indicator in the wild as part of some "guru's" overpriced course you will know who the thieves are!
But I wouldnt let that injustice or their shady behavior stand. So that now means you all will get access to it because I am providing it free for the public! :)
📋Features and How to Use
You use this indicator in all the same ways as you would use traditional ichimoku, the underlying structure is the same. Though the default settings are using doubled lookback lengths as per "crypto standard."
The extra functionality comes in the form of accurate and non repainting forecast of up to 17 bars for the kijun, tenkan and senkou spans! This can be useful in many ways for instance it can show you ahead of time when a kumo twist will happen, or a tenkan/kijun cross, etc!
💠Here is an example of the 17 bar forecast:
💠Here is an example of the Trading Range option to show you where price would need to go to force a recalculation of the forecasts. It also provides areas of interest for PA reactions.
💠Last an example of the fibonacci spread. By default the Auto Fib's lookback length is set to 60 to match the kijun lookback. This generally produces a nice framework for near future price action.
💠Look for some more new and unique ichimoku based indicators coming soon from us! :)
About Us
👍 We hope you enjoyed this indicator and find it useful! We post free crypto analysis, strategies and indicators regularly. This is our 84th script on Tradingview! Check signature for more information.
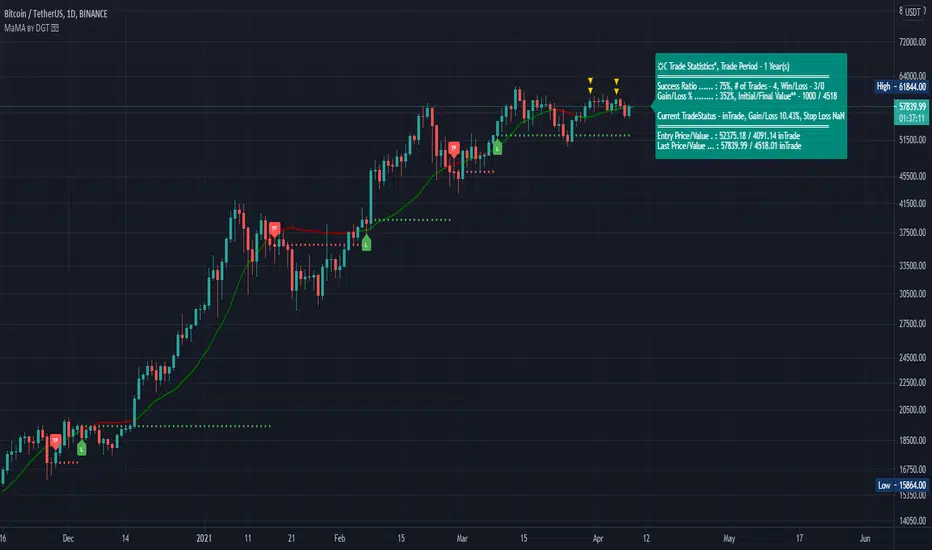
Momentum adjusted Moving Average by DGTA brand new Moving Average , calculated using Momentum, Acceleration and Probability (Psychological Effect).
Momentum adjusted Moving Average(MaMA) is an indicator that measures Price Action by taking into consideration not only Price movements but also its Momentum, Acceleration and Probability. MaMA, provides faster responses comparing to the regular Moving Average
Here is the math of the MaMA idea
Momentum measures change in price over a specified time period
momentum = source – source(length)
where,
source, indicates current bar’s price value
source(length), indicates historical price value of length bars earlier
Lets play with this formula and rewrite it by moving source(length) to other side of the equation
source = source(length) + momentum
to avoid confusion let’s call the source that we aim to predict as adjustedSource
adjustedSource = source(length) + momentum
looks nice the next value of source simply can be calculated by summing of historical value of the source value and value of the momentum. I wish it was so easy, the formula holds true only when the momentum is conserved/constant/steady but momentum move up or down with the price fluctuations (accelerating or decelerating)
Let’s add acceleration effects on our formula, where acceleration is change in momentum for a given length. Then the formula will become as (skipped proof part of acceleration effects, you may google for further details)
adjustedSource = source(length) + momentum + 1/2 * acceleration
here again the formula holds true when the acceleration is constant and once again it is not the case for trading, acceleration also changes with the price fluctuations
Then, how we can benefit from all of this, it has value yet requires additional approaches for better outcome
Let’s simulate behaviour with some predictive approach such as using probability (also known as psychological effect ), where probability is a measure for calculating the chances or the possibilities of the occurrence of a random event. As stated earlier above momentum and acceleration are changing with the price fluctuations, by using the probability approach we can add a predictive skill to determine the likelihood of momentum and acceleration changes (remember it is a predictive approach). With this approach, our equations can be expresses as follows
adjustedSource = source(length) + momentum * probability
adjustedSource = source(length) + ( momentum + 1/2 * acceleration ) * probability , with acceleration effect
Finally, we plot MaMA with the new predicted source adjustedSource, applying acceleration effect is made settable by the used from the dialog box, default value is true.
What to look for:
• Trend Identification
• Support and Resistance
• Price Crossovers
Recommended settings are applied as default settings, if you wish to change the length of the MaMA then you should also adjust length of Momentum (and/or Probability). For example for faster moving average such as 21 period it would be suggested to set momentum length to 13
Alternative usage , set moving average length to 1 and keep rest lengths with default values, it will produce a predictive price line based on momentum and probability. Experience acceleration factor by enabling and disabling it
Conclusion
MaMA provide an added level of confidence to a trading strategy and yet it is important to always be aware that it implements a predictive approach in a chaotic market use with caution just like with any indicator
Trading success is all about following your trading strategy and the indicators should fit within your trading strategy, and not to be traded upon solely
Disclaimer : The script is for informational and educational purposes only. Use of the script does not constitutes professional and/or financial advice. You alone the sole responsibility of evaluating the script output and risks associated with the use of the script. In exchange for using the script, you agree not to hold dgtrd TradingView user liable for any possible claim for damages arising from any decision you make based on use of the script
Elliott Wave Oscillator Signals by DGTElliott Wave Principle , developed by Ralph Nelson Elliott, proposes that the seemingly chaotic behaviour of the different financial markets isn’t actually chaotic. In fact the markets moves in predictable, repetitive cycles or waves and can be measured and forecast using Fibonacci numbers. These waves are a result of influence on investors from outside sources primarily the current psychology of the masses at that given time. Elliott wave predicts that the prices of the a traded currency pair will evolve in waves: five impulsive waves and three corrective waves. Impulsive waves give the main direction of the market expansion and the corrective waves are in the opposite direction (corrective wave occurrences and combination corrective wave occurrences are much higher comparing to impulsive waves)
The Elliott Wave Oscillator (EWO) helps identifying where you are in the 5-3 Elliott Waves, mainly the highest/lowest values of the oscillator might indicate a potential bullish/bearish Wave 3. Mathematically expressed, EWO is the difference between a 5-period and 35-period moving average based on the close. In this study instead 35-period, Fibonacci number 34 is implemented for the slow moving average and formula becomes ewo = ema(source, 5) - ema(source, 34)
The application of the Elliott Wave theory in real time trading gets difficult because the charts look messy. This study (EWO-S) simplifies the visualization of EWO and plots labels on probable reversals/corrections. The good part is that all plotting’s are performed on the top of the price chart including a histogram (optional and supported on higher timeframes). Additionally optional Keltner Channels Cloud added to help confirming the price actions.
What to look for:
Plotted labels can be used to follow the Elliott Wave occurrences and most importantly they can be considered as signals for possible trade setup opportunities. Elliott Wave Rules and Fibonacci Retracement/Extensions are suggested to confirm the patters provided by the EWO-S
Trading success is all about following your trading strategy and the indicators should fit within your trading strategy, and not to be traded upon solely
Disclaimer : The script is for informational and educational purposes only. Use of the script does not constitutes professional and/or financial advice. You alone the sole responsibility of evaluating the script output and risks associated with the use of the script. In exchange for using the script, you agree not to hold dgtrd TradingView user liable for any possible claim for damages arising from any decision you make based on use of the script

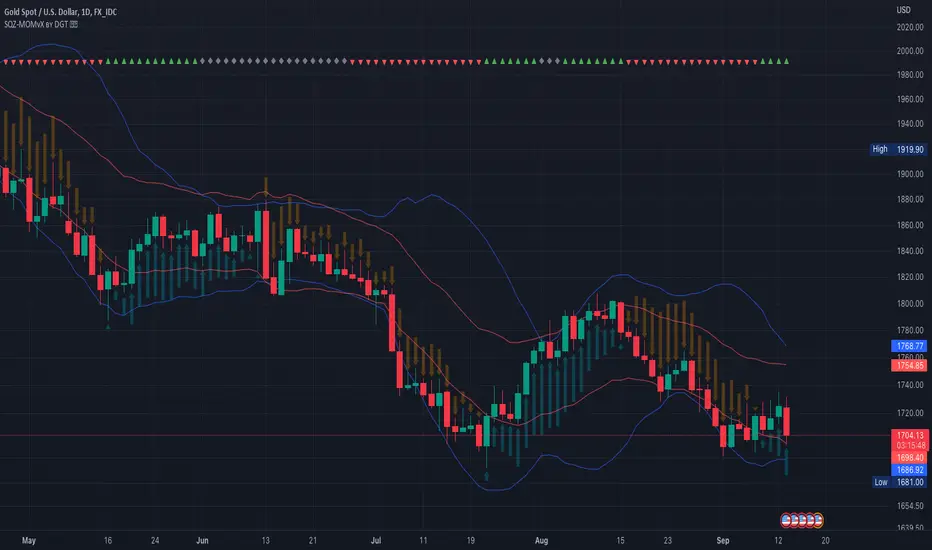
Squeeze Momentum Indicator [LazyBear] vX by DGTModified version of Squeeze Momentum Indicator visualizing on Price Chart
author: LazyBear, modified by KıvançÖZBİLGİÇ
[RS]predict player directionExperimental:
adapted from classical game movement prediction algo and how a crude recursive error classifier can be applied..

Magic 8-Ball [QuantNomad]Sometimes get tired and what to create something fun and useless )
Here I developed a magic 8-ball. You can apply it to the chart, and it randomly will show you a prediction unique for your symbol/candle time.
Please don't take this prediction seriously; there is 0 rationale behind it. However, I believe it can outperform some traders here on TradginView =)
So it will show you one of the following messages:
Buy
Strong Buy
HODL
Sell
Strong Sell
Ask again later
Better not tell you now
Neutral
Cannot predict now
Very doubtful

Running Average [EXPERIMENT]Predicting the future has nothing to do with trading, understanding your indicator and knowing how to use it does.
Probably not the most efficient code, oh well..
Let me know if it's useful :)

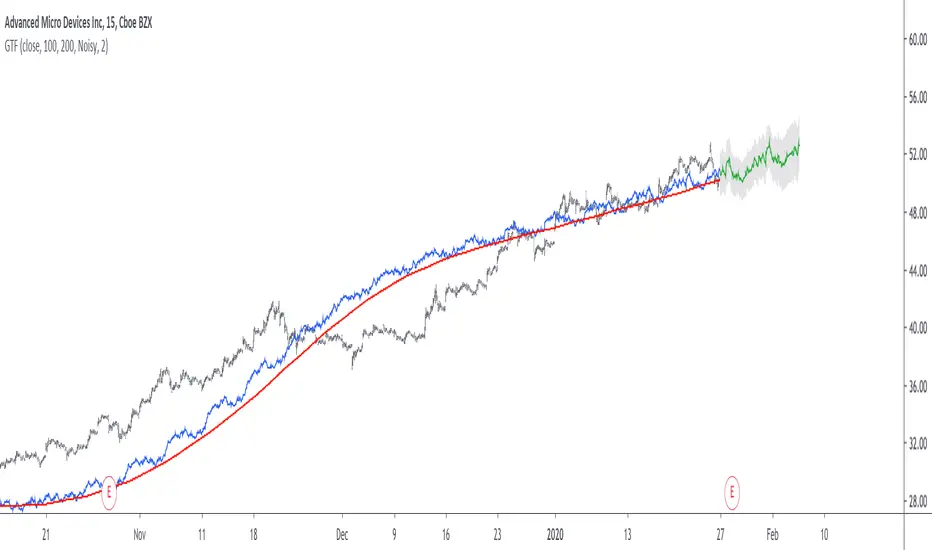
Grand Trend Forecasting - A Simple And Original Approach Today we'll link time series forecasting with signal processing in order to provide an original and funny trend forecasting method, the post share lot of information, if you just want to see how to use the indicator then go to the section "Using The Indicator".
Time series forecasting is an area dealing with the prediction of future values of a series by using a specific model, the model is the main tool that is used for forecasting, and is often an expression based on a set of predictor terms and parameters, for example the linear regression (model) is a 1st order polynomial (expression) using 2 parameters and a predictor variable ax + b . Today we won't be using the linear regression nor the LSMA.
In time series analysis we can describe the time series with a model, in the case of the closing price a simple model could be as follows :
Price = Trend + Cycles + Noise
The variables of the model are the components, such model is additive since we add the component with each others, we should be familiar with each components of the model, the trend represent a simple long term variation of high amplitude, the cycles are periodic fluctuations centered around 0 of varying period and amplitude, the noise component represent shorter term irregular variations with mean 0.
As a trader we are mostly interested by the cycles and the trend, altho the cycles are relatively more technical to trade and can constitute parasitic fluctuations (think about retracements in a trend affecting your trend indicator, causing potential false signals).
If you are curious, in signal processing combining components has a specific name, "synthesis" , here we are dealing with additive synthesis, other type of synthesis are more specific to audio processing and are relatively more complex, but could be used in technical analysis.
So what to do with our components ? If we want to trade the trend, we should estimate right ? Estimating the trend component involve removing the cycle and noise component from the price, if you have read stuff about filters you should know where i'am going, yep, we should use filters, in the case of keeping the trend we can use a simple moving average of relatively high period, and here we go.
However the lag problem, which is recurrent, come back again, we end up with information easier to interpret (here the trend, which is a simple fluctuation such as a line or other smooth curve) at the cost of decision timing, that is unfortunate but as i said the information, here the moving average output, is relatively simple, and could be easily forecasted right ? If you plot a moving average of high period it would be easier for you to forecast its future values. And thats what we aim to do today, provide an estimate of the trend that should be easy to forecast, and should fit to the price relatively well in order to produce forecast that could determine the position of future closing prices observations.
Estimating And Forecasting The Trend
The parameter of the indicator dealing with the estimation of the trend is length , with higher values of length attenuating the cycle and noise component in the price, note however that high values of length can return a really long term trend unlike a simple moving average, so a small value of length, 14 for example can still produce relatively correct estimate of trend.
here length = 14.
The rough estimate of the trend is t in the code, and is an IIR filter, that is, it is based on recursion. Now i'll pass on the filter design explanation but in short, weights are constants, with higher weights allocated to the previous length values of the filter, you can see on the code that the first part of t is similar to an exponential moving average with :
t(n) = 0.9t(n-length) + 0.1*Price
However while the EMA only use the precedent value for the recursion, here we use the precedent length value, this would just output a noisy and really slow output, therefore in order to create a better fit we add : 0.9*(t(n-length) - t(n-2length)) , and this create the rough trend estimate that you can see in blue. On the parameters, 0.9 is used since it gives the best estimate in my opinion, higher values would create more periodic output and lower values would just create a rougher output.
The blue line still contain a residual of the cycle/noise component, this is why it is smoothed with a simple moving average of period length. If you are curious, a filter estimating the trend but still containing noisy fluctuations is called "Notch" filter, such filter would depending on the cutoff remove/attenuate mid term cyclic fluctuations while preserving the trend and the noise, its the opposite of a bandpass filter.
In order to forecast values, we simply sum our trend estimate with the trend estimate change with period equal to the forecasting horizon period, this is a really really simple forecasting method, but it can produce decent results, it can also allows the forecast to start from the last point of the trend estimate.
Using The Indicator
We explained the length parameter in the precedent section, src is the input series which the trend is estimated, forecast determine the forecasting horizon, recommend values for forecast should be equal to length, length/2 or length*2, altho i strongly recommend length.
here length and forecast are both equal to 14 .
The corrective parameter affect the trend estimate, it reduce the overshoot and can led to a curve that might fit better to the price.
The indicator with the non corrective version above, and the corrective one below.
The source parameter determine the source of the forecast, when "Noisy" is selected the source is the blue line, and produce a noisy forecast, when "Smooth" is selected the source is the moving average of t , this create a smoother forecast.
The width interval control...the width of the intervals, they can be seen above and under the forecast plot, they are constructed by adding/subtracting the forecast with the forecast moving average absolute error with respect to the price. Prediction intervals are often associated with a probability (determining the probability of future values being between the interval) here we can't determine such probability with accuracy, this require (i think) an analysis of the forecasting distribution as well as assumptions on the distribution of the forecasting error.
Finally it is possible to see historical forecasts, that is, forecasts previously generated by checking the "Show Historical Forecasts" option.
Examples
Good forecasts mostly occur when the price is close to the trend estimate, this include the following highlighted periods on AMD 15TF with default settings :
We can see the same thing at the end of EURUSD :
However we can't always obtain suitable fits, here it is isn't sufficient on BTCUSD :
We can see wide intervals, we could change length or use the corrective option to get better results, another option is to use a log scale.
We will end the examples with the log SPX, who posses a linear trend, so for example a linear model such as a linear regression would be really adapted, lets see how the indicator perform :
Not a great fit, we could try to use an higher length value and use "Smooth" :
Most recent fits are quite decent.
Conclusions
A forecasting indicator has been presented in this post. The indicator use an original approach toward estimating the trend component in the closing price. Of course i should have given statistics related to the forecasting error, however such analysis is worth doing with better methods and in more advanced environment allowing for optimization.
But we have learned some stuff related to signal processing as well as time series analysis, seeing a time series as the sum of various components is really helpful when it comes to make sense of chaotic and noisy series and is a basic topic in time series analysis.
You can see that in this new year i work harder on the visual of my indicators without trying to fall in the label addict trap, something that i wasn't really doing before, let me know what do you think of it.
Thanks for reading !
Bitcoin Difficulty Model [aamonkey]This is a model to calculate Bitcoin price based on Difficulty.
How to calculate it:
BDM = (difficulty^0.51) * 0.002
For the difficulty, the daily average is used.
