Account GuardianAccount Guardian: Dynamic Risk/Reward Overlay
Introduction
Account Guardian is an open-source indicator for TradingView designed to help traders evaluate trade setups before entering positions. It automatically calculates Risk-to-Reward ratios based on market structure, displays visual Stop Loss and Take Profit zones, and provides real-time position sizing recommendations.
The indicator addresses a fundamental question every trader should ask before entering a trade: "Does this setup make mathematical sense?" Account Guardian answers this question visually and numerically, helping traders avoid impulsive entries with poor risk profiles.
Core Functionality
Account Guardian performs four primary functions:
Detects swing highs and swing lows to identify logical stop loss placement levels
Calculates Risk-to-Reward ratios for both long and short setups in real-time
Displays visual SL/TP zones on the chart for immediate trade planning
Computes position sizing based on your account size and risk tolerance
The goal is to provide traders with instant feedback on whether a potential trade meets their minimum risk/reward criteria before committing capital.
How It Works
Swing Detection
The indicator uses pivot point detection to identify recent swing highs and swing lows on the chart. These swing points serve as logical areas for stop loss placement:
For Long Trades: The most recent swing low becomes the stop loss level. Price breaking below this level would invalidate the bullish thesis.
For Short Trades: The most recent swing high becomes the stop loss level. Price breaking above this level would invalidate the bearish thesis.
The swing detection lookback period is configurable, allowing you to adjust sensitivity based on your trading timeframe and style.
It automatically adjusts the tp and sl when it is applied to your chart so it is always moving up and down!
Risk/Reward Calculation
Once swing levels are identified, the indicator calculates:
Entry Price: Current close price (where you would enter)
Stop Loss: Recent swing low (for longs) or swing high (for shorts)
Risk: Distance from entry to stop loss
Take Profit: Entry plus (Risk × Target Multiplier)
R:R Ratio: Reward divided by Risk
The R:R ratio is then evaluated against your configured thresholds to determine if the setup is valid, marginal, or poor.
Visual Elements
SL/TP Zones
When enabled, the indicator draws colored boxes on the chart showing:
Red Zone: Stop Loss area - the region between your entry and stop loss
Green/Gold/Red Zone: Take Profit area - colored based on R:R quality
The color coding provides instant visual feedback:
Green: R:R meets or exceeds your "Good R:R" threshold (default 3:1)
Gold: R:R meets minimum threshold but below "Good" (between 2:1 and 3:1)
Red: R:R below minimum threshold - setup should be avoided
Swing Point Markers
Small circles mark detected swing points on the chart:
Green circles: Swing lows (potential support / long SL levels)
Red circles: Swing highs (potential resistance / short SL levels)
Dashboard Panel
The dashboard in the top-right corner displays comprehensive trade planning information:
R:R Row: Current Risk-to-Reward ratio for long and short setups
Status Row: VALID, OK, BAD, or N/A based on R:R thresholds
Stop Loss Row: Exact price level for stop loss placement
Take Profit Row: Exact price level for take profit placement
Pos Size Row: Recommended position size based on your risk parameters
Risk $ Row: Dollar amount at risk per trade
Position Sizing Logic
The indicator calculates position size using the formula:
Position Size = Risk Amount / Risk per Unit
Where:
Risk Amount = Account Size × (Risk Percentage / 100)
Risk per Unit = Entry Price - Stop Loss Price
For example, with a $10,000 account risking 1% per trade ($100), if your entry is at 100 and stop loss at 98 (risk of 2 per unit), your position size would be 50 units.
Input Parameters
Swing Detection:
Swing Lookback: Number of bars to look back for pivot detection (default: 10). Higher values find more significant swing points but may be slower to update.
Target Multiplier: Multiplier applied to risk to calculate take profit distance (default: 2). A value of 2 means TP is 2× the distance of SL from entry.
Risk/Reward Thresholds:
Minimum R:R: Minimum acceptable Risk-to-Reward ratio (default: 2.0). Setups below this show as "BAD" in red.
Good R:R: Threshold for excellent setups (default: 3.0). Setups at or above this show as "VALID" in green.
Account Settings:
Account Size ($): Your trading account size in dollars (default: 10,000). Used for position sizing calculations.
Risk Per Trade (%): Percentage of account to risk per trade (default: 1.0%). Professional traders typically risk 0.5-2% per trade.
Display:
Show SL/TP Zones: Toggle visibility of the colored zone boxes on chart (default: enabled)
Show Dashboard: Toggle visibility of the information panel (default: enabled)
Analyze Direction: Choose to analyze Long only, Short only, or Both directions (default: Both)
How to Use This Indicator
Basic Workflow:
Add the indicator to your chart
Configure your account size and risk percentage in the settings
Set your minimum and good R:R thresholds based on your trading rules
Look at the dashboard to see current R:R for potential long and short entries
Only consider trades where the status shows "VALID" or at minimum "OK"
Use the displayed SL and TP levels for your order placement
Use the position size recommendation to determine lot/contract size
Interpreting the Dashboard:
VALID (Green): Excellent setup - R:R meets your "Good" threshold. This is the ideal scenario for taking a trade.
OK (Gold): Acceptable setup - R:R meets minimum but isn't optimal. Consider taking if other confluence factors align.
BAD (Red): Poor setup - R:R below minimum threshold. Avoid this trade or wait for better entry.
N/A (Gray): Cannot calculate - usually means no valid swing point detected yet.
Best Practices:
Use this indicator as a filter, not a signal generator. It tells you IF a trade makes sense, not WHEN to enter.
Combine with your existing entry strategy - use Account Guardian to validate setups from other analysis.
Adjust the swing lookback based on your timeframe. Lower timeframes may need smaller lookback values.
Be honest with your account size input - accurate position sizing requires accurate inputs.
Consider the target multiplier carefully. Higher multipliers mean larger potential reward but lower probability of hitting TP.
Alerts
The indicator includes four alert conditions:
Good Long Setup: Triggers when long R:R reaches or exceeds your "Good R:R" threshold
Good Short Setup: Triggers when short R:R reaches or exceeds your "Good R:R" threshold
Bad Long Setup: Triggers when long R:R falls below your minimum threshold
Bad Short Setup: Triggers when short R:R falls below your minimum threshold
These alerts can help you monitor multiple charts and get notified when favorable setups appear.
Technical Implementation
The indicator is built using Pine Script v6 and includes:
Pivot-based swing detection using ta.pivothigh() and ta.pivotlow()
Dynamic box drawing for visual SL/TP zones
Table-based dashboard for clean information display
Color-coded visual feedback system
Persistent variable tracking for swing levels
Code Structure:
// Swing Detection
float swingHi = ta.pivothigh(high, swingLen, swingLen)
float swingLo = ta.pivotlow(low, swingLen, swingLen)
// R:R Calculation for Long
float longSL = recentSwingLo
float longRisk = entry - longSL
float longTP = entry + (longRisk * targetMult)
float longRR = (longTP - entry) / longRisk
// Position Sizing
float riskAmount = accountSize * (riskPct / 100)
float posSize = riskAmount / longRisk
Limitations
The indicator uses historical swing points which may not always represent optimal SL placement for your specific strategy
Position sizing assumes you can trade fractional units - adjust accordingly for instruments with minimum lot sizes
R:R calculations assume linear price movement and don't account for gaps or slippage
The indicator doesn't predict price direction - it only evaluates the mathematical viability of a setup
Swing detection has inherent lag due to the lookback period required for pivot confirmation
Recommended Settings by Trading Style
Scalping (1-5 minute charts):
Swing Lookback: 5-8
Target Multiplier: 1-2
Minimum R:R: 1.5
Good R:R: 2.0
Day Trading (15-60 minute charts):
Swing Lookback: 8-12
Target Multiplier: 2
Minimum R:R: 2.0
Good R:R: 3.0
Swing Trading (4H-Daily charts):
Swing Lookback: 10-20
Target Multiplier: 2-3
Minimum R:R: 2.5
Good R:R: 4.0
Why Risk/Reward Matters
Many traders focus solely on win rate, but profitability depends on the combination of win rate AND risk/reward ratio. Consider these scenarios:
50% win rate with 1:1 R:R = Breakeven (before costs)
50% win rate with 2:1 R:R = Profitable
40% win rate with 3:1 R:R = Profitable
60% win rate with 1:2 R:R = Losing money
Account Guardian helps ensure you only take trades where the math works in your favor, even if you're wrong more often than you're right.
Disclaimer
This indicator is provided for educational and informational purposes only. It is not intended as financial, investment, trading, or any other type of advice or recommendation.
Trading involves substantial risk of loss and is not suitable for all investors. The calculations provided by this indicator are based on historical price data and mathematical formulas that may not accurately predict future price movements.
Position sizing recommendations are estimates based on user inputs and should be verified before placing actual trades. Always consider factors such as leverage, margin requirements, and broker-specific rules when determining actual position sizes.
The Risk-to-Reward ratios displayed are theoretical calculations based on swing point detection. Actual trade outcomes will vary based on market conditions, execution quality, and other factors not captured by this indicator.
Past performance does not guarantee future results. Users should thoroughly test any trading approach in a demo environment before risking real capital. The authors and publishers of this indicator are not responsible for any losses or damages arising from its use.
Always consult with a qualified financial advisor before making investment decisions.
Portfolio Management

Lot Size Calculator (Entry + SL) GOLDLot Size Calculator (Entry + SL)
This indicator helps traders calculate the correct position size (lots) based on risk management, using a fixed account balance and risk percentage per trade.
By providing an Entry Price and Stop-Loss Price, the script automatically computes:
Dollar risk per trade
Stop-loss distance
Risk per unit
Total position size in units
Final position size in lots (rounded to broker-compatible steps)
How It Works
Define your Account Balance.
Set your Risk % per trade (e.g., 1%).
Choose your Entry Price:
Manual input, or
Use the current market price.
Enter your Stop-Loss Price.
The indicator calculates the maximum lot size so that your loss at SL equals your predefined risk.
Key Features
Uses TradingView’s syminfo.pointvalue for accurate instrument pricing
Supports any market (Forex, indices, commodities, crypto)
Custom units per lot (FX standard, mini, micro, or custom CFD contracts)
roker-friendly lot rounding
Clean table display for quick decision-making
Ideal for traders who:
Follow strict fixed-percentage risk management
Want consistent position sizing
Trade multiple instruments with different contract sizes
This tool ensures every trade risks the same percentage of capital, regardless of stop-loss distance.

Easy DashboardREAD DISCLAIMER BELOW BEFORE USE
The ultimate TradingView dashboard for tracking up to 24 tickers in real-time. Stay on top of your P&L, Volatility (ATR), and Earnings countdown without ever leaving your chart.
Total Privacy: No hardcoded data. Input your holdings privately via the settings menu.
Risk Control: Built-in "traffic light" system for ATR % and Volume % to spot volatility and institutional activity.
Earnings Alerts: Automated countdowns that turn red when an Earnings Report is less than 7 days away.
Complete Wealth View: Live tracking of Daily P&L, Cash, and Total Net Worth.
Clean UI: Fully customizable positions, text sizes, and a "Minimal Mode" for a distraction-free workspace.
DISCLAIMER
IMPORTANT: READ BEFORE USE
This indicator is provided for educational and informational purposes only.
Not Financial Advice: The information, metrics, and calculations displayed by this script do not constitute financial, investment, or trading advice.
Not an Inducement: Nothing within this script should be construed as a recommendation or an inducement to buy, sell, or hold any financial instrument.
Accuracy & Risks: While every effort is made to ensure technical accuracy, trading involves significant risk of loss. Past performance is not indicative of future results.
User Responsibility: All data entered (Tickers, Quantities, Cash) is processed locally. The user is solely responsible for verifying the accuracy of the data and for any financial decisions made based on the output of this script.
Fictitious Data: All pre-entered values in this demo version are fictitious and intended for demonstration purposes only.

Sector Flow AnalysisSector Flow Analysis - Track market leadership and rotation across 11 major sector ETFs with real-time performance rankings.
Key Features:
Monitors all 11 S&P sector ETFs (XLK, XLF, XLI, XLU, XLV, XLP, XLY, XLB, XLRE, XLC, XLE)
Configurable lookback period (5-60 days) for performance calculation
Color-coded risk indicators: 🟢 Risk-On sectors leading (bullish), 🟠 Risk-Off sectors leading (defensive), 🟡 Neutral sectors
Display top N sectors (1-11) to declutter your chart
Fully customizable positioning, text size, and color
Clean, minimal table overlay that won't obstruct your chart
Use Cases:
Identify sector rotation patterns and market leadership changes
Gauge market sentiment (risk-on vs risk-off behavior)
Find opportunities by tracking which sectors are gaining/losing momentum
Confirm trend strength when your stock's sector is leading
Perfect companion to comprehensive market analysis tools for a complete picture of sector dynamics.


NY AM 5MNQ Prop Automation (trailing, floating, fixed)This script is an automated, rule-based trading strategy implemented using TradingView’s strategy framework. It generates entries and exits based on predefined technical and time-based conditions and manages positions using systematic risk controls.
The strategy is designed to operate intraday and limits trade frequency through internal state management. All trade decisions, including entries, exits, and position management, are handled programmatically according to objective rules defined within the script.
This strategy is provided for educational and analytical purposes only to demonstrate the use of TradingView’s strategy features, including order execution, stop management, and session handling. Users are encouraged to review, modify, and test the logic independently before using it in any trading environment.

Crypto Compass | QuantEdgeBIntroducing Crypto Compass | QuantEdgeB
Overview
Crypto Compass | QuantEdgeB is a multi-asset market regime indicator that decodes the collective momentum and sentiment of the cryptocurrency space. By computing correlation-adjusted valuation across a basket of major tokens and blending them with the chart’s own momentum pulse, it delivers a real-time “compass” of risk-on/off regimes. Plotted as dual EMAs and color-coded candles, and accompanied by a comprehensive dashboard table, Crypto Compass guides traders through broad market cycles instead of isolated price swings.
Key Features
• Correlation-Adjusted Valuation Aggregation
Computes individual valuation for the top 30 Market Cap tokens plus total-market indices; weights each by its correlation to Bitcoin, then averages.
• Large-Cap-Only Mode
Optionally restricts the basket to the top 10 by market cap for a streamlined “blue-chip” sentiment readout.
• Composite Momentum Blend
Mixes the basket average with the chart’s own valuation to capture both cross-asset and local momentum.
• Dual EMA Overlay & Candle Coloring
Plots 12- and 21-period EMAs colored by the composite valuation gradient; candles are likewise color-filled to reflect regime strength.
• Interactive Dashboard Table
Live “Crypto Compass Dashboard” shows, for each asset:
o Current value & prior bar value
o Rate of Change (direction arrow)
o Duration since last EMA crossover
o Current trend state (“Bullish” / “Bearish”)
• Regime Labels & Risk-On/Off Signal
Translates the composite valuation into four regimes—Contraction, Weak, Recovery, Strong—with a clear risk-on/off indicator banner.
How It Works
1. Data Fetch & Valuation Computation
o Retrieves price and a simple TPI (12 vs 21 EMA cross) for each symbol via request.security.
o Calculates a rolling standard deviation over a lookback (length) for each asset and the chart.
2. Correlation Weighting
o Measures each asset’s correlation to Bitcoin
o Multiplies each asset’s value by its correlation coefficient to emphasize high-beta relationships.
3. Basket Averaging
o Averages the top-N weighted value (10 if “Large Cap Only” is true, else all )
o Blends the final average with the chart’s own valuation
4. Visual & Table Overlays
o EMAs (12, 21) and candles are colored via a gradient tied to zsumad thresholds.
o A table grid at the bottom-right displays per-asset metrics and computes duration since TPI crossovers to flag trend longevity.
5. Regime Mapping
≤ –1.5 ⇒ Contraction (Risk Off)
–1.5 to 0 ⇒ Weak (Risk Off)
0 to 1.5 ⇒ Recovery (Risk On)
1.5 ⇒ Strong (Risk On)
How to Use / Who Should Use It
• Crypto Portfolio Managers seeking a holistic market-wide directional bias before allocating capital.
• Swing & Position Traders looking to confirm if cross-asset strength aligns with their primary coin.
• Systematic Strategy Developers integrating regime filters into algorithmic models.
• Risk-Conscious Allocators wanting an early warning on risk-off contractions vs. risk-on expansions.
Default Settings
• Plot EMA: On
• Value Lookback Length: 90
• BTC Correlation Length: 195
• Large Cap Only: True
Conclusion
Crypto Compass distills complex cross-asset dynamics into a single, actionable gauge. By combining correlation-weighted valuation, blended momentum, and dynamic regime mapping—visualized through color-coded EMAs, candles, and a rich dashboard—it empowers traders to navigate the broader crypto market cycle with clarity and confidence.
🔹 Disclaimer : Past performance is not indicative of future results. No trading strategy can guarantee success in financial markets.
🔹 Strategic Advice : Always backtest, optimize, and align parameters with your trading objectives and risk tolerance before live trading.

ATR Rolling Points (Auto Adjust)Used to set rolling points. Added -.5 and -1 ATR stops but each ATR can be turned off as needed.

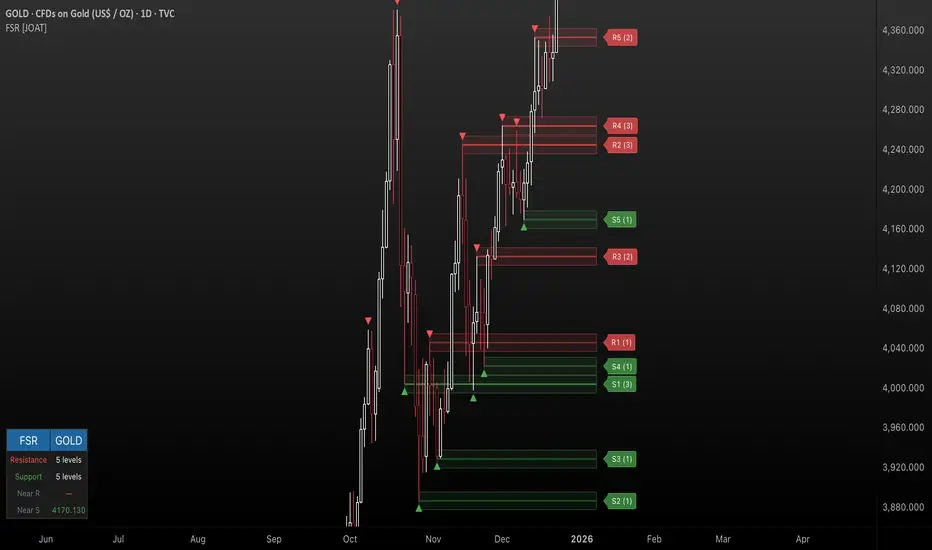
Fractal Support & Resistance [JOAT]
Fractal Support & Resistance — Automatic Level Detection with Volume Weighting
Fractal Support & Resistance automatically identifies key price levels using a proprietary combination of fractal detection, volume analysis, and dynamic touch counting. Levels are intelligently styled based on their strength and how many times they have been tested, giving you instant visual feedback on level importance.
Why This Script is Protected
This script is published as closed-source to protect the proprietary level management algorithm and the unique volume-weighted strength calculation methodology from unauthorized republishing. The specific implementation of touch detection, level merging logic, and dynamic opacity calculations represents original work that differentiates this from standard fractal indicators.
What Makes This Indicator Unique
Unlike basic fractal indicators that simply mark pivot points, this system:
Tracks how many times each level has been tested (touch counting)
Weights level importance by volume at the fractal point
Merges nearby fractals into single levels instead of cluttering the chart
Dynamically adjusts visual opacity based on level strength
Provides zone boxes around levels for realistic price reaction areas
What This Indicator Does
Detects fractal pivot highs and lows to establish support and resistance levels
Tracks how many times each level has been touched or tested
Weights level importance by volume at the fractal point
Draws extending lines and zone boxes for each level
Dynamically adjusts level opacity based on touch count for visual strength indication
Provides a dashboard with nearest levels and counts
Core Methodology
The indicator uses Williams Fractal concepts as a foundation but extends them with proprietary enhancements:
Fractal Detection — Identifies pivot highs and lows where price creates local extremes with confirmation bars on each side. A fractal high requires the highest point with lower highs on both sides; a fractal low requires the lowest point with higher lows on both sides.
Level Clustering — New fractals within a tolerance zone (based on Zone Padding %) update existing levels rather than creating duplicates. This keeps the chart clean and focuses on significant price areas.
Volume Integration — Volume at each fractal point is accumulated to weight level significance. Higher volume fractals are considered more important.
Touch Tracking — The system monitors when price approaches existing levels and increments touch counts. More touches indicate stronger, more significant levels.
Visual Strength System
Level appearance changes dynamically based on market interaction:
Newer or less-tested levels appear more transparent (up to 80% transparency)
Each additional touch reduces transparency by 15%
Heavily tested levels become more prominent and opaque (minimum 20% transparency)
Labels display level number and touch count (e.g., "R1 (3)" = Resistance 1 with 3 touches)
Zone boxes provide visual areas around each level
Color Scheme
Resistance Color — Default: #FF5252 (red) — Used for resistance levels and zones
Support Color — Default: #4CAF50 (green) — Used for support levels and zones
Zone Fill — 90% transparent version of level color
Zone Border — 70% transparent version of level color
Labels — 30% transparent background with white text
Dashboard Information
The on-chart table (bottom-left corner) displays:
Number of active resistance levels meeting minimum touch requirement
Number of active support levels meeting minimum touch requirement
Nearest resistance level above current price
Nearest support level below current price
Inputs Overview
Fractal Settings:
Fractal Period — Bars on each side for fractal confirmation (default: 2, range: 1-10)
Max Levels Per Side — Maximum resistance and support levels to track (default: 5, range: 1-20)
Zone Padding (%) — Level zone width as percentage of price (default: 0.2%, range: 0-2%)
Filtering:
Volume Weight Levels — Toggle volume-weighted level importance (default: on)
Min Touches to Show — Filter out levels with fewer touches (default: 1, range: 1-10)
Lookback Period — Historical bars to analyze for level detection (default: 200, range: 50-500)
Visual Settings:
Resistance/Support Colors — Customizable color scheme
Show Zone Boxes — Toggle filled zone areas around levels
Show Level Labels — Toggle level labels with touch counts
Show Fractal Markers — Toggle small triangles at fractal points
Show Dashboard — Toggle the information table
Line Width — Thickness of level lines (default: 2, range: 1-5)
How to Use It
For Support/Resistance Trading:
Use levels with higher touch counts as stronger support/resistance references
More opaque levels have been tested more times and are more significant
Watch for price reactions at zone boundaries, not just exact level prices
Combine with candlestick patterns at levels for entry signals
For Breakout Trading:
Watch for breakouts when price closes beyond a level
Levels with many touches that finally break often produce strong moves
Use the zone box—a close beyond the zone is more significant than just touching the level
Set alerts for resistance/support breaks
For Target Setting:
Use the nearest resistance as a profit target for long positions
Use the nearest support as a profit target for short positions
Dashboard shows these levels for quick reference
Alerts Available
FSR Resistance Break — Price closes above a resistance level
FSR Support Break — Price closes below a support level
FSR New Fractal High — Fresh fractal high detected
FSR New Fractal Low — Fresh fractal low detected
Best Practices
Increase Fractal Period for fewer but more significant levels
Use Min Touches filter to show only well-tested levels
Volume weighting helps identify institutionally significant levels
Combine with trend indicators—trade with the trend at levels
This indicator is provided for educational purposes. It does not constitute financial advice. Past performance does not guarantee future results. Always conduct your own analysis and use proper risk management before making trading decisions.
— Made with passion by officialjackofalltrades
MartinGale Average Simulator - By LowisOriginality and Utility
This script is not a traditional indicator nor a cosmetic variation of existing tools such as moving averages, oscillators, or common indicator combinations. It is a deterministic averaging and risk modeling engine, specifically designed to simulate, analyze, and validate multi-order averaging (DCA) structures under fully configurable conditions.
The originality of this script lies in the fact that it does not generate trade signals and does not attempt to predict market direction. Instead, it models the mathematical behavior of an entire chained order structure, allowing the user to quantitatively evaluate how an averaging strategy behaves as price evolves.
The script continuously computes and displays:
The dynamic average entry price after each additional order.
The progressive position size growth as orders are added.
The total capital committed, factoring in leverage.
The individual PnL per order and the aggregated PnL of the entire structure, both in absolute and percentage terms.
The real account usage percentage as the averaging sequence progresses.
The sensitivity of the structure to changes in the current or simulated price.
Unlike classic indicators that operate on historical price data to infer probabilities, this tool functions as a deterministic planning and risk-audit system. Its purpose is to help traders answer structural questions that standard indicators do not address, such as:
How much capital is actually committed by the time the Nth order is reached.
The exact resulting average price given a custom percentage distribution across orders.
The structural drawdown required before an averaging strategy becomes profitable.
How changes in leverage, number of orders, or percentage distribution affect overall risk exposure.
The script allows full user control over key parameters, including:
Number of averaging orders.
Custom percentage offsets per order.
Account capital and leverage.
Entry price and current/simulated price.
Decimal precision for price and asset quantity.
Clear visualization through tables and price-level graphics.
This makes the script a trade engineering and risk modeling tool, rather than a signal-based indicator. Its value lies in structural analysis and execution planning, a category not covered by standard open-source scripts in the public library.
The source code is intentionally kept private because the internal averaging, position-sizing, and risk-accumulation engine represents proprietary logic that can be directly reused for commercial products or automated systems. Disclosing this implementation would allow immediate replication without providing additional educational or functional value to the end user, who already has full operational control through exposed inputs.
For these reasons, the script is functionally original, technically useful, and fully justifies closed-source protection, in compliance with TradingView’s publication guidelines.
🔧 How the Indicator Works (Technical Overview)
This indicator implements a deterministic averaging (DCA) simulation engine designed to accurately model the mathematical, financial, and percentage-based behavior of a leveraged position composed of multiple sequential orders.
Unlike traditional indicators that only display static levels or visual signals, this script reconstructs the full internal structure of a position, order by order, allowing the user to analyze its complete evolution under different price scenarios.
📌 Entry Price Calculation per Order
Starting from an initial entry price, the user defines a set of percentage-based distances for each averaging order.
Each new entry price is calculated as:
A percentage deviation relative to the original entry price
Adjusted by trade direction (long or short)
Dynamically rounded according to user-defined price precision
As a result, each order has an independent, deterministic, and reproducible price, without relying on external data or real trade execution.
📌 Position Size and Capital Usage Calculation
For every order, the engine computes:
Asset quantity acquired based on allocated capital and leverage
Actual margin used considering leverage
Progressive accumulation of total deployed capital
Account capital usage percentage per order and in total
This allows the trader to clearly visualize how real account exposure grows as additional averaging orders are added — something that is not evident in standard DCA tools.
📌 Average Entry Price Recalculation
After each new order, the indicator recalculates the weighted average entry price of the entire position by combining:
The previous average price
The new entry price
The updated total asset quantity
This accurately reflects how the real break-even level evolves as the position is averaged, which is critical for aggressive averaging or martingale-style strategies.
📌 Individual and Cumulative PnL Computation
The script supports two evaluation modes:
Current market price
User-defined simulated price, intended for hypothetical or stress-test scenarios
Using the selected price, the indicator calculates:
Individual PnL per order
Total cumulative PnL of the position
PnL percentage relative to the capital used in each order
PnL percentage relative to total deployed capital
Each order maintains its own mathematical identity, avoiding common errors where PnL is diluted or calculated solely against the averaged price.
📌 Structured and Objective Visualization
All calculations are represented through:
Independent horizontal price lines per order
Informational labels anchored to their corresponding price levels
Tabular summaries displaying the exact state of each order, row by row
No classical indicators, predictive signals, or discretionary filters are used.
The system is 100% mathematical, deterministic, and reproducible.
📌 Purpose and Practical Utility
This indicator is designed to:
Evaluate the mathematical viability of averaging schemes
Analyze real leverage-based risk exposure
Compare price scenarios before execution
Understand how small price movements affect large accumulated positions
Identify points where capital usage becomes inefficient or dangerous
It does not execute trades and does not generate trading signals.
Its purpose is structural position analysis, not prediction.
🧭 How to Use the Indicator (Step-by-Step Guide)
This indicator does not require prior trading experience to be used.
It operates entirely through configurable parameters and updates automatically in real time.
1️⃣ Define the Initial Entry Parameters
Start by setting the initial entry price.
This value represents the price at which the first position entry is opened.
Next, define:
Account capital: the total available capital
Entry percentage: the percentage of the account used in the first order
The indicator automatically calculates:
Capital invested
Asset quantity acquired
Real position exposure
2️⃣ Select the Position Direction
Choose whether the position is:
Long (benefits from price increases), or
Short (benefits from price decreases)
This selection automatically adjusts:
Price movement direction
PnL calculations
Averaging percentage behavior
No additional configuration is required.
3️⃣ Configure Leverage and Number of Orders
Set the leverage used for the position.
This value is applied to calculate:
Required margin per order
Total exposure relative to account capital
Then, specify the number of averaging orders.
Each order represents an additional entry that would be placed if price moves against the position.
4️⃣ Define Averaging Percentages
Enter the percentage offsets for each averaging order, separated by commas.
Example:
4, 8, 13, 19, 39, 54
Each value represents how far (in percentage terms) price must move from the original entry before adding a new order.
The indicator automatically calculates:
Exact price level of each order
Updated average entry price
Capital deployed per order
Total capital usage
5️⃣ (Optional) Set a Simulated Price
Optionally, a simulated price can be defined.
This allows users to:
Evaluate hypothetical market scenarios
Analyze deep drawdowns
Simulate price recoveries
Study PnL behavior without waiting for live market movement
Any change to this value instantly recalculates all results.
6️⃣ Interpreting the Results
Once configured, the indicator displays in real time:
Individual order prices
Updated average entry price
Capital invested per order and in total
Individual and cumulative PnL
PnL percentage relative to deployed capital
No buttons or manual refresh are required.
Any parameter change updates the entire simulation automatically.
🎯 Important Notes
The indicator does not execute trades
No buy or sell signals are generated
All calculations are purely mathematical and deterministic
Its purpose is to visualize, analyze, and understand how a multi-entry averaging position behaves under different market conditions.
🔒 Closed-Source Justification
This script is published as closed-source because it implements a custom multi-order position simulation engine that goes beyond standard indicator calculations.
Internally, the script relies on a structured calculation framework that manages:
Order-to-order dependency
Cumulative capital usage across multiple entries
Dynamic average price recalculation
Individual and aggregated PnL modeling
State-aware recalculation logic tied to user-defined parameters
The value of the script resides not in isolated formulas, but in the overall architecture and calculation flow that coordinates these elements into a coherent position analysis model.
Exposing the full source code would effectively reveal the complete framework, making the script trivial to replicate and removing its practical uniqueness.
Despite being closed-source, the script provides full transparency at the output level, allowing users to verify all calculated values directly on the chart through tables, labels, and price-level visualizations.
For this reason, the script is shared as a closed-source publication while still offering complete analytical clarity and educational value to the end user.
⚠️ Disclaimer
This indicator does not provide trade signals, nor does it place or manage real orders.
It is intended strictly for educational, analytical, and risk evaluation purposes.

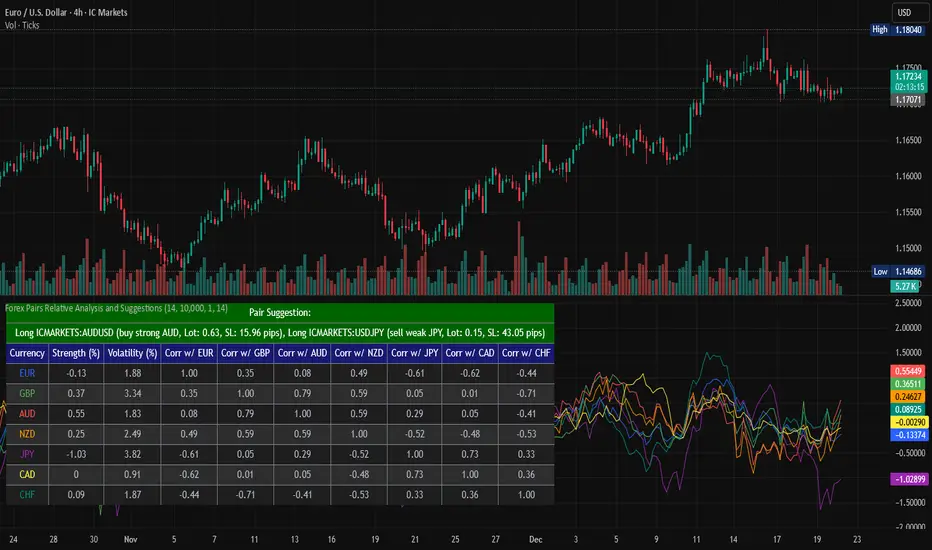
Forex Pairs Relative Analysis and SuggestionsThis Pine Script (version 5) indicator, titled "Forex Pairs Relative Analysis and Suggestions," is designed for use on TradingView charts. It provides real-time analysis of major forex pairs sourced from the IC Markets exchange, facilitating relative value or pair trading strategies by evaluating currency strengths against the US Dollar (USD). The script focuses on seven major currencies—EUR, GBP, AUD, NZD, JPY, CAD, and CHF—through their respective pairs: EURUSD, GBPUSD, AUDUSD, NZDUSD, USDJPY, USDCAD, and USDCHF.
Key features include:
Relative Currency Strengths: Calculated using the Rate of Change (ROC) over a user-defined lookback period (default: 14 bars), normalized to reflect performance versus USD. Positive values indicate strengthening, while negative values denote weakening.
Annualized Volatilities: Derived from the standard deviation of logarithmic returns, annualized assuming 252 trading days, and expressed as percentages to compare risk levels across pairs.
Full Pairwise Correlations: A comprehensive matrix displaying Pearson correlation coefficients between all pairs over the lookback period, aiding in identifying hedging opportunities (e.g., low or negative correlations for diversification).
Automated Pair Suggestions: Identifies the strongest and weakest currencies, proposing a long position in the pair to buy the strong currency and a short position (or opposite direction) to sell the weak currency against USD. Suggestions include estimated lot sizes based on user-input account balance, risk percentage (default: 1%), and a stop-loss proxy using 1x Average True Range (ATR).
Visual Elements: A table displays all metrics with color-coded rows for readability (optimized for dark mode), alternating backgrounds, and merged cells for suggestions. Strengths are also plotted in a separate pane with matching colors for trend visualization.
Customization: Users can adjust the lookback length, ATR period, account balance, and risk percentage via indicator settings to tailor the analysis.
Ensure access to IC Markets data in your TradingView account. The table appears in the top-left position by default and updates on the last bar. This tool is intended for educational and analytical purposes, supporting informed decision-making in forex trading by highlighting relative strengths, risks, and potential hedges.
Guidance on Choosing a Timeframe:
The indicator adapts to the chart's timeframe, with the lookback period influencing the historical window for metrics. Select based on your strategy:
Short-Term (Intraday/Scalping): Use 15-minute to 1-hour charts for timely signals; adjust lookback to 5–10 for responsiveness.
Medium-Term (Swing Trading): Opt for 4-hour to daily charts (recommended default) for balanced trends; 14-bar lookback covers days to weeks.
Long-Term (Position Trading): Choose weekly or monthly charts for macro views; increase lookback to 20–50 for smoother data.
Test across timeframes via backtesting to align with your risk and objectives.
Disclaimer:
This script is provided for informational and educational purposes only and does not constitute financial, investment, or trading advice. Trading forex involves significant risk of loss and is not suitable for all individuals. Past performance is not indicative of future results. The calculations, suggestions, and metrics (including lot sizes) are based on historical data and simplified assumptions, such as using ATR for stop-loss estimation, and may not account for real-time market conditions, slippage, commissions, or other factors. Users should conduct their own research, consult with qualified financial professionals, and verify the script's outputs before making any trading decisions. The author assumes no responsibility or liability for any losses incurred from the use of this script.
DCA Destroyer[Sahebson]Smart DCA Signal Calculator with Dynamic Position Sizing: (Designed for SPY or QQQ)
Transform your dollar-cost averaging strategy with intelligent position sizing.
This indicator identifies market exhaustion points where price reversals are likely, then calculates optimal position sizes based on the severity of the correction. Instead of buying fixed amounts on fixed dates, it deploys capital strategically when assets show oversold conditions, automatically scaling investment amounts from small positions on minor dips to aggressive positions during major corrections.
Core Features:
Exhaustion Detection: Identifies reversal points using swing analysis and momentum indicators
Dynamic Position Sizing: 8-tier multiplier system (0.1x to 25x base amount) based on drawdown depth
Real-Time Comparison: Side-by-side performance tracking vs traditional DCA
Adaptive Scaling: Exponential curve matches market volatility patterns
Risk Management: Tracks average cost, share accumulation, and ROI metrics
Visual Signals: Color-coded buy arrows with multiplier and amount labels
How It Works:
Monitors price for exhaustion patterns (sustained selling pressure followed by reversal)
Measures current drawdown from recent highs
Calculates position multiplier based on correction severity
Displays buy signal with recommended purchase amount
Tracks cumulative performance vs baseline DCA strategy
Use Cases:
Systematic accumulation of long-term positions
Optimizing entry timing for core holdings
Capital-efficient portfolio building
Crash buying with predetermined rules
Emotion-free position sizing
Ideal For:
Long-term investors building positions
Traders seeking systematic dip-buying rules
Portfolio managers optimizing capital deployment
Anyone practicing dollar-cost averaging who wants better results
Customizable Parameters:
Adjust exhaustion sensitivity (swing length, bar count)
Configure multiplier tiers for your risk tolerance
Set lookback period for drawdown measurement
Define base position size and DCA comparison amount
Performance Metrics:
Real-time ROI comparison (strategy vs DCA)
Share accumulation efficiency
Average cost basis tracking
Signal quality analytics
Tier distribution analysis

The Cantillon Institutional overlay (pro)🏛 Stop Trading the "Rearview Mirror." Start Tracking the Flow.
Most retail indicators (RSI, MACD, Moving Averages) suffer from a fatal flaw: they are derivatives of past price. They tell you what has already happened.
The Cantillon Institutional Overlay is different. It is designed to track the "First Receivers" of liquidity—the institutions, banks, and market makers who move the market—rather than the retail crowd chasing it.
Based on the economic principles of Richard Cantillon (18th Century), this tool visualizes the "Unfair Advantage" of the insider. It answers two critical questions:
Where is the true trend? (The Institutional Average)
Where is the trap? (The Statistical Extremes)
🛠 What is Inside?
This script combines three institutional data points into a single, clean overlay:
1. The Institutional Anchor (Cyan AVWAP) This is not a standard Moving Average. It is an Anchored Volume Weighted Average Price, typically anchored to the session or week open.
Logic: This represents the average entry price of the "First Receivers."
Signal: If Price > AVWAP, institutions are net long (Markup Phase). If Price < AVWAP, institutions are net short (Markdown Phase).
2. The Sigma Bands (Statistical Traps) Standard Deviation channels that adapt to volatility.
The Red Band (+2σ): The "Statistical Ceiling." When price hits this, it is mathematically over-extended. This is where institutions often offload positions into retail FOMO (The Trap).
The Green Band (-2σ): The "Statistical Floor." This is the buy zone for mean reversion.
3. Institutional Order Blocks Automatically highlights hidden zones of liquidity where resting orders are likely waiting. These act as "magnets" for price action.
🎯 How to Trade This
Strategy A: The Trend Follower
Rule: Only take Longs when price is above the Cyan AVWAP line.
Trigger: Wait for price to pull back to the Gray "Fair Value" zone and reject.
Strategy B: The Reversion Trader (The Fade)
Rule: Fade the extremes.
Trigger: If price hits the Red Sigma Band (+2σ) and volume dries up, the move is exhausted. We look for shorts back to the mean.
⚠️ Why "First Receivers"?
In the Cantillon Effect, money flows to the insiders first. By the time it trickles down to retail indicators, the move is often over. This overlay allows you to align your bias with the "House" rather than the "Gambler."
Recommended Setup: For the complete institutional view, pair this Overlay with The Cantillon CVD to confirm volume intent behind every move.
Disclaimer: This tool provides statistical analysis and does not guarantee profits. Past performance is not indicative of future results.

Cantillon Risk Calculator [Free]Overview Stop guessing your position size. The Cantillon Risk Calculator is a lightweight utility that instantly tells you exactly how many units (Contracts/Coins) to buy based on your account size and risk percentage.
How to Use
Open Settings.
Enter your Account Size (e.g., $10,000) and Risk % (e.g., 1%).
Type in your Stop Loss price.
The table instantly shows your Position Size.
Looking for High Probability Setups? Risk management is only half the battle. To find where to enter using Institutional Order Blocks and Sigma Bands, you need the Cantillon Terminal .

My Price Curtain by @magasineMy Price Curtain by @magasine
Functional Description
My Price Curtain is a high-performance visual analysis tool designed to provide traders with immediate context regarding price positioning relative to institutional benchmarks. Unlike standard moving averages, this indicator creates a "curtain" of data that dynamically colors the chart background and provides real-time performance metrics to identify trend dominance at a glance.
Key Features & Differential Value
Multi-Method Dynamic Benchmarking: Choose between five different calculation methods: SMA, EMA, WMA, RMA, or a manual Fixed Price. This allows you to switch from a standard technical trend (MA) to a "break-even" or "entry point" analysis (Fixed Price) instantly.
Intelligent Visual Feedback: The "Curtain" logic automatically colors the chart background—Green for Bullish dominance and Red for Bearish dominance—reducing cognitive load during fast-paced sessions.
Advanced Statistical Tracking: The indicator includes a built-in Performance Table that tracks the percentage of bars closing above or below the selected benchmark. This helps traders quantify the strength of a trend over the entire visible dataset.
Precision Labeling & Distance Analysis: A dynamic, color-coded label tracks the price on the Y-axis. It calculates and displays the exact percentage distance from the price to the benchmark in real-time, helping to identify overextended moves.
Optional Deviation Zones: Enable visual "Safety Zones" (boxes) that project a user-defined percentage deviation from the average, assisting in identifying potential volatility expansion or exhaustion areas.
Trading Utilities
Trend Confirmation: Use the background color and "Bars Above" percentage to confirm if you are trading with the path of least resistance.
Scalping & Intraday Support: The "Distance" metric is essential for scalpers to avoid entering trades too far from the average (mean reversion risk).
Custom Strategy Benchmark: Use the "Fixed Price" mode to set your specific entry price and see your real-time performance and "curtain" status relative to your position.

Futures Tick DashboardThis is a simple dashboard that shows the novice future trade the necessary info about the info about the Micro on mini futures contract they are thinking about trading

ATR Risk EngineATR Risk Engine is a precision trade-management indicator designed to standardize risk using Average True Range (ATR) rather than arbitrary price levels.
It defines stop-loss and take-profit levels based on current market volatility, allowing traders to maintain consistent risk behavior across different symbols, timeframes, and market conditions.
This is not a signal indicator.
It is a risk framework built to integrate seamlessly with existing strategies.
Key Features
ATR-based Stop Loss and Take Profit levels
Risk based position sizing using account size, risk per trade, and stop distance
Customizable ATR multipliers
Long / Short trade mode toggle
Risk distance displayed in:
- Dollar value
- Percentage
- Price distance
- Clean on-chart visualization with status-line readouts
Fully protected, invite-only script
Why Use ATR-Based Risk?
Fixed-price stops ignore volatility.
ATR Risk Engine dynamically adjusts risk to current market conditions, helping traders avoid stops that are too tight in high volatility or too loose in low volatility.
The result is proportional, repeatable risk management, regardless of the instrument traded.
Intended Use
Trade planning and execution
Risk normalization across markets
Consistent stop and target placement
Works with discretionary or systematic strategies
Who This Is For
✔ Traders who already have defined entries
✔ Traders focused on process and discipline
✔ Active day traders and swing traders
✖ Not a buy/sell signal
✖ Not a standalone strategy
✖ Not designed for automated “set and forget” trading
Disclaimer
This indicator is provided for educational and informational purposes only.
It does not constitute financial advice and does not guarantee performance.
Trading involves risk.
Display Examples
Stop Loss / Take Profit price levels with position size (status line)
Risk distance shown in dollar terms ($)
Risk distance shown as percentage (%)

JayJay🔹 Indicator Description
This indicator provides a visual way to track trade performance in both percentage (%) and price levels. It automatically plots percentage-based zones around an entry price, allowing you to monitor the progress of an active position in real time.
The default starting value is 100.00, which dynamically updates once the user defines their average cost.
To change your entry / average price:
👉 double-click the displayed value, or
👉 open the indicator Settings menu.
-This tool is ideal for:
-accurately tracking profit/loss progress
-visualizing target and risk zones
-comparing price movement to your average cost
-improving trade management and follow-through

Hybrid Drift Allocation EngineThis script works like an automated personal allocation engine for long term non expiring investments. This will allow recurring deposits to be allocated with hybrid weighting that allocates according to user inputs , it will self adjust to keep even weight. it will also not cut allocation to overperformers to bring underperformers into correction (it wont water the weeds while starving the runners). it is set and forget with minimal input after setup with almost complete automation 95% automated.
Luis-Enrico Future to CFD Price CalculatorThis tool converts a futures price into the corresponding CFD price, including entry, stop loss, and optionally take profit levels.
It provides a simple way to align trade levels between futures and CFDs.
Custom CFD Selection
The CFD instrument can be custom-selected from brokers available on TradingView, allowing the calculation to reflect the user’s specific CFD feed.
Intended Use
Designed for quick trade level conversion between futures and CFDs, supporting discretionary analysis and planning.

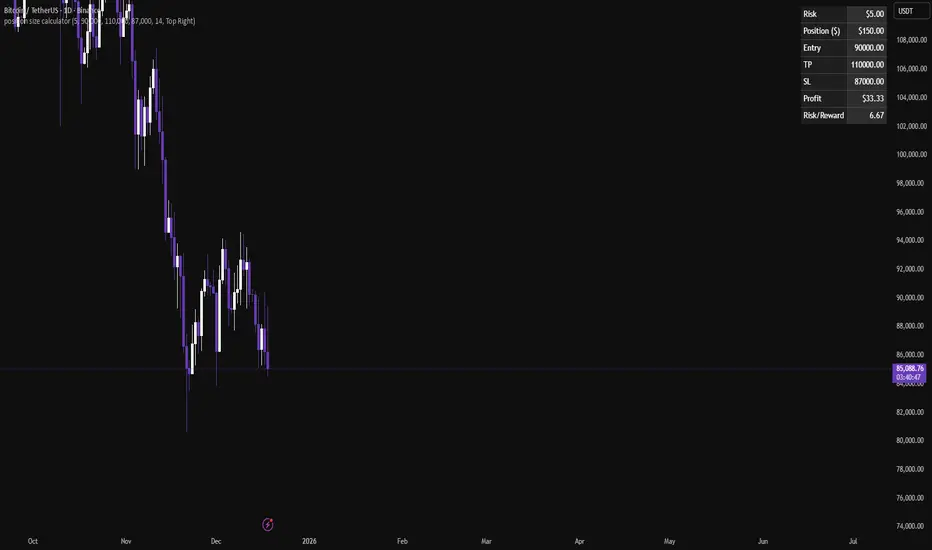
Position size calculatorA clean position size calculator designed specifically for leverage traders.
It calculates your position size, potential profit, and risk-to-reward ratio (R/R) based on fixed dollar risk.
Simply enter your entry price, stop-loss, take-profit, and risk in USD to receive precise results.
The position size is currently calculated using the following risk-based formula:
Position Size = Risk ($) / Stop-Loss distance.
This approach keeps risk constant regardless of leverage.
All colors are fully customizable to seamlessly fit your chart theme.
If you have ideas for additional calculation models or if you find any issues, leave a comment and help improve the tool.