Quantile-Based Adaptive Detection🙏🏻 Dedicated to John Tukey. He invented the boxplot, and I finalized it.
QBAD (Quantile-Based Adaptive Detection) is ‘the’ adaptive (also optionally weighted = ready for timeseries) boxplot with more senseful fences. Instead of hardcoded multipliers for outer fences, I base em on a set of quantile-based asymmetry metrics (you can view it as an ‘algorithmic’ counter part of central & standardized moments). So outer bands are Not hardcoded, not optimized, not cross-validated etc, simply calculated at O(nlogn).
You can use it literally everywhere in any context with any continuous data, in any task that requires statistical control, novelty || outlier detection, without worrying and doubting the sense in arbitrary chosen thresholds. Obviously, given the robust nature of quantiles, it would fit best the cases where data has problems.
The thresholds are:
Basis: the model of the data (median in our case);
Deviations: represent typical spread around basis, together form “value” in general sense;
Extensions: estimate data’s extremums via combination of quantile-based asymmetry metrics without relying on actual blunt min and max, together form “range” / ”frame”. Datapoints outside the frame/range are novelties or outliers;
Limits: based also on quantile asymmetry metrics, estimate the bounds within which values can ‘ever’ emerge given the current data generating process stays the same, together form “field”. Datapoints outside the field are very rare, happen when a significant change/structural break happens in current data-generating process, or when a corrupt datapoint emerges.
…
The first part of the post is for locals xd, the second is for the wanderers/wizards/creators/:
First part:
In terms of markets, mostly u gotta worry about dem instruments that represent crypto & FX assets: it’s either activity hence data sources there are decentralized, or data is fishy.
For a higher algocomplexity cost O(nlong), unlike MBAD that is 0(n), this thing (a control system in fact) works better with ishy data (contaminated with wrong values, incomplete, missing values etc). Read about the “ breakdown point of an estimator ” if you wanna understand it.
Even with good data, in cases when you have multiple instruments that represent the same asset, e.g. CL and BRN futures, and for some reason you wanna skip constructing a proper index of em (while you should), QBAD should be better put on each instrument individually.
Another reason to use this algo-based rather than math-based tool, might be in cases when data quality is all good, but the actual causal processes that generate the data are a bit inconsistent and/or possess ‘increased’ activity in a way. SO in high volatility periods, this tool should provide better.
In terms of built-ins you got 2 weightings: by sequence and by inferred volume delta. The former should be ‘On’ all the time when you work with timeseries, unless for a reason you want to consciously turn it off for a reason. The latter, you gotta keep it ‘On’ unless you apply the tool on another dataset that ain’t got that particular additional dimension.
Ain’t matter the way you gonna use it, moving windows, cumulative windows with or without anchors, that’s your freedom of will, but some stuff stays the same:
Basis and deviations are “value” levels. From process control perspective, if you pls, it makes sense to Not only fade or push based on these levels, but to also do nothing when things are ambiguous and/or don’t require your intervention
Extensions and limits are extreme levels. Here you either push or fade, doing nothing is not an option, these are decisive points in all the meanings
Another important thing, lately I started to see one kind of trend here on tradingview as well and in general in near quant sources, of applying averages, percentiles etc ‘on’ other stationary metrics, so called “indicators”. And I mean not for diagnostic or development reasons, for decision making xd
This is not the evil crime ofc, but hillbilly af, cuz the metrics are stationary it means that you can model em, fit a distribution, like do smth sharper. Worst case you have Bayesian statistics armed with high density intervals and equal tail intervals, and even some others. All this stuff is not hard to do, if u aint’t doing it, it’s on you.
So what I’m saying is it makes sense to apply QBAD on returns ‘of your strategy’, on volume delta, but Not on other metrics that already do calculations over their own moving windows.
...
Second part:
Looks like some finna start to have lil suspicions, that ‘maybe’ after all math entities in reality are more like blueprints, while actual representations are physical/mechanical/algorithmic. Std & centralized moments is a math entity that represents location, scale & asymmetry info, and we can use it no problem, when things are legit and consistent especially. Real world stuff tho sometimes deviates from that ideal, so we need smth more handy and real. Add to the mix the algo counter part of means: quantiles.
Unlike the legacy quantile-based asymmetry metrics from the previous century (check quantile skewness & kurtosis), I don’t use arbitrary sets of quantiles, instead we get a binary pattern that is totally geometric & natural (check the code if interested, I made it very damn explicit). In spirit with math based central & standardized moments, each consequent pair is wider empathizing tail info more and more for each higher order metric.
Unlike the classic box plot, where inner thresholds are quartiles and the rest are based on em, here the basis is median (minimises L1), I base inner thresholds on it, and we continue the pattern by basing the further set of levels on the previous set. So unlike the classic box plot, here we have coherency in construction, symmetry.
Another thing to pay attention to, tho for some reason ain’t many talk about it, it’s not conceptually right to think that “you got data and you apply std moments on it”. No, you apply it to ‘centered around smth’ data. That ‘smth’ should minimize L2 error in case of math, L1 error in case of algo, and L0 error in case of learning/MLish/optimizational/whatever-you-cal-it stuff. So in the case of L0, that’s actually the ‘mode’ of KDE, but that’s for another time. Anyways, in case of L2 it’s mean, so we center data around mean, and apply std moments on residuals. That’s the precise way of framing it. If you understand this, suddenly very interesting details like 0th and 1st central moments start to make sense. In case of quantiles, we center data around the median, and do further processing on residuals, same.
Oth moment (I call it init) is always 1, tho it’s interesting to extrapolate backwards the sequence for higher order moments construction, to understand how we actually end up with this zero.
1st moment (I call it bias) of residuals would be zero if you match centering and residuals analysis methods. But for some reason you didn’t do that (e.g centered data around midhinge or mean and applied QBAD on the centered data), you have to account for that bias.
Realizing stuff > understanding stuff
Learning 2981234 human invented fields < realizing the same unified principles how the Universe works
∞
Plot

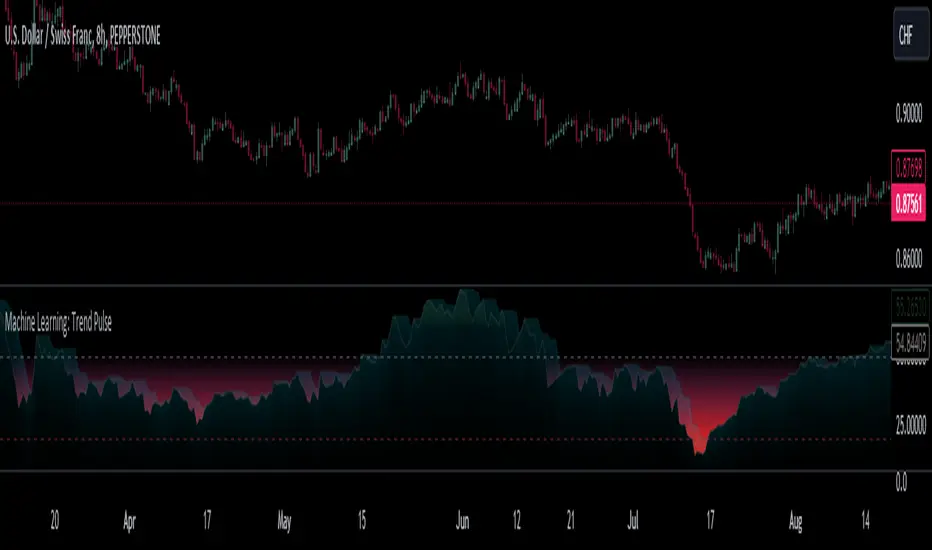
Machine Learning: Trend Pulse⚠️❗ Important Limitations: Due to the way this script is designed, it operates specifically under certain conditions:
Stocks & Forex : Only compatible with timeframes of 8 hours and above ⏰
Crypto : Only works with timeframes starting from 4 hours and higher ⏰
❗Please note that the script will not work on lower timeframes.❗
Feature Extraction : It begins by identifying a window of past price changes. Think of this as capturing the "mood" of the market over a certain period.
Distance Calculation : For each historical data point, it computes a distance to the current window. This distance measures how similar past and present market conditions are. The smaller the distance, the more similar they are.
Neighbor Selection : From these, it selects 'k' closest neighbors. The variable 'k' is a user-defined parameter indicating how many of the closest historical points to consider.
Price Estimation : It then takes the average price of these 'k' neighbors to generate a forecast for the next stock price.
Z-Score Scaling: Lastly, this forecast is normalized using the Z-score to make it more robust and comparable over time.
Inputs:
histCap (Historical Cap) : histCap limits the number of past bars the script will consider. Think of it as setting the "memory" of model—how far back in time it should look.
sampleSpeed (Sampling Rate) : sampleSpeed is like a time-saving shortcut, allowing the script to skip bars and only sample data points at certain intervals. This makes the process faster but could potentially miss some nuances in the data.
winSpan (Window Size) : This is the size of the "snapshot" of market data the script will look at each time. The window size sets how many bars the algorithm will include when it's measuring how "similar" the current market conditions are to past conditions.
All these variables help to simplify and streamline the k-NN model, making it workable within limitations. You could see them as tuning knobs, letting you balance between computational efficiency and predictive accuracy.
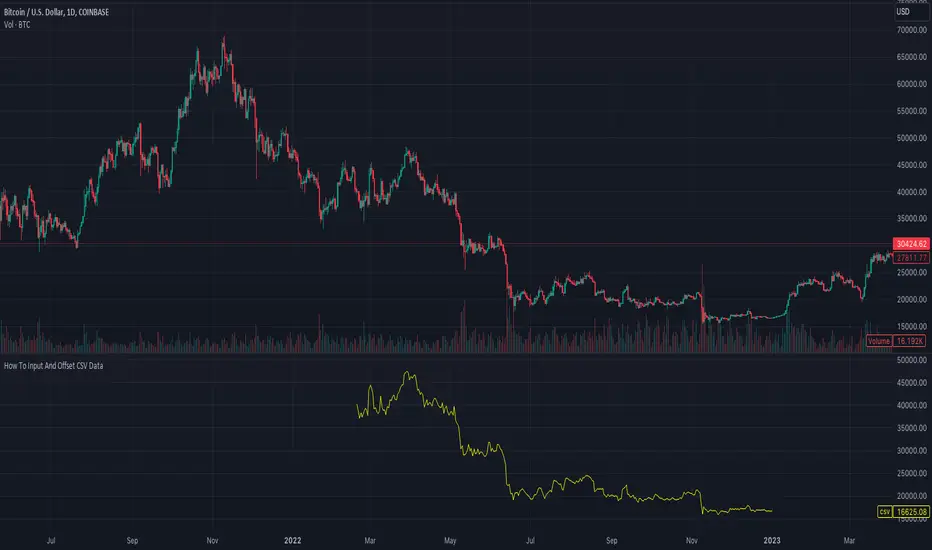
How To Input And Offset CSV DataExample method of how to use an input text area to import, offset, and plot CSV data using an array. Note that when using this method there is a limit of 4096 total characters per input.
For working with data sets larger than 4096 total characters an alternative method of pasting CSV data directly within the script can be seen below :
NOTICE: This is an example script and not meant to be used as an actual strategy. By using this script or any portion thereof, you acknowledge that you have read and understood that this is for research purposes only and I am not responsible for any financial losses you may incur by using this script!
Forex RadarForex Radar Indicator: A Powerful Tool for Analyzing Currency Strength and Weakness
Introduction
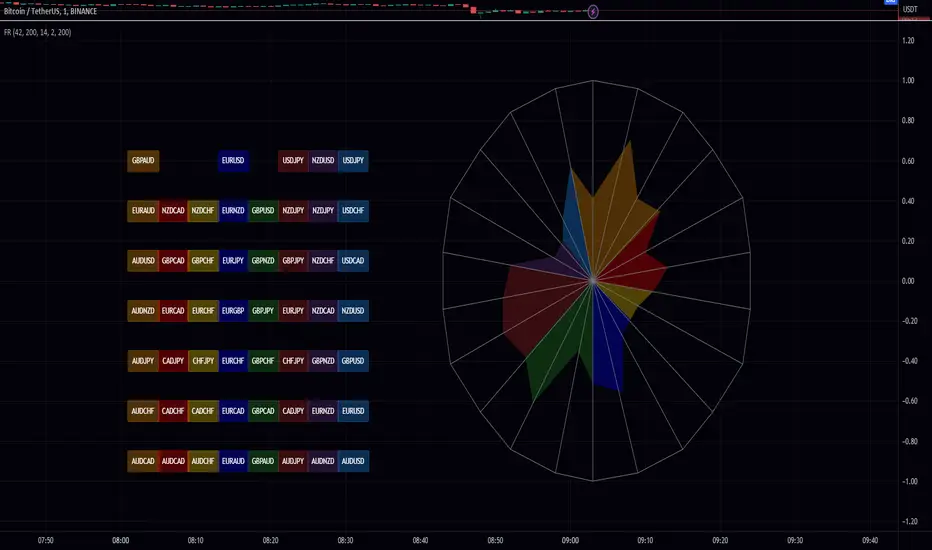
The Forex Radar Indicator is an innovative tool that provides a visual representation of the relative strength and weakness of various currencies in the Forex market. This indicator is designed to help traders identify potential trading opportunities by analyzing the performance of different currency pairs. In this blog post, we will explore the features and benefits of the Forex Radar Indicator, and explain how to use it effectively in your trading strategy.
Features of the Forex Radar Indicator
1. Spider Plot Visualization
The Forex Radar Indicator uses a spider plot to display the relative strength and weakness of various currencies. A spider plot is a graphical representation of multivariate data, in which each variable is plotted on a separate axis that radiates from the center of the plot. The data points are connected by lines, forming a web-like pattern that makes it easy to compare the performance of different currencies.
2. Customizable Color Scheme
The Forex Radar Indicator allows users to customize the color scheme for each currency, making it easy to identify individual currencies on the spider plot. This feature can be particularly helpful for traders who prefer specific colors for each currency, or who want to use a color scheme that matches their trading platform or charting tools.
3. EMA Divergence and RSI Style Selection
The Forex Radar Indicator offers users the flexibility to choose between two different styles: EMA divergence and RSI. The EMA divergence style displays the difference between a short-term and long-term exponential moving average, while the RSI style shows the relative strength index of the currency pairs. By selecting the preferred style, traders can customize the indicator to suit their specific trading style and strategy.
4. Flexible Input Parameters
The Forex Radar Indicator offers flexible input parameters, allowing users to customize the indicator according to their trading preferences. These parameters include the length of the moving average, the filter value for the moving average, and the normalization length. By adjusting these parameters, traders can fine-tune the indicator to suit their specific trading style and strategy.
Using the Forex Radar Indicator in Your Trading Strategy
The Forex Radar Indicator can be a valuable tool in any trading strategy, as it provides a visual representation of the currency strength and weakness. Here are some tips on how to use the Forex Radar Indicator effectively in your trading:
1. Identify Currency Strength and Weakness
The main purpose of the Forex Radar Indicator is to help traders identify the strength and weakness of various currencies. By analyzing the spider plot, traders can quickly determine which currencies are performing well and which are underperforming. This information can be used to identify potential trading opportunities, as traders can focus on currency pairs that feature a strong currency against a weak one.
2. Choose Between EMA Divergence and RSI Style
Depending on your trading style and strategy, you can choose between the EMA divergence and RSI style options provided by the Forex Radar Indicator. Both styles offer valuable insights into currency strength and weakness, but they may highlight different aspects of the market. By selecting the style that best aligns with your trading approach, you can maximize the effectiveness of the indicator in your trading strategy.
3. Combine with Other Technical Analysis Tools
While the Forex Radar Indicator provides valuable insights into currency strength and weakness, it is important to remember that no single indicator can provide a complete picture of the market. To improve the accuracy and effectiveness of your trading strategy, consider combining the Forex Radar Indicator with other technical analysis tools, such as trend lines, support and resistance levels, and other indicators.
Conclusion
The Forex Radar Indicator is a powerful tool that can help traders gain a better understanding of the relative strength and weakness of various currencies in the Forex market. By incorporating the Forex Radar Indicator into your trading strategy, you can quickly identify potential trading opportunities and make more informed trading decisions. With its customizable color scheme, EMA divergence and RSI style options, and flexible input parameters, the Forex Radar Indicator is a versatile tool that can be adapted to suit any trading style or strategy.
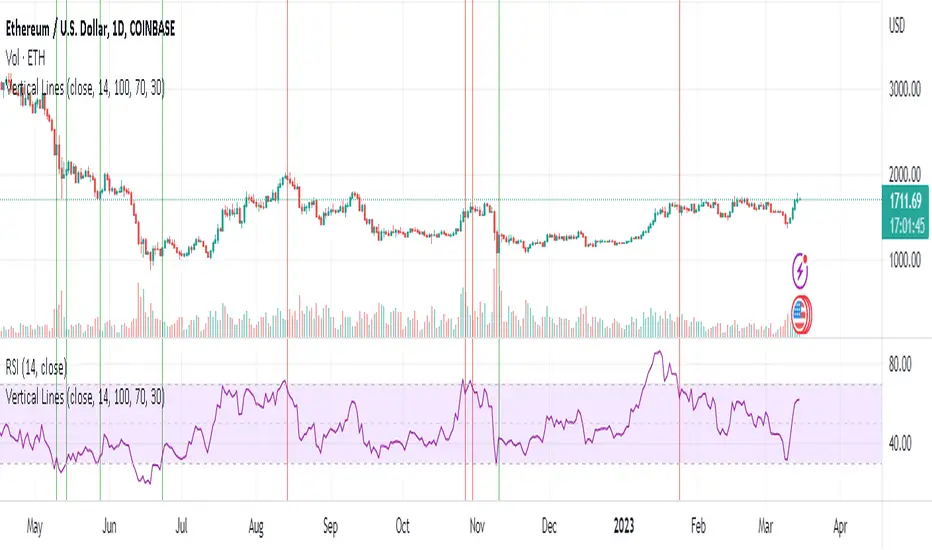
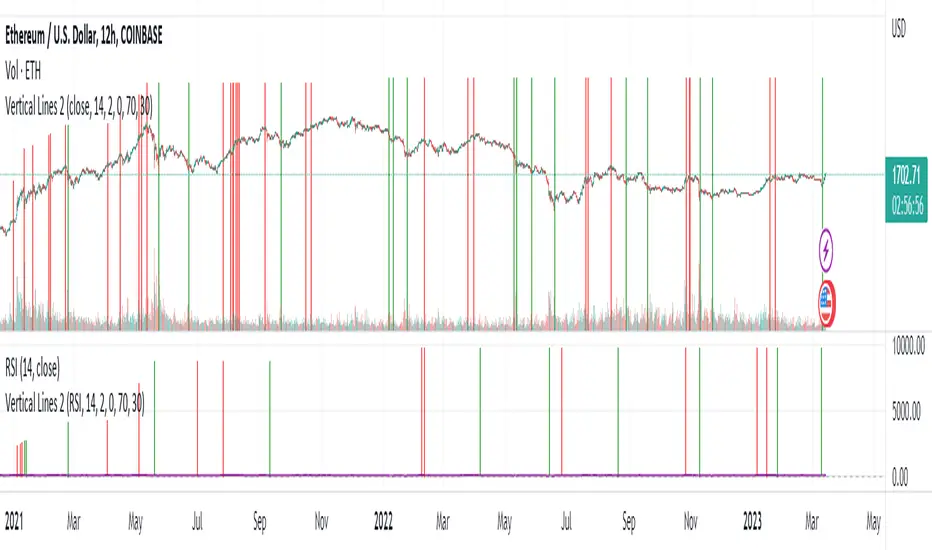
Vertical Lines 2A vertical line plotting function is missing in Pinescript. This is another method to plot vertical line on a chart, and an improvement on my previous script "vertical lines" .
The script hacks the plotcandle function to display just the wicks without the body. This hack simulates a vertical line. The body of the candle is non-existing since the open and close are the same and its color is set to null. The wicks are abutting resulting in a continuous vertical line.
Drawbacks include inability to set width and transparency of the lines. The plotcandle function does not allow setting the width and transparency of the wicks. This feature would be desirable.
The crossing of the RSI of overbought and undersold zones is used as an example in this published script. Any indicator can be used and this script can be executed on any other indicator by using "add indicator" on the desired indicator, and selecting the indicator as the source. I added crossover lines on the plotted RSI as an example.
//////////////////////////////////////////////////////Breakdown of the script////////////////////////////////////////////////////////
The src input determines which price data is used for the highest value calculation. By default, it is set to the close price.
The length input determines the length of the RSI calculation. By default, it is set to 14.
The mult input determines the multiplier of the highest value that is used to determine the height of the vertical lines. By default, it is set to 100%, meaning the lines will reach the highest value in the dataset.
The top and bot inputs determine the overbought and oversold levels for the RSI. By default, they are set to 70 and 30, respectively.
The current_rsi and previous_rsi variables calculate the RSI values for the current bar and the previous bar, respectively.
The hi_value variable finds the highest value in the dataset, and the hi variable calculates the height of the vertical lines based on the highest value and the user-defined multiplier. The lo variable calculates the distance between the highest value and the current price data.
The uph, dnh, upl, and dnl variables determine the height and low of the vertical lines for when the RSI crosses overbought or oversold levels.
The if statements check if the RSI has crossed overbought or oversold levels and set the uph, dnh, upl, and dnl variables accordingly.
Finally, the plotcandle() function is used to plot the vertical lines on the chart. The open and close values are set to the src input, and the high and low values are set to the uph, dnh, upl, and dnl variables. The bordercolor argument is set to na to hide the borders of the lines, and the wickcolor argument is set to green or red, depending on whether the line is an overbought or oversold crossover.
/////////////////////////////////////////////////////////////////////////////////////////////////////////////////////////////////////////
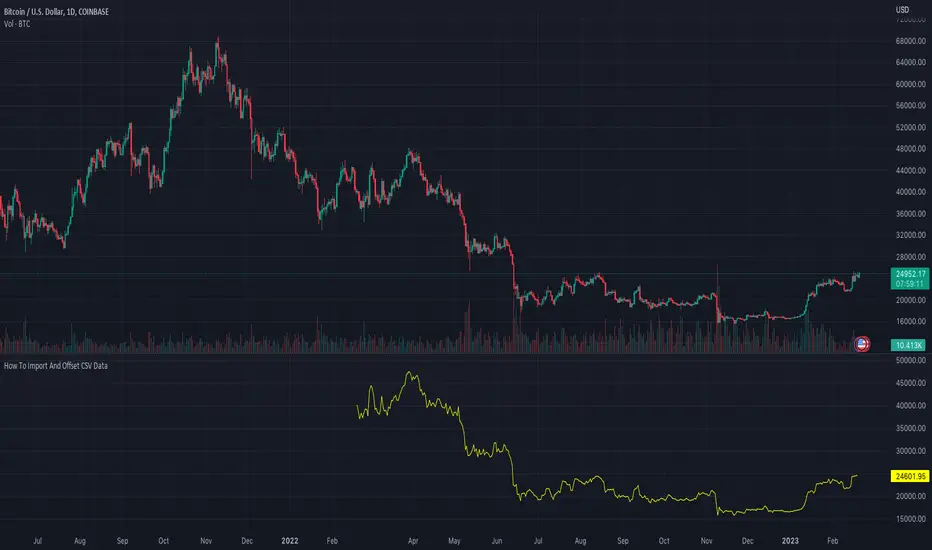
How To Import And Offset CSV DataExample method of how to import, offset, and plot CSV data using an array.
NOTICE: This is an example script and not meant to be used as an actual strategy. By using this script or any portion thereof, you acknowledge that you have read and understood that this is for research purposes only and I am not responsible for any financial losses you may incur by using this script!
Percent ResearchPercent Research is an indicator that will plot a color / column on the chart in case custom requirements are met.
The requirements are:
- Price : Price requirement (equal or above input).
- Change % Up : Amount the price have moved up in percent (equal or above input).
- Change % Down : Amount the price have moved down in percent (equal or below input).
- Change Interval : Amount of bars the above move happened over.
- Volume : Volume requirement (equal or above input).
- Volume Interval : Amount of bars in a row that each require the above volume.
Example: In case one wants to plot whenever price has made a 20 percent move up or down in a week with minimum 100 000 volume for each of the last 2 days one can use.
Change % Up: 20
Change % Down: -20
Change Interval: 5
Volume: 100 000
Volume Interval: 2
The indicator will plot a color on the chart whenever the requirements are met, which then can be used to look into price action for each colored time period.
The values can be customized dependent on preference, example 100% movers over a month or 20% movers over a week etc.

heikin ashi calculation call with higher timeframe
Hello, guys
This indicater displays the previous value of higher timeframe without request.security() function.
You can change the candle style ( heikinashi or normal) on the set box.
you can choose the higher timeframe also.
I made this to avoid the repainting.
Without Box() function, i only used plotcandle and fill.
It was good fun.
Good luck !!

Money Flow Index/MFIma/smooth vol-mfisoory for spaling not an english native speaker
this script is an extended version of MFI
i add it
mfi ema vol
and a verion that calc the MFI with smooth ma ema-vol
also the src for calc can be change now
thc code is open to explore for any use
enjoy.
Annual Returns % Comparison [By MUQWISHI]Overview
The Annual Returns % Comparison indicator aimed to compare the historical annual percentage change of any two symbols. The indicator output shows a column-plot that was developed by two using a pine script table, so each period has pair columns showing the yearly percentage change for entered symbols.
Features
- Enter date range.
- Fill up with any two symbols.
- Choose the output data whether adjusted or not.
- Change the location of the table plot
- Color columns by a symbol.
- Size the height and width of columns.
- Color background, border, and text.
- The tooltip of the column value appears once the cursor sets above the specific column. As it seen below.
Let me know if you have any questions.
Thanks.

RGB Color FiddlerKEEP YOUR COINS FOLKS! I DON'T NEED THEM, DON'T WANT THEM. Many other talented authors on TV deserve them.
INTRODUCTION:
This is my "RGB Color Fiddler", intended as a toy to play with. This colorcator is rated 'E' for every TV member. With this you can quickly generate about 1.67 million potential colors from color.rgb(). While I have a few preferred colors that are ideal for use, this allows you to finely tune colors to anything that pleases your eye on your canvas.
TIPS:
The overlay chart can be peppered with colors of all varieties, so it's necessary to have properly distinguished coloring and contrast separation. If you employ light charts, you can tweak colors to just the right shade you desire on your display. Not all LCDs are created equal, even when color calibrated. With specific discovered colors tailored to your liking, you may uniquely color code ALL of your indicators.
UTILITY:
The input()s in Settings allow up to 4 different colors to tinker with and compare. After selecting focus of an input, you can easily use the up/down keyboard keys to make swift adjustments numerically or with options. The color combos you are creating will be displayed in color hex or a RGB representation within the labels.
Also of great benefit, is the ability to cycle through the currently available plot() styles. Some styles will require you to zoom in closeup to observe their behaviors. There is a few other ways to finagle plot() parameters to also achieve other acrobatic effects that are not demonstrated here. Closer study of plot() parameters in the reference can reveal those. Anyhow, I won't bother you with more elaborate technical jargon, now is the time to fiddle with this toy to your benefit!
CODE REUSE:
Any member has the freedom to use any of the code in this script any way they see fit. It's specifically intended for all. There is absolutely no need for accreditation for any of this code reuse ever, in the present case. Don't worry about, I'm certainly not.
When available time provides itself, I will consider your inquiries, thoughts, and concepts presented below in the comments section, should you have any questions or comments regarding this indicator. When my indicators achieve more prevalent use by TV members , I may implement more ideas when they present themselves as worthy additions. Have a profitable future everyone!

PSv5 Color Magic and Chart Theme SimulatorKEEP YOUR COINS FOLKS! I DON'T NEED THEM, DON'T WANT THEM. Many other talented authors on TV deserve them.
INTRODUCTION:
This is my "PSv5 Color Magic and Chart Theme Simulator" displayed using Pine Script version 5.0. The purpose of this PSv5 colorcator is to show vivid colors that are most suitable in my opinion for modifying or developing Pine scripts. Whether you are new to Pine or an experienced Pine poet, this should aid you in developing indicators with stunning color from the provided color list that is easily copied and pasted into any novel script you should possess. Whichever colors you choose, and how, is up to your imagination's capacity.
COMMENTARY:
I have a thesis. Pine essentially is a gigantor calculator with a lot of programmable bells and whistles to perform intense analytics. Zillions of numbers per day are blended up into another cornucopia of numbers to analyze. The thing is, ALL of those numbers are moot unless we can informatively portray them in various colorized forms with unique methods to point out significant numeric events. By graphically displaying them with specific modes of operation, only then do these numbers truly make any sense to us and become quantitatively beneficial.
I have to admit... I hate numbers. I never really liked them, even before I knew what an ema() was. Some days I almost can't stand them, and on occasion I feel they deserve to be flushed down the toilet at times. However, I'm a stickler for a proper gauge of measurements. Numbers are a mental burden, but they do have "purpose and meaning". That's where COLOR comes in! By applying color in specific ways in varying dynamic forms, we can generate smarter visual aids from these numerics. Numbers can be "transformed" into something colorful it wasn't before, into a tool, like a hammer. But we don't need a hammer, we need an impressive jack hammer for BIG problem solving that we could never achieve in the not to distant past.
As time goes on, we analytically measure more, and more, and more each year. It's necessary to our continual evolution. That's one significant difference between us and cave men, and the pertinent reason why we are quickly evolving as a species, while animals haven't. Humankind is gifted to enumerate very well AND blessed to see in color. We use it for innumerable things in the technological present for purpose and pleasure. Day in and day out, we take color for granted, because it's every where we can look. The fact is, color is the most important apparatus in humankind's existence EVER. We wouldn't have survived this far without it.
By utilizing color to it's grand potential, greater advancements can be attained while simultaneously being enjoyed visually. Once color is transformed from it's numeric origins into applicable tools, we can enjoy the style, elegance, and QUALITATIVE nature of the indication that can be forged. Quantities can't reveal all. Color on the other hand has a handy "quality" factor to it, often revealing things we can't ordinarily recognize. When high quality tools provide us with obtained goals, that's when we will realize how magical color truly is, always has been, and shall always be.
The future emerging economies and future financial vessels of people around the globe are going to be dependent on the secured construction of intelligent applications with a rock solid color foundation, not just math alone. I have no doubt about that. I can envision that with my eyes closed. To make an informed choice, it should be charted or graphed somehow prior to a final executive decision to trade. Going back to abysmal black and white with double decimal points placed next to cartoons within extinction doomed newspapers is not a viable option any more.
OBSERVATIONS AND UTILITY:
One thing you will notice is the code is very dense. Looks almost hideous right? Well, the variable naming is lengthy, but it's purpose is to be self explanatory, even for those who don't know how to program, YET. I'm simply not a notation enthusiast. My main intention was to provide clearly identifiable variables from their origin of assignment to their intended destination of use, clearly visible for anyone visiting. The empowerment of well versed words that are easier to understand, is a close rival to the prominent influence color has.
Secondly, I'm displaying hline() and label.new() as prime candidates to exemplify by demonstration how the "Power of Color" can be embraced with the "Power of Pine". Color in Pine has been extensively upgraded to serve novel purposes to accomplish next generation indicators that do and WILL come to exist. New functions included with PSv5 are color.rgb(), color.from_gradient(), color.r(), color.g(), color.b(), and color.t() to accompany color.new() in our mutual TV adventures. Keep in mind, the extreme agility of color also extends to line.new(), the "entirely new" linefill.new(), table.new(), bgcolor() and every other function that may utilize color.
There's a wide range of adjustability in Settings to make selections to see how they perform on different backgrounds, with their size and form. As you curiously toy with those, you're going to notice how some jump out like laser beams while others don't. Things that aren't visually appealing, still have very viable purposes, even if they don't stand out in the crowd. Often, that's preferable. The important thing is that when pertinent information relative to indication is crucial, you can program it with distinction from an assortment of a potential 1.67 million colors that can be created in Pine. "These" are my chosen favorite few, and I hope you adopt them.
PURPOSES:
For those of you who are new to Pine Script, this also may help you understand color hex/rgb and how it is utilized in Pine in a most effective manner. The most skilled of programmers can garner perks as well. There is countless examples of code diversity present here that are applicable in other scripts with adequate mutation. Any member has the freedom use any of this code in this script any way they see fit. It's specifically intended for all. There is absolutely no need for accreditation for any of this code reuse ever, in the present case. Don't worry about, I'm not.
The color_tostring() will be most valuable in troubleshooting color when using color.rgb() and becoming adept with it. I'm not going to be able to use color.rgb() without it. Chameleon indicators of the polychromatic variety are most likely going to be fine tuned with color_tostring() divulging it's results to label.new() or even table.new() maybe. One the best virtues of this script in chart, is when you hover over the generated labels, there's a hidden gift for those who truly wish to learn the intricate mechanics of diverse color in Pine. Settings has informative tooltips too.
AFTERTHOUGHTS:
Colors are most vibrant on the "Black Chart" which is the default, but it doesn't currently exist as a chart theme. With the extreme luminous intensity of LCDs in millicandela( mcd ), you may notice "Light" charts may saturate the colors making charts challenging to analyze. Because of this, I personally use "Dark Charts" and design my indicators specifically for these. I hope this provides inspiration for the future developers who are contemplating the creation of next generation indicators and how color may enhance their usefulness.
When available time provides itself, I will consider your inquiries, thoughts, and concepts presented below in the comments section, should you have any questions or comments regarding this indicator. When my indicators achieve more prevalent use by TV members , I may implement more ideas when they present themselves as worthy additions. Have a profitable future everyone!

Vertical LinesThis script plots vertical lines on charts or indicators. Unfortunately pinescript is lacking a vertical line plotting function. Vertical lines are useful to mark events, such as crossover of levels, indicators signals or as a time marker.
After searching the internet for a long time and trying different scripts, this script is the simplest and visually the best. You would think that plotting a vertical line would be relatively easy, it is not! I thank the unknow author for sharing this solution and now I will share it on tradingview to make it readily available to anybody that needs it.
RSI crossover signals are used as an example in this script. When the RSI crosses over 70 or below 30, the script plots a red or green vertical line.
The script plots a vertical line as a histogram bar. The histogram bar must have a height.
Setting the height near infinity like 1e20 will cover all the ranges from top to bottom in most charts, but doesn't work all the time. If the chart range is small in values, the line is not plotted or the chart is visually compressed because the top of the bar is also a data point in the chart. Another solution is to find the highest point in the chart and multiply it by a number from 2 to 10 to set the top of the histogram bar. But this solution doesn't work if the line is drawn in the indicator window. additionally if the chart or indicator includes negative values, a histogram bar with a negative height must be concatenated to the histogram bar with a positive height to cover the positive and negative range.
It would seem intuitive to include a vertical plot function since it is very useful and pinescript already has a horizontal line plot function called Hline. But pinescript is becoming less intuitive, and redundant. A case in point is Version 4 variable declaration and naming, it less intuitive and more redundant than previous versions. I beg Tradingview to adopt a more refined scripting language such as Matlab or Python for charting purposes. These languages can be easily ported to other analysis programs for AI or statistical analysis.
Scalping Trading System ALERT Crypto and StocksThis is the alert version of the strategy with the same name.
Indicators
SImple Moving Average
Exponential Moving Average
Keltner Channels
MACD Histogram
Stochastics
Rules for entry
long= Close of the candle bigger than both moving averages and close of the candle is between the top and bot levels from Keltner . At the same time the macd histogram is negative and stochastic is below 50.
short= Close of the candle smaller than both moving averages and close of the candle is between the top and bot levels from Keltner . At the same time the macd histogram is positive and stochastic is above 50.
Rules for exit
We exit when we meet an opposite reverse order.
This strategy has no risk management inside, so use it with caution !

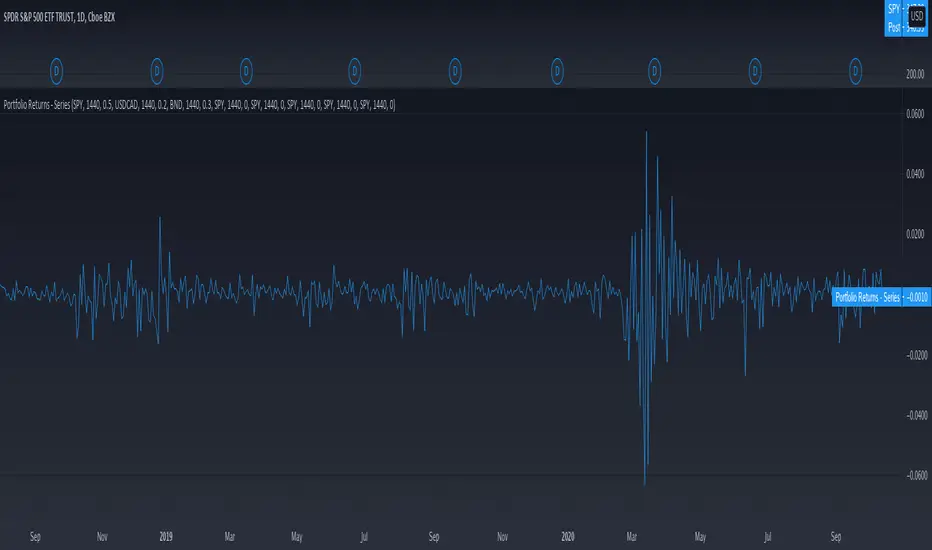
Portfolio Log Returns - SeriesPlot a series of your portfolio! Merely calculate the (constant) weights (ensuring that they sum to one) and plug in along with the corresponding symbols in order to visualize your portfolio returns as a series. Experimenting before settling on a portfolio? Calculate your theoretical weights using tools online for mean-variance optimization, Black-Litterman allocation, or the like!
Dollar Cost Average (Data Window Edition)Hi everyone
Hope you had a nice weekend and you're all excited for the week to come. At least I am (thanks to a few coffee but that still counts !!!)
This indicator is inspired from Dollar-Cost-Average-Cost-Basis
EDUCATIONAL POST
The educational post is coming a bit later this afternoon explaining how to use the indicator so I would advise to follow me so that you'll get updated in real-time :) (shameless self-advertising)
1 - What is Dollar-Cost Averaging (DCA)?
Dollar-Cost Averaging is a strategy that allows an investor to buy the same dollar amount of an investment on regular intervals. The purchases occur regardless of the asset's price.
I hope you're hungry because that one is a biggie and gave me a few headaches. Happy that it's getting out of my way finally and I can offer it
This indicator will analyse for the defined date range, how a dollar cost average (DCA) method would have performed vs investing all the hard earnt money at the beginning
2- What's on the menu today ?
Please check this screenshot to understand what you're supposed to see : CLICK ME I'M A SCREENSHOT (I'll repeat this URL one more time below as I noticed some don't read the information on my description and then will come pinging me saying "sir me no understand your indicator, itz buggy sir"
(yes I finally thought about a way to share screenshots on TradingView, took me 4 weeks, I'm slow to understand things apparently)
My indicator works with all asset classes and with the daily/weekly/monthly timeframes
As always, let's review quickly the different fields so that you'll understand how to use it (and I won't get spammed with questions in DM ^^)
- Use current resolution : if checked will use the resolution of the chart
- Timeframe used for DCA : different timeframe to be used if Use current resolution is unchecked
- Amount invested in your local currency : The amount in Fiat money that will be invested at each period selected above
- Starting Date
- Ending Date
- Select a candle level for the desired timeframe : If you want to use the open or close of the selected period above. Might make a diffence when the timeframe is weekly or monthly
3 - Specifications used
I got the idea from this website dcabtc.com and the result shown by this website and my indicator are very interesting in general and for your own trading
The formula used for the DCA calculation is that one : Investopedia Dollar Cost Average
4 - How to interpret the results
"But sir which results ??"...... those ones : CLICK ME I'M A SCREENSHOT :) (strike #2 with the screenshot)
It will draw all the plots and will give you some nice data to analyze in the Data Window section of TradingView
I'm not completely satisfied with the tool yet but the results are very closed to the dcabtc website mentioned above
If you're trading a very bullish asset class (who said crypto ?), it's very interesting to see what a DCA strategy could bring in term of performance. But DCA is not magic, there is a time component which is the day/week/month you'll start to invest (those who invested in crypto beginning of 2018 in altcoins know what I'm talking about and ..............will hate me for this joke)
5 - What's next ?
As said, the educational post is coming next but not only.
Will probably post a strategy tomorrow using this indicator so that you can compare what's performing best between your trading and a dollar cost average method
I'll publish as a protected source this time a more advanced version of that one including DCA forecasts
6 - Suggested alternative (but I'll you doing it)
If you don't want to have this panel in the bottom with the plots and analyze the results in the data window, you can always create an infopanel like shown here Risk-Reward-InfoPanel/ and display all the data there
Hope you'll like it, like me, love it, love me, tip me :)
____________________________________________________________
Feel free to hit the thumbs up as it shows me that I'm not doing this for nothing and will motivate to deliver more quality content in the future. (Meaning... a few likes only = no indicators = Dave enjoying the beach)
- I'm an offically approved PineEditor/LUA/MT4 approved mentor on codementor. You can request a coaching with me if you want and I'll teach you how to build kick-ass indicators and strategies
Jump on a 1 to 1 coaching with me
- You can also hire for a custom dev of your indicator/strategy/bot/chrome extension/python

line plotline plot any of the following or any combination of them together:
high, low, open, close, hl2, ohlc4

Seven Simple Moving AveragesBy default, this script overlays seven simple moving averages (5, 10, 20, 50, 100, 150, 200) and allows you to customize the SMA values as you wish. If a candle closes at or above a moving average, the plot for that SMA is colored green for that candle otherwise it's red.


Multiple Ema 20/50/100Multiple Ema 20/50/100 and you can add more EMA Plot easily by changing the codes.

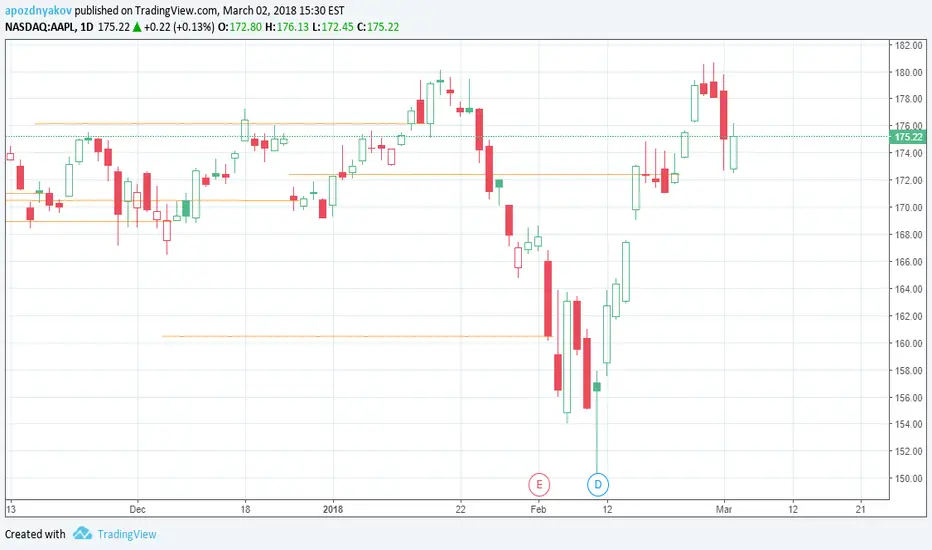
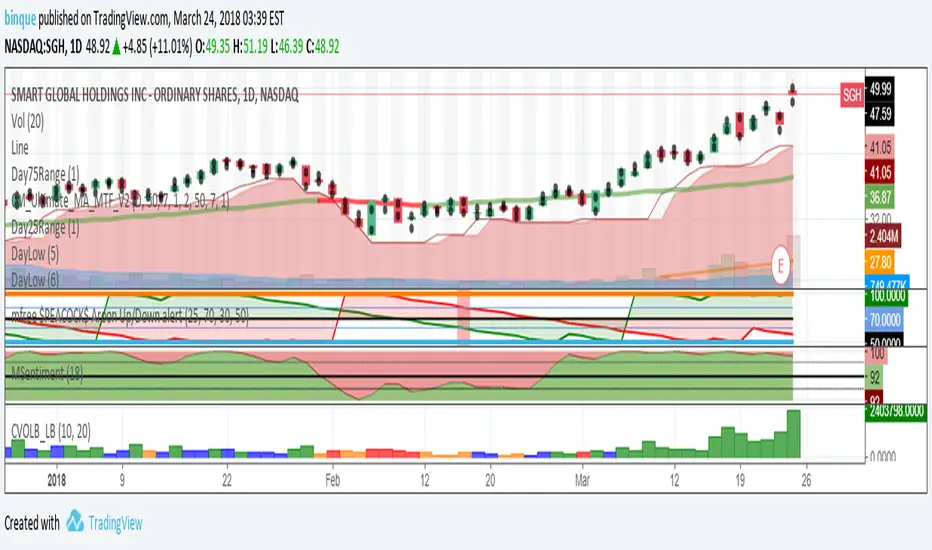
Day25RangeDay25Range(1) - Plot on the candle the 25% low range of the daily price. This helps to show when the current price is at or below the 25% price range of the day. Best when used with other indicators to show early wakening strength in price. On the attached chart, if you look at Jan 23, 2018 you will see a red candle that closed below the 25% mark of the trading day. For that day the 25% mark was at 38.66 and the close of the day was at 38.25 That indicators a potential start of a strong swing trade down. A second signal was given on Jan 25, 2018 when a red candle closed (37.25) below the 25% mark (38.08) again. Within the next few days a third weak indicator signaled on Jan 30,2018 with a close (35.88) below the Day25Range (37.46). price continued down from there for the next 4 days before starting to reverse. If the price closes below the 25% daily range as shown on the Day25Range(1) indicator, this could indicate a possible start of weakening in the price movement.
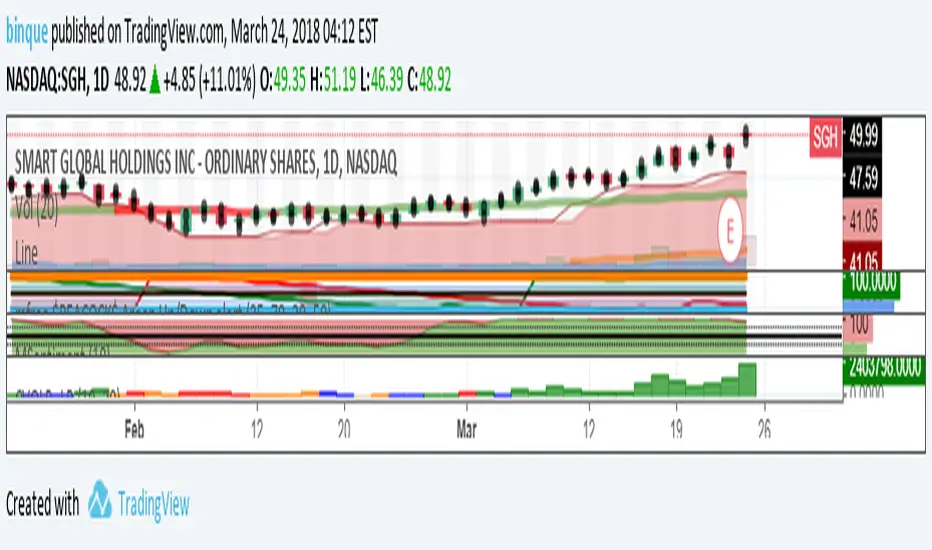
Day25RangeDay25Range(1) - I use this indicator to show where the lower 25% daily range of a stock is. This helps to show weakness in a stock during the trading day. I use this indicator with a CIRCLE or DOT plotted on the candle. Makes it easy to show weakness during the trading day.
draw line at bar on condition, up to 40 bars in lengthDraws line at bar on condition, up to 40 bars in length.
Well, that's not a line, but a set of `—` characters. But it looks like a line, so it is line.