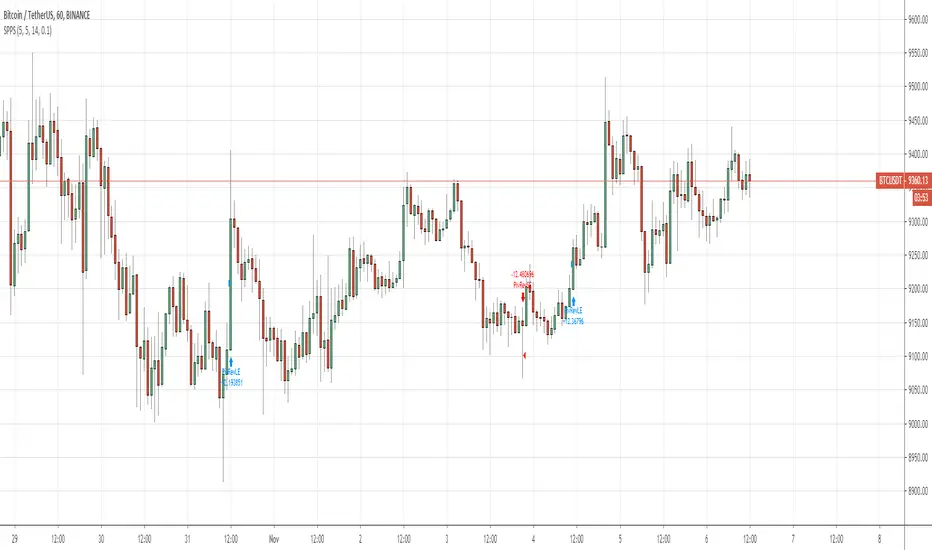
Donchian Channel - Pivot High-LowCombining Pivot High Low and Donchian Channel - both of which are useful indicators for trend following.
Donchian Channel shows highest and lowest prices for X number of bars.
Pivot High-Low identifies when price made new Highs and Lows
Applying Donchian Channel on Pivot High-Low channel, we are plotting highest and lowest pivots formed in X bars.
In this indicator, we have 3 options for Channel Base :
Price : This is regular Donchian channel based on High-Low Price
Pivots : This is Donchian channel based on pivot points.
Combined : Combines both. Takes highest of Price and Pivots for plotting high, lowest of Price and Pivots for plotting low
Pivothigh

Pivot Support and Resistance Finder [JV] V2Dear Traders,
This script is a follow-up to my previous Pivot Support and Resistance Finder.
After so many positive feedback, for which I thank you all, I started rebuilding it to implement some requested features.
The biggest change is that by default, the indicator now shows zones instead of lines.
Support Zone: from low to close
Resistance Zone: from close to high
I removed the 5 lines, instead showing the most recent levels and the forming (fast) levels.
However, if you change the occurrence in the options, you can still see previous levels:
0 = Current Level
1 = Previous Level
2 = Level before the Previous Level
...
More important configurable options:
Pivot Length
Pivot Quick Length (used to draw forming levels
Option to draw using bar closes, wicks or both (area)
Hide / Display to forming level
Show past levels.
I hope this is clear enough.
For any questions, remarks, suggestions, feel free to contact me.
Happy Trading!

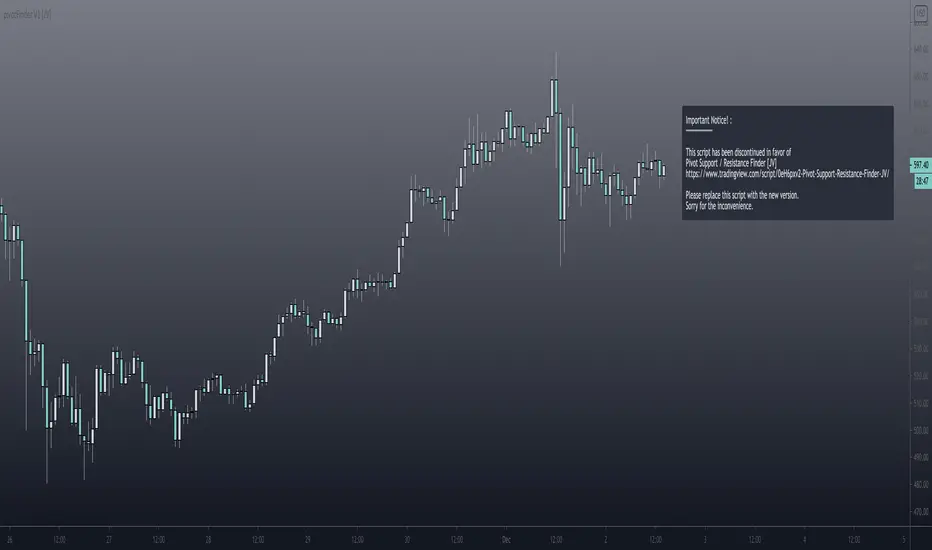
Pivot Support and Resistance Finder [JV] V1Hi Traders.
This is my first attempt of writing an indicator.
Let me start by saying I could never have done this without lmatl and WMX_Q_System_Trading who were and are an incredible source of inspiration.
This indicator shows horizontal Pivot Support and Resistance . It draws up to 4 horizontal lines extending to the right from and adds labels to High and Low Pivot Candles . It also draws the Support / Resistance that is currently forming.
You can select the number of lines on the current timeframe.
There are some options in Settings:
Current timeframe pivot settings
Show and hide levels of the current timeframe
Change colors
Extend Lines
Any suggestions are more than welcome!
I also welcome donations, no matter how small ;-)
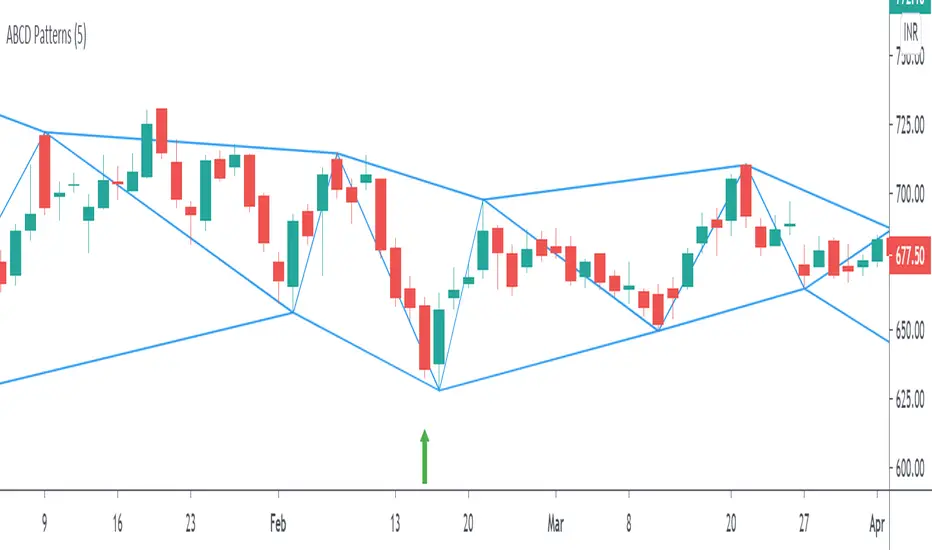
ABCD Harmonic PatternsShows Bullish and Bearish AB=CD Harmonic Patterns with Pivot High, Pivot Low and Pivot Line
Pivot Reversal AlertsPivot Reversal Study script, for generating Alerts and visual plotting of Pivot Reversal lines on the charts. Use a Strategy script (like Figs & Dates), for backtesting different settings on various time frames and charts.

Smoothed Pivot Reversal Alerts [QuantNomad]This is study with alerts for my "Smoothed Pivot Reversal Strategy". Strategy script is open to the public so you can use it freely.
When creating alerts - choose "Once Per Bar Close"
It's a pro indicator, you can have access to it for a small fee. Link to my PRO indicators you can find in my signature.

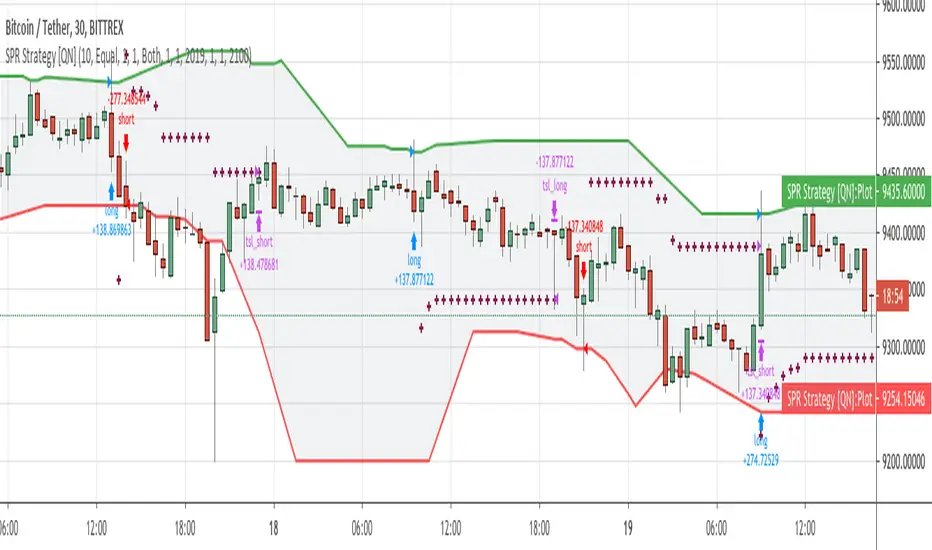
Smoothed Pivot Reversal Strategy [QuantNomad]With this strategy trying to rethink the standard pivot reversal strategy.
Don't like the idea that for 10/10 pivot you have to wait for 10points to confirm it. So I used multiple pivot levels and calculated the average line. This way when we have a new high level approaching it smoothly.
This way you can have a bit better price for entries but the risk of fake entries bit bigger as well.
I'm using the usual trailing stop loss as an exit for this strategy.
Parameters for this strategy is pretty simple:
Left/Right bars for pivot points.
Additional smoothing - you can additionally smooth pivot lines with EMA
% for Traling SL
PRP - Pivot Reversal + PSAR Alerts [QuantNomad]This is study with alerts for my "PRP - Pivot Reversal + PSAR Strategy".
When creating alerts - choose "Once Per Bar Close"
It's a pro indicator, you can have access to it for a small fee. Link to my PRO indicators you can find in my signature.

PRP - Pivot Reversal + PSAR Strategy [QuantNomad]PRP is a combination of Pivot Reversal and PSAR Strategy. With this strategy, I tried to be in a position for big moves in the market.
The strategy uses Pivot Reversal entries with an additional condition that TR of entry bar should be at least X ATRs. This allows to filter out some false signals.
For exits, I recoded the PSAR indicator as trailing stop loss. So I start PSAR Y ATRs below the Pivot level price crossed at entry. After that PSAR behaves as usual.
For stability and easier execution, I check conditions only on the close, no stop/limit orders are used.

Fibonacci Pivot PointsI have included the main support and resistance pivot point levels for the Fibonacci Pivot Points. I changed the bar colors to reflect buy and sell points so if a bar is green then that means to buy it and if it is red then sell it
Let me know if you would like to see me do any other indicators!

CPRFibonacciPivots By EquityDuraiThe Central Pivot Range (CPR) is one of the most versatile price-based indicators available to traders. ... At any given time, the range can be support or resistance, it can forecast trending or sideways price behavior, dictate the day's direction, or serve as an integral part of a trend.
Keep in mind that depending on the market’s behavior, the formula for TC may in fact create the level for BC, and vice versa. I always refer to the highest level as TC, and the lowest level as BC, regardless of which formula led to the level’s creation.

TFi Pivot Reversal StudyThe Pivot Reversal Study script uses pivot points to create a support and resistance level; based on this levels the script creates virtual stop-market orders to catch the trend if the price is crossing the pivot lines.
A configurable trailing-stop and stop-loss is being used to exit an open position.
The entry and exit points are visualized in the chart via green arrows and crosses; the position follows the exact behavior of the strategy script.
The study also creates alerts, which follow the exact position of the entry/exit markers. Via the input parameter "Alert Message Type" it is possible to select a predefined alertcondition message; right now the script supports a generic default message and a trading setup for Alertatron.
How to use
The study works with all timeframes; the current chart setting is using a 15min timeframe. The strategy enters about 10 trades per day, depending on the used settings.
I'm also providing a "strategy" version of this study, which can be used to backtest the strategy.
How to access
This strategy is a "Invite Only" script. You can can subscribe or purchase the strategy ; please use the link below or send me a message via Tradingview to obtain access to the strategy and study script.
For enabling the script in your Tradingview chart window, click on "Indicators" and select "Invite-Only Scripts".
Full list of alerts:
'Enter Long' ... Enter long position
'Enter Short' ... Enter short position
'Exit Long PT' ... Exit long position - profit-target reached
'Exit Short PT' ... Exit short position - profit-target reached
'Exit Long SL' ... Exit long position - stop-loss
'Exit Short SL' ... Exit short position - stop-loss
Full list of parameters:
"Pivot Left Bars" ... Number of bars on the left of the pivot point - used for pivot/peak detection
"Pivot Right Bars" ... Number of bars on the right of the pivot point - used for pivot/peak detection
"Entry Offset " ... Entry price offset after crossing pivot line (in %)
"Trailing Activation Level " ... Trailing stop activation level above/below average price (in %)
"Trailing Offset " ... Trailing stop price (in %)
"Stop Loss " ... Absolute stop-loss (in %)
"Alert Message Type" ... Alert message type: generic or Alertatron
"Backtest ..." ... Backtest timeframe; area outside this timeframe will be grayed out
I'm looking forward to any feedback, reviews and change requests!

TFs Pivot Reversal StrategyThe Pivot Reversal strategy script uses pivot points to create a support and resistance level; based on this levels the strategy creates virtual stop-market orders to catch the trend if the price is crossing the pivot lines.
A configurable trailing-stop and stop-loss is being used to exit an open position.
How to use
The strategy works with all timeframes; the current chart setting is using a 15min timeframe. The strategy enters about 10 trades per day, depending on the used settings.
I'm also providing a "study" version of this strategy, which can be used to automate the strategy by using webhooks for instance.
The script is using a default commission of 0.075% which reflects Bitmex' Taker-Fees. This is just a default and can be modified in the strategy settings for each instrument individually.
How to access
This strategy is a "Invite Only" script. You can can subscribe or purchase the strategy ; please use the link below or send me a message via Tradingview to obtain access to the strategy and study script.
For enabling the script in your Tradingview chart window, click on "Indicators" and select "Invite-Only Scripts".
Full list of parameters:
"Pivot Left Bars" ... Number of bars on the left of the pivot point - used for pivot/peak detection
"Pivot Right Bars" ... Number of bars on the right of the pivot point - used for pivot/peak detection
"Entry Offset " ... Entry price offset after crossing pivot line (in %)
"Trailing Activation Level " ... Trailing stop activation level above/below average price (in %)
"Trailing Offset " ... Trailing stop price (in %)
"Stop Loss " ... Absolute stop-loss (in %)
"Capital Risk Factor " ... Capital risk factor (in %)
"Margin / Leverage " ... Optional leverage factor which can be used to leverage position (in %)
"Backtest ..." ... Backtest timeframe; area outside this timeframe will be grayed out
I'm looking forward to any feedback, reviews or change requests!

BEST Pivots CloudHello traders,
This script is an adaption of an FXCM indicator called Pivots Cloud
Takes in input two timeframes, build the pivots based on them and fill the space between those pivots
Should be non-repainting
Best
Dave

Pivot of Pivot Reversal Strategy [QuantNomad]Continue looking for more signifcant pivot points.
This script is based on my "Significant Pivot Reversal Strategy".
In this strategy I use concept of pivot of pivot points.
So for PoP I require that pivot highs point should have 2 lower pivot highs points around them and pivot low 2 higher pivot lows points.
Transparent lines represent usual pivot levels ints.
Not transparent lines represent pivot of pivot levels.
Link to original script:

The Multi-day Central Pivot RangeThe indicator is a Multi-day CPR.
It shows CPR range as per yesterday's HLC and also CPR range for last n number of trading sessions.
For example: If you mention the value as two in Multi-day CPR (blue color) then it calculates the CPR using HLC of the last two trading sessions.
Also, the daily CPR is designed in such a way to highlight Virgin CPR (purple color) separately from the normal CPR(fuchsia color) .

Pivot Points HIgh LowRemake of the integrated Pivot Points indicator
With higher resolution you should lower the indicator values to get a good result

QuantNomad - Significant Pivot Reversal Strategy AlertsAlerts for "Significant Pivot Reversal Strategy":
As one of the ways to filter out insignificant levels I decided to check that pivot point is not above/below neighbors, but check that it's above/below at least by a certain amount.
I use ATR, so in params, you can set length of ATR and also ATR multiplier. The new level will be calculated only if PP will be above/below neighbors by atr * atr_mult.
It seems this approach might help in some cases.

QuantNomad - Significant Pivot Reversal StrategyI'm working on improving the Pivot Points Reversal Strategy.
As one of the ways to filter out insignificant levels I decided to check that pivot point is not above/below neighbors, but check that it's above/below at least by a certain amount.
I use ATR, so in params, you can set length of ATR and also ATR multiplier. The new level will be calculated only if PP will be above/below neighbors by atr * atr_mult.
It seems this approach might help in some cases.
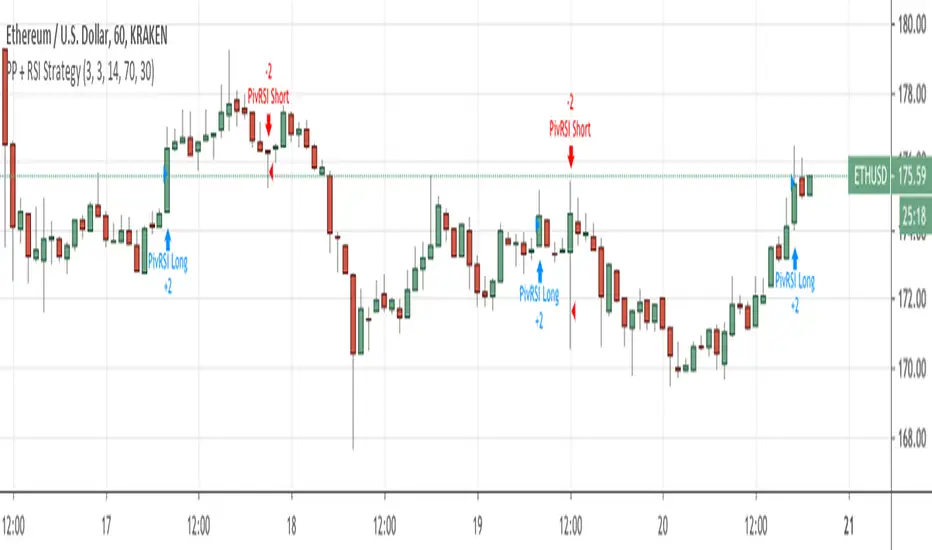
Here I have PivotPoint + RSI strategy:
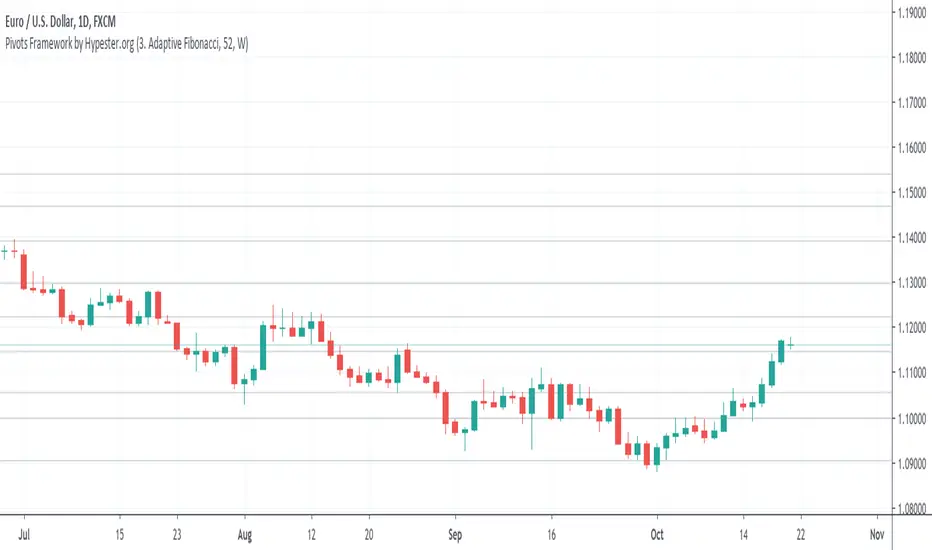
Pivots Framework by HypesterThis is the first release of the basic pivot framework with the three most used ones by our Alpha Community.
You can easily switch between modes, adjust the lookback period, and it works multi-resolution.
Right now, we have:
BB Fibo
Murrey's Channels
Adaptive Fibonacci
The next release will be ATR based pivot formula.
Pivot Point Reversal + RSI AlertsThese are alerts for previously published strategy:
This strategy joins the Pivot Reversal strategy with the RSI indicator.
We check RSI level at the pivot point level and only if RSI condition is satisfied we update levels for stop orders.

Pivot Point Reversal + RSI StrategyThis strategy joins the Pivot Reversal strategy with the RSI indicator.
We check RSI level at the pivot point level and only if RSI condition is satisfied we update levels for stop orders.
The strategy works pretty good for crypto, 30m, 1h, 2h timeframes.