Dynamic Pivot Point [MarkitTick]Title: Dynamic Pivot Point MarkitTick
Concept
Unlike traditional Pivot Points, which plot static horizontal levels based on the previous period's High, Low, and Close, this script introduces a dynamic element by applying an Exponential Moving Average (EMA) to the calculated pivot levels. This approach allows the Support and Resistance zones to adapt more fluidly to recent price action, reducing the jagged steps often seen in standard multi-timeframe pivot indicators.
How It Works
The script operates in two distinct phases of calculation:
1. Data Extraction and Core Math:
The indicator first requests the High, Low, and Close data from a user-defined timeframe (e.g., Daily, Weekly). Using this data, it calculates the standard Pivot Point (P) alongside three levels of Support (S1, S2, S3) and three levels of Resistance (R1, R2, R3) using standard geometric formulas:
Pivot = (High + Low + Close) / 3
R1 = 2 * Pivot - Low
S1 = 2 * Pivot - High
(Subsequent levels follow standard Floor Pivot logic).
2. Dynamic Smoothing:
Instead of plotting these raw values directly, the script processes each calculated level (P, S1-S3, R1-R3) through an Exponential Moving Average (EMA). The length of this EMA is controlled by the Pivot Length input. This smoothing process filters out minor volatility and creates curved, dynamic trajectories for the pivot levels rather than static straight lines.
How to Use
Traders can use this tool to identify dynamic areas of interest where price may react.
The White Line represents the Central Pivot. Price action relative to this line helps determine the immediate bias (above for bullish, below for bearish).
Green Lines (Support 1, 2, 3) indicate potential demand zones where price may bounce during a downtrend.
Red Lines (Resistance 1, 2, 3) indicate potential supply zones where price may reject during an uptrend.
Because the levels are smoothed, they can also act as dynamic trend followers, similar to moving averages, but derived from pivot geometry.
Settings
Show Pivot Points: Toggles the visibility of the plot lines on the chart.
Pivot Length: Defines the lookback period for the EMA smoothing applied to the pivot levels. A higher number results in smoother, slower-reacting lines.
Timeframe: Determines the timeframe used for the underlying High/Low/Close data (e.g., selecting "D" calculates pivots based on Daily data while viewing a lower timeframe chart).
Disclaimer This tool is for educational and technical analysis purposes only. Breakouts can fail (fake-outs), and past geometric patterns do not guarantee future price action. Always manage risk and use this tool in conjunction with other forms of analysis.
Pivot_points

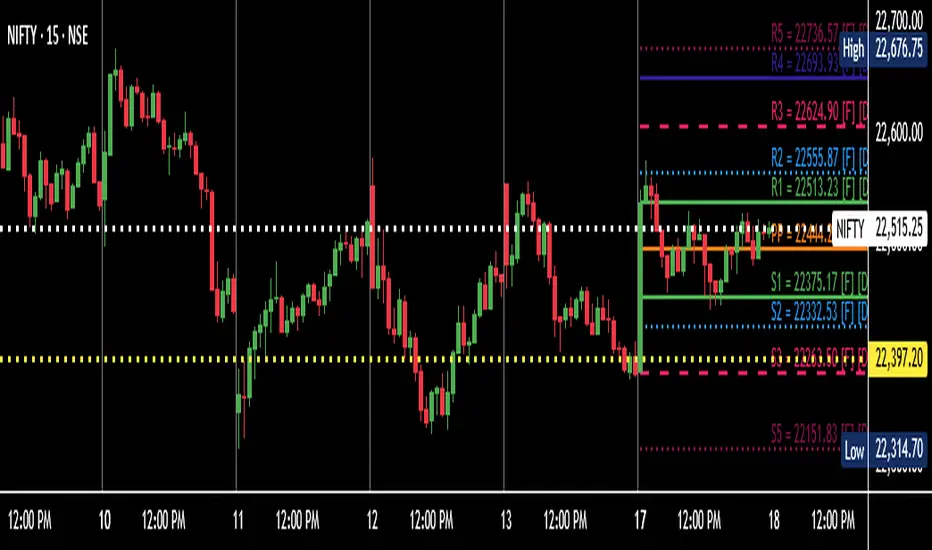
Manual Pivot Plotter//================================================================================
//📌 Manual Pivot Plotter (P, R1–R3, S1–S3)
//📈 Pine Script v6
//
//This script allows the user to manually input Pivot levels (P), Resistance levels
//(R1, R2, R3), and Support levels (S1, S2, S3). Each line starts at the beginning
//of the new trading day (detected at 00:00 UTC+8) and extends only a limited
//distance into the future (default: 3 bars).
//
//Features:
//✔ Manual pivot, support, and resistance level inputs
//✔ Lines refresh automatically at each new day (00:00 UTC+8)
//✔ Lines extend only a few bars ahead (not full chart)
//✔ Clean label placement slightly below line and near line end
//✔ No repainting, memory-safe line handling
//✔ Smooth intraday updates when values are edited
//
//This tool is ideal for traders who manually calculate or import pivot levels and
//prefer clean, minimal, non-intrusive visual levels on the chart.
//================================================================================

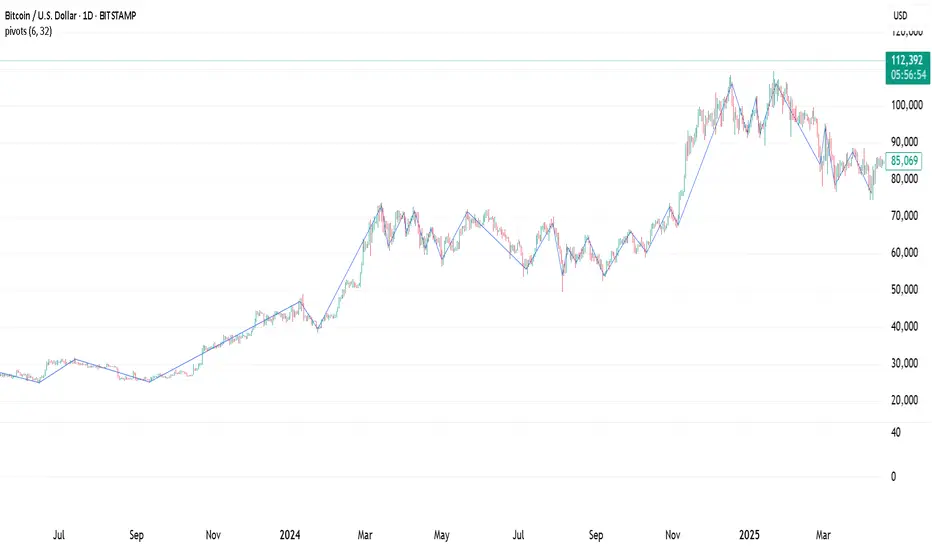
Pivot Points. High & Lows By Reversal PercentageLibrary "Pivot Points. High & Lows By Reversal Percentage" by Jal9000
This Pine Script library provides a robust function for identifying and tracking pivot points (reversal points) in price data, suitable for integration into custom trading indicators and strategies.
🛠️ Main Features:
- ✅ Identifies pivot highs and lows based on configurable price movement thresholds.
- ✅ Lightweight. No candle backtracing used. Much less computation heavy.
- ✅ Supports multiple calls (with different values) within a single script.
- ✅ Compatible with request.security for multi-timeframe analysis.
- ✅ Returns both confirmed and temporary pivots for flexible integration.
- ✅ Pinescript V5 and V6 compliant code.
Purpose:
The pivots library enables Pine Script developers to easily add pivot point detection to their scripts. It identifies significant price reversals by evaluating price movements against a minimum range threshold ( min_range_pct ) and confirming reversals based on a percentage ( reversal_pct ) of the prior trend’s magnitude. The library supports multiple simultaneous calls with different settings, making it ideal for multi-timeframe strategies.
How It Works:
The library’s f_calculatePivot function tracks price movements to detect pivot points:
Minimum Range Threshold : A potential pivot is considered if the price moves beyond the min_range_pct percentage of the current high (for a high pivot) or low (for a low pivot), ensuring sufficient movement.
Reversal Confirmation : A pivot is confirmed if the price reverses from the potential pivot by at least the reversal_pct percentage of the distance between the last confirmed pivot and the current potential pivot, measuring the retracement relative to the prior trend’s magnitude.
The function alternates between tracking highs (in an uptrend) and lows (in a downtrend), updating the trend when a pivot is confirmed.
State management uses an array of pivot_state objects, allowing independent calculations for different timeframes and min_range_pct values within the same script.
## Technical Reference
Functions:
f_calculatePivot(series float _high, series float _low, float _min_range_pct, float _reversal_pct) →
- Parameters:
_high : The high price series (e.g., high or math.max(open, close) ).
_low : The low price series (e.g., low or math.min(open, close) ).
_min_range_pct : The minimum percentage price movement to consider a potential pivot.
_reversal_pct : The percentage of the prior trend’s distance required to confirm a pivot.
- Returns:
A tuple containing:
isNewPivot : Boolean indicating if a new pivot was confirmed.
last_confirmed_pivot : The most recent confirmed pivot (type pivot ).
temp_pivot : The current temporary pivot (type pivot ).
Pivot type:
idx (series int) : Bar index of the pivot.
typ (series int) : Type of pivot ( PIVOT_HIGH or PIVOT_LOW ).
prc (series float) : Price of the pivot.
tme (series int) : Timestamp of the pivot.
Constants (internal):
TREND_LONG , TREND_SHORT : Trend direction indicators (1, -1).
PIVOT_HIGH , PIVOT_LOW : Pivot type indicators (1, -1).
✨ Example of Use:
//@version=5
indicator("Pivot Example", overlay=true)
import jal9000/pivots/1 as pivots
// Inputs
min_range_pct = input.float(20.0, 'Min Range %')
reversal_pct = input.float(30.0, 'Reversal %')
ignore_wick = input.bool(true, 'Ignore wick')
h = ignore_wick ? math.max(open, close) : high
l = ignore_wick ? math.min(open, close) : low
// Call the function with high, low, and input parameters
= pivots.f_calculatePivot(h, l, min_range_pct, reversal_pct)
// Variable to store previous confirmed pivot outside the function
var pivots.pivot prev_confirmed_pivot = na
// Draw the line if a new pivot is confirmed and previous pivot exists
if is_new_pivot
if not na(prev_confirmed_pivot) and not na(new_confirmed_pivot)
line.new(x1 = prev_confirmed_pivot.idx, y1 = prev_confirmed_pivot.prc, x2 = new_confirmed_pivot.idx, y2 = new_confirmed_pivot.prc, color = color.blue, width = 1)
prev_confirmed_pivot := new_confirmed_pivot
## Release Notes
v1
- Initial release of the pivots library with f_calculatePivot function for detecting pivot points and supporting multiple configurations and timeframes.
v2
- Code is Pinescript V6 ready. Remains identified as V5, but changing the version number is the only thing that is required to be v6.
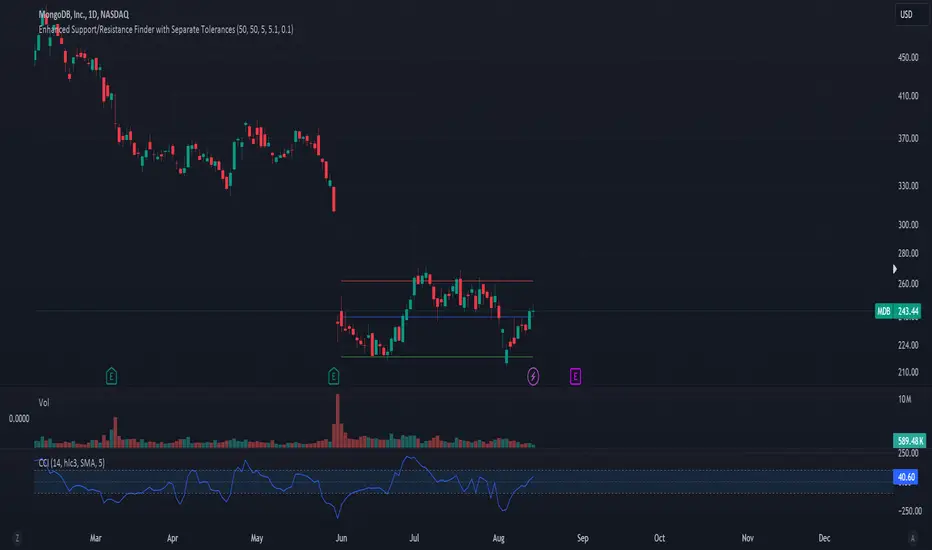
Dynamic S/R Zones Pro [By TraderMan]Dynamic S/R Zones Pro
Short pitch:
Dynamic S/R Zones Pro automatically maps support and resistance levels using pivot highs/lows and draws surrounding zones. It displays lines, labels and a table — making it fast to spot relevant price areas on your chart. 📊✨
🔎 What does this indicator do?
Detects pivot highs/lows and converts them into dynamic S/R levels.
Draws a zone around each level (upper & lower bands) so you can see the interaction area. 🟢🔴
Counts how often each level was tested and writes that “strength” in the table — so you can prioritize levels.
Fully configurable colors, line styles, zone width and table display. 🎛️
Note: Pivot-based S/R is a widely used, objective way to map price levels — see pivot basics.
Investopedia
⚙️ How it works (technical)
Uses pivotRange = 10 to search for highs/lows inside that window.
Looks back analysisPeriod (284 in your script) and selects meaningful pivots; filters by strengthSR threshold.
channelPercent and zonePercent define band thickness (zone), with zoneWidthPercent applied over the last 300 bars.
Strength = number of times price tested that band; used for filtering and the table.
High/Low Zones option draws wide reference bands around the period’s highest/lowest pivots.
(Pivot logic here is pivot-based SR mapping — not classical static pivot formulas, but the same principle of marking widely watched price levels.)
Investopedia
🛠️ How to use (step-by-step)
Enable SR: toggle S/R drawing on/off.
Strength (strengthSR): increase to show only well-tested levels, decrease to show more levels.
Line Style / Width: readability and aesthetics.
Show Zones / Zone Width %: enable zones and set width (e.g. 2% of recent range).
Show High/Low Zones: draw wide reference zones for the highest/lowest pivots.
Extend SR: extend lines across the chart (past/future) for clarity.
Show Table: display levels, zone boundaries and strength in the top-right table. 📋
🎯 Trade entry ideas (examples)
Not financial advice — examples of how traders commonly use S/R zones.
1) Bounce Long (support zone buy)
Condition: Price arrives at a support zone and shows a bullish confirmation candle (e.g., hammer, bullish engulfing).
Extra confirmation: oversold RSI or supportive volume.
Entry: on confirmed candle close (market or limit).
SL: slightly below the zone’s lower band.
TP: next resistance or target R:R ≥ 1:2. (Retest confirmations reduce false-breakout risk.)
fxopen.com
Investopedia
2) Breakout Long
Condition: Price breaks resistance with increased volume.
Tactic: wait for a retest of the broken resistance (now support). Enter on confirmation.
SL: below the retest low or zone lower band.
TP: next zone / predetermined R:R target. Breakouts need volume/retest confirmation to avoid fakeouts.
Investopedia
fxopen.com
3) Scalp
Use narrower zones, smaller TF, very tight SL and smaller R:R (e.g., 1:1), account for spreads/fees.
🛡️ Risk management
Don’t risk too much per trade — follow a fixed % (e.g., 1–2% max).
cmegroup.com
Plan SL & TP before entry; avoid emotional adjustments.
Investopedia
Calculate risk/reward; aim for a favorable R:R and backtest your rules.
CenterPoint Securities
✔️ Practical tips
Filter by strength to remove noisy levels.
Timeframe matters: higher TF = stronger levels.
Combine with other indicators (volume, RSI, MAs) for better confirmation.
Backtest the script and your entry rules before deploying live.
Quick summary: Dynamic S/R Zones Pro is a pivot-based S/R & zone mapper that highlights strong levels and helps you trade bounces, breakouts and retests — but always use SL/TP and solid risk management.
Investopedia
+2
Investopedia
+2
fxopen.com
Disclaimer: Not financial advice. Trading involves risk. 🔒

Supply & Demand MTF[E7T]This is not your average supply and demand tool. it’s a powerful, flexible indicator that helps traders spot high-probability opportunities by adapting to real-time market conditions. It uses a smart combination of volatility (ATR), volume, and price action to identify key zones where the market is likely to react. Perfect for scalpers and swing traders alike, this strategy brings together adaptive zone detection, trend bias (pivot line), two-tiered signals (S1 and S2), volume filtering, built-in Fibonacci targets, and even a debug mode for transparency and performance tracking.
KEY FEATURES
1. ADAPTIVE ZONE DETECTION; This feature highlights areas where price is likely to bounce or reversebullish demand zones and bearish supply zones. Instead of using fixed levels, it adjusts based on market volatility.
HOW IT WORKS:
Uses Average True Range (ATR) to measure volatility.
TWO MODES:
Low Volatility Mode: Makes zones tighter for calm markets.
High Volatility Mode: Expands zones during choppy or fast-moving conditions.
Plots red boxes for supply zones and blue for demand zones. Zones extend until broken or naturally expire.
WHY IT MATTERS: Traditional zone indicators often fall short in fast-changing conditions. This one adjusts automatically, helping you stay one step ahead.
EXAMPLE: On a 4H BTCUSD chart, a demand zone will form at a key support level and adjust its size depending on whether the market is quiet or volatile.
2. MARKET BIAS PIVOT LINE; This dynamic line helps you quickly see whether the market is trending up or down so you can trade in the direction of strength.
HOW IT WORKS:
Based on recent swing highs and lows (default: last 4 bars).
Line is green when price is above (bullish), red when below (bearish).
Updates live and can be turned on/off in settings.
WHY IT MATTERS: It’s a built-in trend filter. Use it to avoid fighting the market.
EXAMPLE: If SPY is above a green pivot and enters a demand zone, it’s a solid bullish setup.
3. DUAL ENTRY SIGNALS (S1 and S2) The strategy gives you two signal types depending on your risk style:
S1 SIGNALS: Early entry, based on basic confirmation (like a bullish engulfing pattern).
S2 SIGNALS: Stronger entry, requiring solid candle confirmation, volume spike, and close near the zone.
HOW IT WORKS:
S1 = good for aggressive traders or small size entries.
S2 = better for high-conviction trades and bigger position sizes.
Both signals follow your selected market mood (bullish or bearish).
WHY IT MATTERS: Flexibility! Most indicators only offer one signal style. This one gives you choice.
EXAMPLE: In EURUSD, S1 might show up when price taps a demand zone and forms a small bullish candle. If volume increases and the next candle closes strong, S2 confirms the entry.
4. VOLUME CONFIRMATION This filters out weak signals by checking for real buying/selling interest.
HOW IT WORKS:
Compares current volume to previous bar and a 10–14 bar average.
Adjustable volume thresholds for S1 and S2.
Can be disabled for markets with unreliable volume (like certain forex pairs).
WHY IT MATTERS: It adds a layer of quality control. High-volume moves usually mean higher conviction.
EXAMPLE: On AAPL, an S2 will only trigger if volume jumps by 1.3x the average, signaling strong seller presence.
5. BUILT-IN FIBONACCI TARGETS (TP1, TP2, SL) No more guessing exits. The strategy draws take profit (TP) and stop loss (SL) levels automatically based on zone size.
HOW IT WORKS:
TP1 = 2.12x the zone height
TP2 = 3.3x the zone height
SL = 1x the zone height (all adjustable)
These are shown as dashed (TP) and solid (SL) lines with labels
WHY IT MATTERS: Reduces emotional decision-making. Helps you plan trades with consistent risk/reward.
Example: In GOLD, if the demand zone is $20 tall, TP1 would be ~$42.40 higher, TP2 ~$66 higher, and SL $20 lower.
6. FULLY CUSTOMIZABLE INPUTS Tweak the settings to match your style and asset type.
KEY INPUTS:
Market Mood: Choose bullish (1) or bearish (2)
Timeframe Filter: Focus only on reliable zones (30M or 4H) or can disable to show on every timeframe
Zone Limit: Limit how many zones show (e.g., max 4)
Breakout Buffer: Defines how much price must move to break a zone
Zone Opacity: Make zones more/less visible
WHY IT MATTERS: This lets you dial in the indicator for scalping, swing trading, crypto, stocks, or forex.
Example: A scalper might use tighter zones and a low breakout buffer, while a swing trader prefers more zones and higher volatility mode.
7. DEBUG MODE (Optional) Get under the hood and see exactly how the strategy works.
HOW IT WORKS:
Shows metrics like ATR, volatility mode, memory usage, signal win rate, etc.
Plots visual lines showing zone age and success rate (TP1 hit tracking)
WHY IT MATTERS: Very few indicators show their math. This one does—great for power users who want to optimize.
EXAMPLE: You might discover that signals perform best in high volatility mode during news events, helping you adjust settings accordingly.
HOW TO USE IT
1. Add it to your TradingView chart (30M or 4H timeframes recommended).
2. Adjust inputs:
Market Mood = 1 (bullish) or 2 (bearish)
Pick your Volatility Mode
Set Zone Collector Limit (3–4 works well)
Use Timeframe Filter for better signals
3. Watch for S1 and S2:
S1 = quicker trades, lighter risk
S2 = stronger confirmation, bigger trades
4. Use the Pivot Line for trade direction.
5. Manage exits with auto TP/SL levels.
6. Turn on Debug Mode if you want detailed stats.
WORKS VERY WELL WITHOUT REPAINTING
Why It’s a Game-Changer; IT takes the guesswork out of zone trading. It’s not just smart—it’s adaptive. From volatility and volume to dynamic signals and exit plans, everything adjusts based on what the market is doing. And with a built-in trend filter and real-time debug info, it’s like having a trading co-pilot that’s always alert.
Why It’s Different Most zone indicators are basic. This one isn’t. Here’s why:
Adaptive zones that change with the market
Dual signal system (S1/S2) for flexibility
Volume confirmation to filter noise
Built-in Fibonacci targets for clean exits
Debug mode that shows you how it works
YOU CAN SET ALERTS WITHOUT repainting
THIS isn’t just another tool—it’s a smarter, more responsive way to trade.

Configurable Level Trading StrategyThe Dynamic Level Reversal Strategy is a trading approach designed to capitalize on price movements between key support and resistance levels. This strategy leverages configurable levels the trader determines, allowing for flexibility and adaptation to different market conditions.
Key Features:
Configurable Levels:
The strategy uses three key levels: Level 1 (Support), Level 2 (Middle), and Level 3 (Resistance). These levels can be adjusted directly within the script settings, making the strategy adaptable to various trading scenarios.
Buy and Sell Signals:
A buy signal is triggered when the price touches Level 1 and shows signs of reversal. The trader enters a position and sets an initial stop-loss just below Level 1.
As the price moves upward, the stop-loss is dynamically adjusted to just below Level 2 and Level 3, locking in profits while managing risk.
A sell signal is generated if the price reverses and crosses below the current stop-loss level, ensuring the trader exits the position with minimized losses.
Iterative Process:
The strategy allows for iterative trades, where the trader re-enters positions at Level 1 or Level 2 if the price revisits these levels, continually adjusting stop-losses and take-profit targets as the price oscillates between the defined levels.
Ideal Use Cases:
Range-Bound Markets: The strategy is particularly effective in markets where the price tends to oscillate between well-defined support and resistance levels.
Volatile Markets: The dynamic adjustment of stop-loss levels helps protect against sudden price reversals, making it suitable for volatile market conditions.
How to Use:
Set the desired levels (Level 1, Level 2, Level 3) based on your market analysis.
The script will automatically generate buy and sell signals, and adjust stop-loss levels as the price moves through the levels.
Monitor the signals and execute trades according to the strategy's guidelines.
ACD Indicator [TradingFinder] M Fisher Pivots Methodology Signal🔵 Introduction
The book "The Logical Trader" begins with a comprehensive review of the ACD Methodology principles, which include identifying specific price points related to the opening range.
This method allows you to set reference points for trading and use points "A" and "C" for trade entry. You will also learn about the "Pivot Range" and how to combine them with the ACD method to maximize position size and minimize risk.
In this indicator, the strategy is implemented to make it easier to use.
🔵 How to Use
The "ACD" strategy can be applied to various markets such as stocks, commodities, or forex, providing buy and sell signals that allow you to set your price targets and stop losses.
This strategy is based on the assumption that the opening range of trades is statistically significant each day, meaning the initial market fluctuations influence the market until the end of the day.
The ACD trading strategy is known as a breakout strategy and performs best in volatile or strongly trending markets, such as crude oil and stocks.
Some of the rules for using the ACD strategy include the following :
Consider points A and C as reference points and continuously pay attention to these points during trades. These points serve as entry and exit points for trades.
Examine daily and multi-day pivot ranges to analyze market trends. If the price is above the pivots, the trend is upward, and if below the pivots, the trend is downward.
Trading with the ACD strategy in forex is possible using the ACD indicator. This indicator is a technical tool used to measure the balance between supply and demand in the market. By analyzing trading volume and price, this indicator helps traders identify trend strength and suitable entry and exit points.
To use the ACD indicator, consider the following :
Identifying strong trends: The ACD indicator can help you identify strong and stable trends in the market.
Determining entry and exit points: ACD provides buy and sell signals to enter or exit trades at the best possible time.
Bullish Setup :
When the "A up" line is broken, it is advisable to wait for some time to ensure that this is not a "Fake Breakout" and that the price stabilizes above this line.
After entering the trade, the best stop loss you can choose is below the "A down" line. However, it is recommended to test this in backtests to achieve the best results. The suitable reward-to-risk ratio for this strategy is 1, which should also be backtested.
Bearish Setup :
When the "A down" line is broken, it is advisable to wait for some time to ensure that this is not a "Fake Breakout" and that the price stabilizes below this line.
After entering the trade, the best stop loss you can choose is above the "A up" line. However, it is recommended to test this in backtests to achieve the best results. The suitable reward-to-risk ratio for this strategy is 1, which should also be backtested.
🔵 Setting
NDay Pivot Range Period : Using this entry you can specify the number of days to calculate NDay Pivot Range.
Show Daily Pivot Range : Set the Daily Pivot color and displayed or not.
Show NDay Pivot Range : Set the NDay Pivot color and displayed or not.
ATR Period Levels : Determining the period of the ATR indicator, which is used to determine the A and C levels.
Show Tokyo ACD Setup : Set the Tokyo ACD Setup color and displayed or not.
Tokyo Opening Range Time : The amount of time taken to determine the opening range. You can set this number between 5 and 60 minutes.
Tokyo Session : Market start and end time.
A Level Multiplier : The coefficient that is multiplied by ATR to determine the distance of line A up and A down.
C Level Multiplier : The coefficient that is multiplied by ATR to determine the distance of line C up and C down.
The same settings exist for the London and New York sessions.

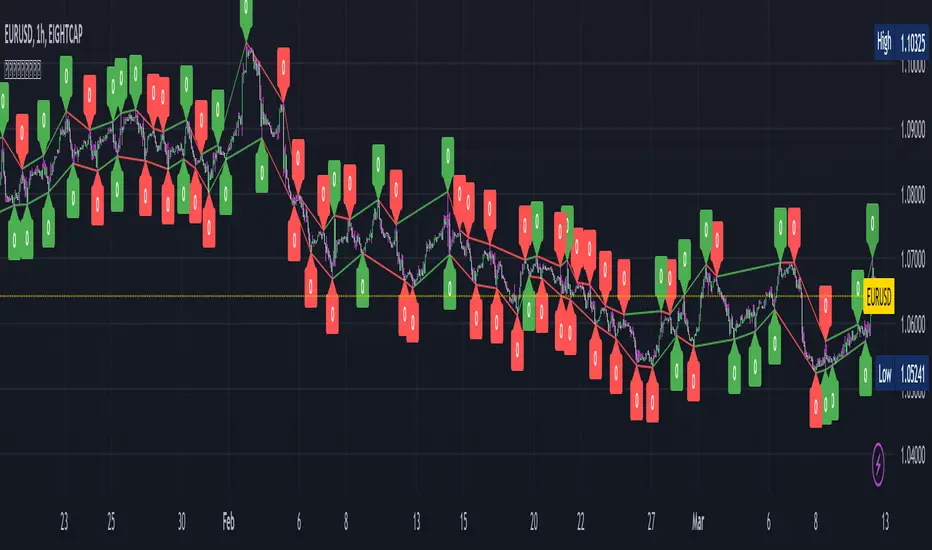
ZigZag Multi [TradingFinder] Trend & Wave Lines - Structures🔵 Introduction
"Zigzag" is an indicator that forms based on price changes. Essentially, the function of this indicator is to connect consecutive and alternating High and Low pivots. This pattern assists in analyzing price changes and can also be used to identify classic patterns. "Zigzag" is an analytical tool that, by filtering partial price movements based on the specified period, can identify price waves across different time frames (short or long term).
🔵 Reason for Creation
The combination of "short term zigzag" and "long term zigzag" enhances accuracy and reduces analysis time. In a time frame, "long term zigzag" represents the main trend, while "short term zigzag" depicts short-term waves.
🔵 How to Use
After selecting the desired time frame and adding "zigzag" to the chart, begin utilization. Keep in mind to identify the main market trend from "long term zigzag" and the minor waves from "short term zigzag".
🟣 Important: Additionally, classic patterns such as HH, LH, LL, and HL can be recognized. All traders analyzing financial markets using classic patterns and Elliot Waves can benefit from the "zigzag" indicator to facilitate their analysis.
🔵 Settings
Short term zigzag : In this section, you can adjust settings such as time frame range, display mode, color, and line width of the zigzag lines.
Short term label : This section allows you to activate or deactivate the display of zigzag labels according to your needs. You can also customize their color and size.
Long term zigzag : Here, you can adjust settings for time frame range, display mode, color, and line width of zigzag lines.
Long term label : Similar to short term label settings.
The recommended time frame for "long term zigzag" is between 9 to 15, and for "short term zigzag" is between 3 to 5.
🟣 Important Notes :
Considering the different behaviors of financial markets and various time frames, it is recommended to experiment with different time frame settings when using "zigzag" to find the best settings for each symbol and time frame, thereby preventing potential errors.
🟣 Terminology Explanations :
"HH": When the price is higher than the previous peak (Higher High).
"HL": When the price is higher than the previous low (Higher Low).
"LH": When the price is lower than the previous peak (Lower High).
"LL": When the price is lower than the previous low (Lower Low).

Smallest Swing [Truth Indie]This indicator is designed to test the smallest swing draw using the swing capture concept of the Pivot Points High Low indicator, setting the length to 1 for all periods, and combining it with price action that I think makes sense.
Example of a valid swing high.
Example of a valid swing low.

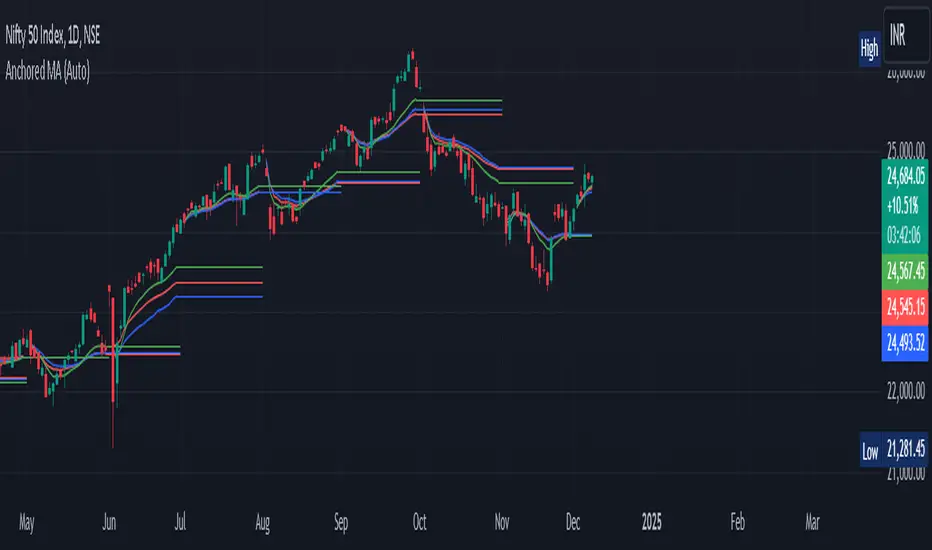
Anchored Moving Average By Market Mindset - Zero To EndlessAnchored Moving Average?
An anchored moving average (AMA) is created when you select a point on the chart and start calculating the moving average from there. Thus the moving average’s denominator is not fixed but cumulative and dynamic.
In this indicator, I've provided three different types of Anchored Moving Averages, viz., WMA, SMA and VWAP.
WMA is relevant if big moves are there.
SMA is relevant if volume data is not to be considered or if it is not available.
VWAP is the standard anchored MA, which is most commontly used. Is consider the volume data along with the price move.
In this indicator, Auto anchor is time based anchor. A trader can opt for Pivot Type Anchor or Volume Type Anchor or some higher resolution based anchor too. The length of the pivot lookback can also be changed by the user.
It can be used for intraday, swing trading and even for technical based investment purpose.
[JL] Supertrend Zone Pivot Point with zigzag fibThis is an open-source Pine script that generates a Supertrend Zone Pivot Point with Zigzag Fib indicator for TradingView. The indicator displays the Supertrend Zone, pivot points, and Fibonacci levels on the chart.
One of the unique features of this indicator is that it uses a Zigzag that does not repaint, ensuring accurate high and low points for the pivot points.
Another feature is that when the Supertrend is in an uptrend, only the highest points are taken as pivot points, and when it's in a downtrend, only the lowest points are taken as pivot points.
The Fibonacci levels are calculated based on the previous high and low pivot points, with labels displaying the corresponding levels on the chart.
The indicator also includes options to show/hide the Zigzag and Fibonacci levels.
Overall, this indicator is useful for identifying key pivot points and Fibonacci levels in the Supertrend Zone, providing valuable information for traders to make informed decisions.

RSI Trend Veracity (RSI TV)The RSI only plots itself between a high and a low value. It does not show its bullish/bearish sentiment.
The RSI TV shows the sentiment and helps anticipate the RSI trend but not the price trend.
When the Trend Veracity Line is in green, there is bullish sentiment. When it is in red, there is bearish sentiment.
The closer the lines get to their extremities, the more the current trend of the RSI is exhausted.
It works quite well even in choppy markets. See notes in the picture for more details.

Adaptive Rebound Line (ARL)The Adaptive Rebound Line (ARL) focuses on the rebound of price action according to the trend.
While it does not focus on showing the trend, it does help in anticipating price rebounds.
It achieves this by adapting quickly and by reducing lag.
It is recommended to use this with a trend-identifying indicator.
It was inspired by the Hull Moving Average and the KAMA.
Additional indicator show in the chart is Tide Finder Plus .

Pivot Points with Slopes - By Necromancer█ OVERVIEW
- This script draws array-based Pivot Points with the calculated slope on the next connecting point.
- The script works left to right, but could be be modified.
- Looks best with Label-Style on Diamonds, without Slope Text drawn.
█ Thank You!
- Many more to come which will utilize these fundamentals!
🅝🅔🅒🅡🅞🅜🅐🅝🅒🅔🅡
ViVen - EXP - Signals with AlertsHi Friends,
Here the trading made easy with Signals...
The main purpose of this indicator is to identify the Support and Resistance levels well in advance to make ourselves ready for the Entries with confidence..
With this indicator we will be able to identify the Market Structure and Trend to initiate our trades.
Multi Timeframe Concepts are considered in some cases to capture the Golden Zones.
Details of the Indicator:
Method of Trading – Intraday, Positional or Swing – Indices, Stocks and Commodity Markets
Golden Zones : When two or more indicator levels are confluences at one price point which will act as Strong Support and Resistance in the Market. That is called Golden Zone.
CPR & Pivot (Daily / Weekly / Monthly) – Based on the previous Timeframe values, it will automatically calculates the Support and Resistance values for the upcoming Sessions.
BUY / SELL Levels (W-Refers the Weekly levels) – Possible Reversal in the market we can expect at this price level. Depends on the Time frame (Daily/Weekly)
Bull BO / Bear BO (W-Refers the Weekly levels) – Possible Breakout level, If breakout happens price will move to reach the Target 1 and 2 Points based on which side the price breaks ( BULLISH / BEARISH ). We can initiate our BUY/SELL Entries.
Target 1 & Target 2 – Once the Price breaks the Breakout (Bull BO / Bear BO) levels, it will try to reach the Target Points where we can book our profits.
Tomorrow Levels - This will help us to enable the next day trading session Support and Resistance Levels in advance to do pre-analysis to prepare for the Entry and Exits.
Colored Candles : Lime Green and Violet colored candles will indicate the Possible Trend Reversals.
Triangles : Orange and Violet triangles will indicate the Confirmation of Trend Reversal.
BUY / SELL Signal – Considering the momentum and the Trend change it will suggest the possible entry time.
Dashboard :
1. Weekly Trend : This will indicate how the current week trend is going to be – Trending / Sideways
2. Today – Current Session expectation in the Market ( Bullish / Bearish )
3. Sentiment – Indicates the Traders mind set (Positive/Negative Side)
4. Range - This will indicate how the current Day trend is going to be – Trending / Sideways
5. MB / MA Trend – This identifies the major trend (Is the Stock / script in Up Trend or Down Trend)
6. Other Parameters – Will indicates the present situation in the market
7. RSI Values – This is to know and understand the momentum of the particular script
Levels Name Explanations:
1. DPP – Daily Pivot Point
2. WPP – Weekly Pivot Point
3. WTC – Weekly Top Central Pivot
4. WBC – Weekly Bottom Central Pivot
5. PDH – Previous Day High
6. PDL – Previous Day Low
7. PWH – Previous Week High
8. PWL – Previous Week Low
9. PMH – Previous Month High
10. PML - Previous Month Low
11. WR1, WR2 – Weekly Resistance Levels 1 & 2
12. WS1, WS2 – Weekly Support 1 & 2
13. 5m 200 EMA – 5 Minutes 200 Period Exponential Moving Average
14. 15m 200 EMA – 15 Minutes 200 Period Exponential Moving Average
15. 1H 200 EMA – 1 Hour 200 Period Exponential Moving Average
16. 1H 200 SMA – 1 Hour 100 Period Simple Moving Average
17. 1D 200 EMA – Daily TF 100 Period Exponential Moving Average
Settings:
To turn ON and OFF any of these levels if it does not require, Go to Indicator Settings and disable the specific levels.
Alerts:
You can enable the Buy / Sell signal Alerts by creating new alert.
To Access the Indicator:
If you want to know more about the indicator & to access for your trading please check the link in the signature below.
If you have any doubts please mention it in the comment section.
Looking forward your valuable comments and feedbacks to improve further in accuracy of our Trading.
Thanks!!

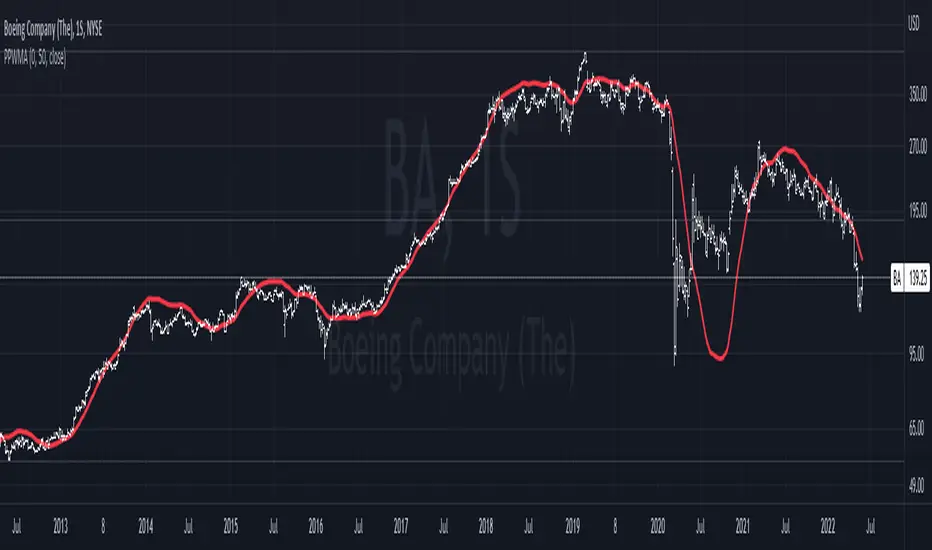
Pivot-Point Weighted Moving AverageThe Pivot-Point Weighted MA is very different from other weighted MAs, in the sense that the price weights can achieve negative values. For an example, if a length of 21 is used, the pivot point will be calculated as 13, meaning that the 13th prior candle will have 0 weight, and all prices before it will have a negative weight on the sum, so their impact is reversed rather than just unweighted.
The intent of this is to reduce lag by front-loading the prices. It works better in cyclic markets, and with a longer length, where the inflection point (the one with 0 weight) is aligned with the cyclic turn.
You can configure where the weight starts. If you leave it as 0, it will start with floor(length * 0.66) - 1.
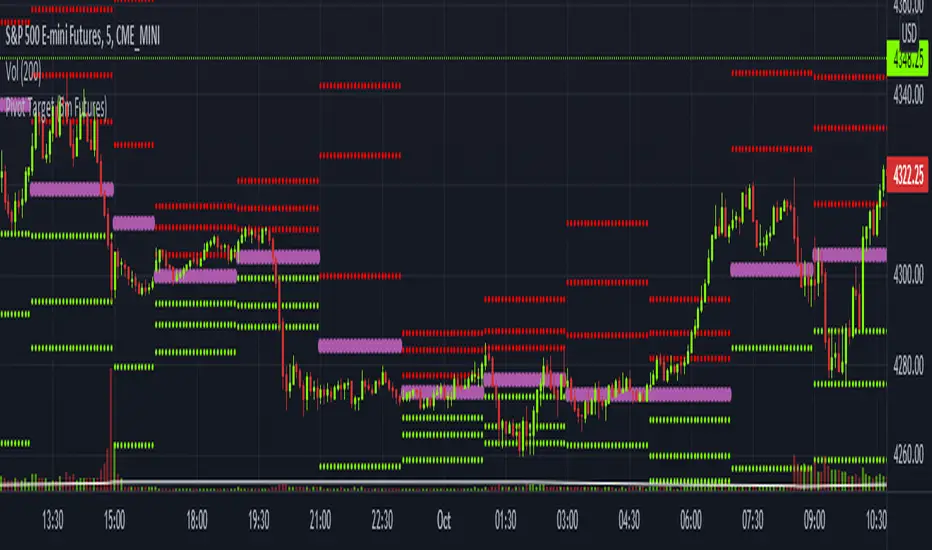
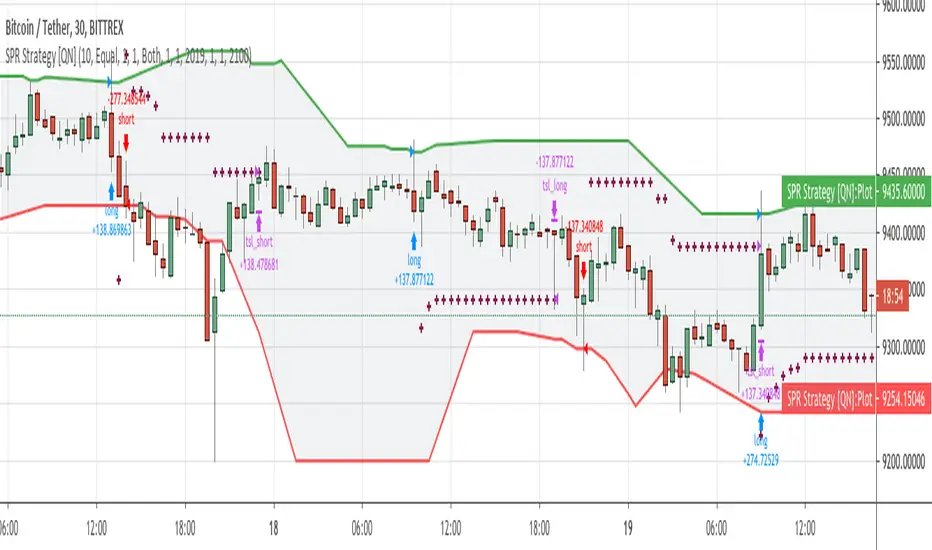
Pivot Target (5m Futures)I am new to both Futures Trading and Pivots. Looking for shorter-term profitable opportunities, I have investigated the use of pivots from a higher timeframe. All the work of this script is performed using two lines. It calculates the pivot from the previous 2-hour bar and draws this pivot line on the 5-minute timeframe. Many many times, the price will reach back to this pivot point - sometimes fairly quickly within the same horizontal pivot line and sometimes farther out (4-hours to 6-hours, or within the next few days). Price tends to reach the level around ninety percent of the time, making for plenty of short-term trading opportunities.
I get the best results when I see the price rise or fall from the pivot, along with a second indicator indicating a possible reversal (my favorite is Divergence for Many Indicators v4 by LonesomeTheBlue . Who knew divergence (both regular and hidden) was so common and useful for finding probable reversals? If I find the price above or below the pivot line with a second signal, I'll place a buy or sell within that same 2-hour window the price tends to return back to the higher timeframe pivot for a nice profit very quickly. Other times it does take a little longer to return with only a small percentage of time not returning within a reasonable amount of time, or very unusually, not at all. The image above shows a number of profitable trading opportunities using a combination of the Pivot Target and LonesomeTheBlue's Divergence for Many Indicators v4. You can further limit risk by only taking trades that are in the same direction of the overall trend, possibly confirmed on a higher timeframe.
This script will only be visible on the 5-minute timeframe the way it is written right now. I wouldn't suggest shorter or longer timeframes unless some editing is done by you. It doesn't seem to work as well with stocks, but is best on Futures due to the wave-like natures of the futures market. Trade safe, trade with the trend, use stops and limits appropriately and stay safe.
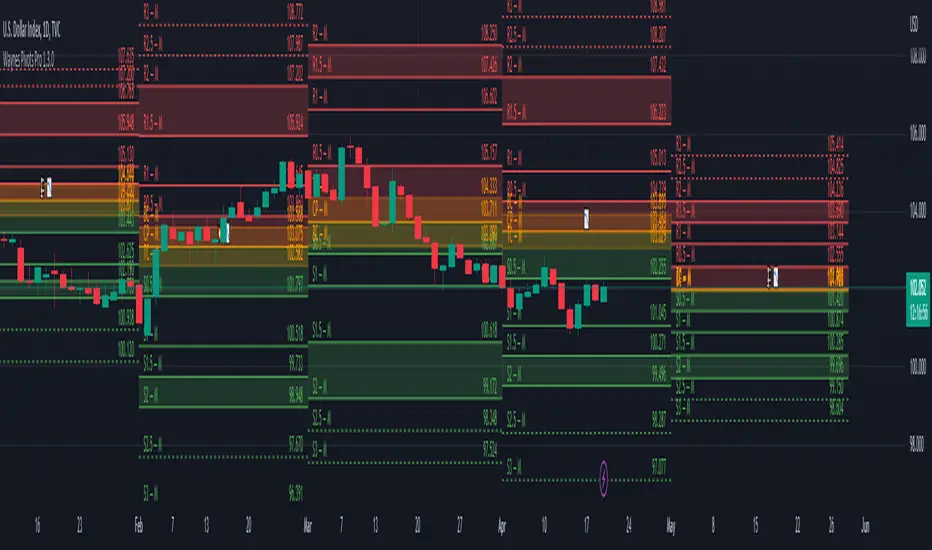
Wayne's Pivots ProThere is a public version of this indicator titled "Wayne's Pivots" if you would like to try out something similar to this indicator.
Wayne's Pivots Pro is named after Wayne McDonnel who came up with this indicator's pivot trading methodology. Wayne's Pivots are only one part of his methodology, but these pivots are the most critical part. They are frequently applied to supplement other trading methodologies as well. There are 3 key features that separate Wayne's Pivots specifically from every other pivot point indicator out there.
1. Midpoint Pivots
2. Biased Pivots
3. Next Period's Pivots
Understand that this indicator is supposed to be used, according to the methodology, alongside a fundamental bias. If you have not done fundamental research to know if you're a bull or bear on an asset, then you will likely not be using these pivots correctly. They do not tell you which direction the market will move. It tells you how far and how long a trade may go depending on which way you bias the pivots, and if your fundamental view was correct. This is trade planning tool for your entries and exits.
Breaking each point down:
1. Midpoint Pivots
If you take regular pivots (S#, R#), and get a histogram of every time price closed at or above each level, you generally end up with an even distribution. By adding midpoint levels you are doubling the amount of data, and increasing the resolution of the histogram. While these extra levels don't necessarily give us entries or exits, they do tell us when price doesn't quite reach a major support or resistance level. Midpoint pivot levels are calculated by finding the midpoint between each pivot level, and are labeled from the bottom up starting at M0 (Midpoint 0).
2. Biased Pivots
The traditional rules for trading pivot points are to buy support levels and sell resistance levels. In Wayne's methodology, we see pivots as a set for entries and take profits depending on our bias. It is known that trading the inverse of traditional pivot point rules that you can end up with a reasonable strategy. Biased pivots let us focus on only what matter to us by removing all other pivots, lines, and labels. Only showing us pivots useful to the bias we set.
For example, if you are a bull fundamentally you would set the bullish biased pivots. You would look for an entry in the area between the central pivot and second midpoint (M2), and an exit in the area between R2 and M4.
3. Next Period's Pivots
The third major feature of Wayne's Pivots are the "future" pivots. These are really calculated by taking the current HLC data and plotting it in realtime into the future before there's any data there. When we enter a new trading period, let say the day, we will have little data on the next day's pivots. As the current trading day goes on and gets closer to it's close, we start to see the next day's pivot points firm up. It's at this point that future pivots become actionable to create trading plans for the next day. The next period's pivots are exceptionally useful when scaled up to weekly, monthly, quarterly, and yearly timeframes. Daily, weekly, and monthly are the most commonly used within communities trading Wayne's methodology.
This is a completely rebuilt, professional use version of Wayne's Pivots. It includes many technical upgrades required by professional using Wayne's methodology. I released the original version publicly because it does not have many of the features here included in the Professional's version.
Features in Pro that are not in the public version:
Works on ALL timeframes.
Realtime pivot point updates.
Price levels on the pivots.
Extra pivots. (R3, M5, M0, S3)
All pivots start and end at the correct dates and times. (public version can't due to plot())
Easier to add more features!
Does this mean that you've abandoned the public version of Wayne's Pivots?
Absolutely not. Whenever there is a new feature in the Pro version, I always see if I can add it into the public one. It's just that the way it's built was not how I originally envisioned these pivots to be. If there's ever something that breaks the public version, I'm going to fix it because there's hundreds of people who use it.
I use the public version of Wayne's Pivots perfectly fine with my trading. Why switch to Pro?
Simply put, it's not going to give you the most accurate pivots that a professional would need. The pivots do not print properly on months with more or less than 30 days, and do their worst on short weeks. The public version has been like this ever since I first made it, and the only work around was to completely rebuild it. That's the major reason why I made the public version available to everyone in the first place. On top of all that, I can add way more features and customization options to these pivots than the public ones.
If I have a feature request will you try to implement it?
Absolutely! Some requests do have their limits, but don't be afraid to ask for something you really want. I'll try and implement lots of requested features as time goes on.
Daily Pivot (Fibonacci)Hello All
-
This is Daily Pivot (Fibonacci).
Simple and very useful tool for traders.
Show R5 to S5 levels.
.
Feel free to comment.
Thank you.
Rolling Traditional Pivot Points [QuantNomad]Standard Traditional Pivot Points are calculated from the previous day (or another period) close/low/high. But what is the day close for cryptocurrencies trading 24/7 on exchange? Does it make sense to use a specific time price as a close if it continue trading after that?
So I decided to solve that issue with Rolling Traditional Pivot Points where I calculate pivot points not at the end of the period but for every bar. Every time recalculating pivot points I look at a window of period length in bars and base my calculations on these bars. This way you get smooth pivot points changing with every bar and it seems like levels might be really nice support and resistance for the price.
I implemented 6 periods: Auto, Day, Week, Month, Quarter, Year. For the Auto period, I select the most suitable period for the timeframe of your chart.
On the chart, you can see by default up to 11 levels plotted
PP – Pivot Point
S1, S2, S3, S4, S5 - Support Levels
R1, R2, R3, R4, R5 - Resistance Levels
####################
Disclaimer
Please remember that past performance may not be indicative of future results.
Due to various factors, including changing market conditions, the strategy may no longer perform as good as in historical backtesting.
This post and the script don’t provide any financial advice.
####################
It's a pro indicator, you can have access to it for a small fee.
To request access to this indicator - follow the "Pro Indicators" link in my signature on PM me.

Smoothed Pivot Reversal Alerts [QuantNomad]This is study with alerts for my "Smoothed Pivot Reversal Strategy". Strategy script is open to the public so you can use it freely.
When creating alerts - choose "Once Per Bar Close"
It's a pro indicator, you can have access to it for a small fee. Link to my PRO indicators you can find in my signature.

Smoothed Pivot Reversal Strategy [QuantNomad]With this strategy trying to rethink the standard pivot reversal strategy.
Don't like the idea that for 10/10 pivot you have to wait for 10points to confirm it. So I used multiple pivot levels and calculated the average line. This way when we have a new high level approaching it smoothly.
This way you can have a bit better price for entries but the risk of fake entries bit bigger as well.
I'm using the usual trailing stop loss as an exit for this strategy.
Parameters for this strategy is pretty simple:
Left/Right bars for pivot points.
Additional smoothing - you can additionally smooth pivot lines with EMA
% for Traling SL
BEST Pivots CloudHello traders,
This script is an adaption of an FXCM indicator called Pivots Cloud
Takes in input two timeframes, build the pivots based on them and fill the space between those pivots
Should be non-repainting
Best
Dave
