MomentumIndicatorsLibrary "MomentumIndicators"
This is a library of 'Momentum Indicators', also denominated as oscillators.
The purpose of this library is to organize momentum indicators in just one place, making it easy to access.
In addition, it aims to allow customized versions, not being restricted to just the price value.
An example of this use case is the popular Stochastic RSI.
# Indicators:
1. Relative Strength Index (RSI):
Measures the relative strength of recent price gains to recent price losses of an asset.
2. Rate of Change (ROC):
Measures the percentage change in price of an asset over a specified time period.
3. Stochastic Oscillator (Stoch):
Compares the current price of an asset to its price range over a specified time period.
4. True Strength Index (TSI):
Measures the price change, calculating the ratio of the price change (positive or negative) in relation to the
absolute price change.
The values of both are smoothed twice to reduce noise, and the final result is normalized
in a range between 100 and -100.
5. Stochastic Momentum Index (SMI):
Combination of the True Strength Index with a signal line to help identify turning points in the market.
6. Williams Percent Range (Williams %R):
Compares the current price of an asset to its highest high and lowest low over a specified time period.
7. Commodity Channel Index (CCI):
Measures the relationship between an asset's current price and its moving average.
8. Ultimate Oscillator (UO):
Combines three different time periods to help identify possible reversal points.
9. Moving Average Convergence/Divergence (MACD):
Shows the difference between short-term and long-term exponential moving averages.
10. Fisher Transform (FT):
Normalize prices into a Gaussian normal distribution.
11. Inverse Fisher Transform (IFT):
Transform the values of the Fisher Transform into a smaller and more easily interpretable scale is through the
application of an inverse transformation to the hyperbolic tangent function.
This transformation takes the values of the FT, which range from -infinity to +infinity, to a scale limited
between -1 and +1, allowing them to be more easily visualized and compared.
12. Premier Stochastic Oscillator (PSO):
Normalizes the standard stochastic oscillator by applying a five-period double exponential smoothing average of
the %K value, resulting in a symmetric scale of 1 to -1
# Indicators of indicators:
## Stochastic:
1. Stochastic of RSI (Relative Strengh Index)
2. Stochastic of ROC (Rate of Change)
3. Stochastic of UO (Ultimate Oscillator)
4. Stochastic of TSI (True Strengh Index)
5. Stochastic of Williams R%
6. Stochastic of CCI (Commodity Channel Index).
7. Stochastic of MACD (Moving Average Convergence/Divergence)
8. Stochastic of FT (Fisher Transform)
9. Stochastic of Volume
10. Stochastic of MFI (Money Flow Index)
11. Stochastic of On OBV (Balance Volume)
12. Stochastic of PVI (Positive Volume Index)
13. Stochastic of NVI (Negative Volume Index)
14. Stochastic of PVT (Price-Volume Trend)
15. Stochastic of VO (Volume Oscillator)
16. Stochastic of VROC (Volume Rate of Change)
## Inverse Fisher Transform:
1.Inverse Fisher Transform on RSI (Relative Strengh Index)
2.Inverse Fisher Transform on ROC (Rate of Change)
3.Inverse Fisher Transform on UO (Ultimate Oscillator)
4.Inverse Fisher Transform on Stochastic
5.Inverse Fisher Transform on TSI (True Strength Index)
6.Inverse Fisher Transform on CCI (Commodity Channel Index)
7.Inverse Fisher Transform on Fisher Transform (FT)
8.Inverse Fisher Transform on MACD (Moving Average Convergence/Divergence)
9.Inverse Fisher Transfor on Williams R% (Williams Percent Range)
10.Inverse Fisher Transfor on CMF (Chaikin Money Flow)
11.Inverse Fisher Transform on VO (Volume Oscillator)
12.Inverse Fisher Transform on VROC (Volume Rate of Change)
## Stochastic Momentum Index:
1.Stochastic Momentum Index of RSI (Relative Strength Index)
2.Stochastic Momentum Index of ROC (Rate of Change)
3.Stochastic Momentum Index of VROC (Volume Rate of Change)
4.Stochastic Momentum Index of Williams R% (Williams Percent Range)
5.Stochastic Momentum Index of FT (Fisher Transform)
6.Stochastic Momentum Index of CCI (Commodity Channel Index)
7.Stochastic Momentum Index of UO (Ultimate Oscillator)
8.Stochastic Momentum Index of MACD (Moving Average Convergence/Divergence)
9.Stochastic Momentum Index of Volume
10.Stochastic Momentum Index of MFI (Money Flow Index)
11.Stochastic Momentum Index of CMF (Chaikin Money Flow)
12.Stochastic Momentum Index of On Balance Volume (OBV)
13.Stochastic Momentum Index of Price-Volume Trend (PVT)
14.Stochastic Momentum Index of Volume Oscillator (VO)
15.Stochastic Momentum Index of Positive Volume Index (PVI)
16.Stochastic Momentum Index of Negative Volume Index (NVI)
## Relative Strength Index:
1. RSI for Volume
2. RSI for Moving Average
rsi(source, length)
RSI (Relative Strengh Index). Measures the relative strength of recent price gains to recent price losses of an asset.
Parameters:
source : (float) Source of series (close, high, low, etc.)
length : (int) Period of loopback
Returns: (float) Series of RSI
roc(source, length)
ROC (Rate of Change). Measures the percentage change in price of an asset over a specified time period.
Parameters:
source : (float) Source of series (close, high, low, etc.)
length : (int) Period of loopback
Returns: (float) Series of ROC
stoch(kLength, kSmoothing, dSmoothing, maTypeK, maTypeD, almaOffsetKD, almaSigmaKD, lsmaOffSetKD)
Stochastic Oscillator. Compares the current price of an asset to its price range over a specified time period.
Parameters:
kLength
kSmoothing : (int) Period for smoothig stochastic
dSmoothing : (int) Period for signal (moving average of stochastic)
maTypeK : (int) Type of Moving Average for Stochastic Oscillator
maTypeD : (int) Type of Moving Average for Stochastic Oscillator Signal
almaOffsetKD : (float) Offset for Arnaud Legoux Moving Average for Oscillator and Signal
almaSigmaKD : (float) Sigma for Arnaud Legoux Moving Average for Oscillator and Signal
lsmaOffSetKD : (int) Offset for Least Squares Moving Average for Oscillator and Signal
Returns: A tuple of Stochastic Oscillator and Moving Average of Stochastic Oscillator
stoch(source, kLength, kSmoothing, dSmoothing, maTypeK, maTypeD, almaOffsetKD, almaSigmaKD, lsmaOffSetKD)
Stochastic Oscillator. Customized source. Compares the current price of an asset to its price range over a specified time period.
Parameters:
source : (float) Source of series (close, high, low, etc.)
kLength : (int) Period of loopback to calculate the stochastic
kSmoothing : (int) Period for smoothig stochastic
dSmoothing : (int) Period for signal (moving average of stochastic)
maTypeK : (int) Type of Moving Average for Stochastic Oscillator
maTypeD : (int) Type of Moving Average for Stochastic Oscillator Signal
almaOffsetKD : (float) Offset for Arnaud Legoux Moving Average for Stoch and Signal
almaSigmaKD : (float) Sigma for Arnaud Legoux Moving Average for Stoch and Signal
lsmaOffSetKD : (int) Offset for Least Squares Moving Average for Stoch and Signal
Returns: A tuple of Stochastic Oscillator and Moving Average of Stochastic Oscillator
tsi(source, shortLength, longLength, maType, almaOffset, almaSigma, lsmaOffSet)
TSI (True Strengh Index). Measures the price change, calculating the ratio of the price change (positive or negative) in relation to the absolute price change.
The values of both are smoothed twice to reduce noise, and the final result is normalized in a range between 100 and -100.
Parameters:
source : (float) Source of series (close, high, low, etc.)
shortLength : (int) Short length
longLength : (int) Long length
maType : (int) Type of Moving Average for TSI
almaOffset : (float) Offset for Arnaud Legoux Moving Average
almaSigma : (float) Sigma for Arnaud Legoux Moving Average
lsmaOffSet : (int) Offset for Least Squares Moving Average
Returns: (float) TSI
smi(sourceTSI, shortLengthTSI, longLengthTSI, maTypeTSI, almaOffsetTSI, almaSigmaTSI, lsmaOffSetTSI, maTypeSignal, smoothingLengthSignal, almaOffsetSignal, almaSigmaSignal, lsmaOffSetSignal)
SMI (Stochastic Momentum Index). A TSI (True Strengh Index) plus a signal line.
Parameters:
sourceTSI : (float) Source of series for TSI (close, high, low, etc.)
shortLengthTSI : (int) Short length for TSI
longLengthTSI : (int) Long length for TSI
maTypeTSI : (int) Type of Moving Average for Signal of TSI
almaOffsetTSI : (float) Offset for Arnaud Legoux Moving Average
almaSigmaTSI : (float) Sigma for Arnaud Legoux Moving Average
lsmaOffSetTSI : (int) Offset for Least Squares Moving Average
maTypeSignal
smoothingLengthSignal
almaOffsetSignal
almaSigmaSignal
lsmaOffSetSignal
Returns: A tuple with TSI, signal of TSI and histogram of difference
wpr(source, length)
Williams R% (Williams Percent Range). Compares the current price of an asset to its highest high and lowest low over a specified time period.
Parameters:
source : (float) Source of series (close, high, low, etc.)
length : (int) Period of loopback
Returns: (float) Series of Williams R%
cci(source, length, maType, almaOffset, almaSigma, lsmaOffSet)
CCI (Commodity Channel Index). Measures the relationship between an asset's current price and its moving average.
Parameters:
source : (float) Source of series (close, high, low, etc.)
length : (int) Period of loopback
maType : (int) Type of Moving Average
almaOffset : (float) Offset for Arnaud Legoux Moving Average
almaSigma : (float) Sigma for Arnaud Legoux Moving Average
lsmaOffSet : (int) Offset for Least Squares Moving Average
Returns: (float) Series of CCI
ultimateOscillator(fastLength, middleLength, slowLength)
UO (Ultimate Oscilator). Combines three different time periods to help identify possible reversal points.
Parameters:
fastLength : (int) Fast period of loopback
middleLength : (int) Middle period of loopback
slowLength : (int) Slow period of loopback
Returns: (float) Series of Ultimate Oscilator
ultimateOscillator(source, fastLength, middleLength, slowLength)
UO (Ultimate Oscilator). Customized source. Combines three different time periods to help identify possible reversal points.
Parameters:
source : (float) Source of series (close, high, low, etc.)
fastLength : (int) Fast period of loopback
middleLength : (int) Middle period of loopback
slowLength : (int) Slow period of loopback
Returns: (float) Series of Ultimate Oscilator
macd(source, fastLength, slowLength, signalLength, maTypeFast, maTypeSlow, maTypeMACD, almaOffset, almaSigma, lsmaOffSet)
MACD (Moving Average Convergence/Divergence). Shows the difference between short-term and long-term exponential moving averages.
Parameters:
source : (float) Source of series (close, high, low, etc.)
fastLength : (int) Period for fast moving average
slowLength : (int) Period for slow moving average
signalLength : (int) Signal length
maTypeFast : (int) Type of fast moving average
maTypeSlow : (int) Type of slow moving average
maTypeMACD : (int) Type of MACD moving average
almaOffset : (float) Offset for Arnaud Legoux Moving Average
almaSigma : (float) Sigma for Arnaud Legoux Moving Average
lsmaOffSet : (int) Offset for Least Squares Moving Average
Returns: A tuple with MACD, Signal, and Histgram
fisher(length)
Fisher Transform. Normalize prices into a Gaussian normal distribution.
Parameters:
length
Returns: A tuple with Fisher Transform and signal
fisher(source, length)
Fisher Transform. Customized source. Normalize prices into a Gaussian normal distribution.
Parameters:
source : (float) Source of series (close, high, low, etc.)
length
Returns: A tuple with Fisher Transform and signal
inverseFisher(source, length, subtrahend, denominator)
Inverse Fisher Transform.
Transform the values of the Fisher Transform into a smaller and more easily interpretable scale is
through the application of an inverse transformation to the hyperbolic tangent function.
This transformation takes the values of the FT, which range from -infinity to +infinity,
to a scale limited between -1 and +1, allowing them to be more easily visualized and compared.
Parameters:
source : (float) Source of series (close, high, low, etc.)
length : (int) Period for loopback
subtrahend : (int) Denominator. Useful in unbounded indicators. For example, in CCI.
denominator
Returns: (float) Series of Inverse Fisher Transform
premierStoch(length, smoothlen)
Premier Stochastic Oscillator (PSO).
Normalizes the standard stochastic oscillator by applying a five-period double exponential smoothing
average of the %K value, resulting in a symmetric scale of 1 to -1.
Parameters:
length : (int) Period for loopback
smoothlen : (int) Period for smoothing
Returns: (float) Series of PSO
premierStoch(source, smoothlen, subtrahend, denominator)
Premier Stochastic Oscillator (PSO) of custom source.
Normalizes the source by applying a five-period double exponential smoothing average.
Parameters:
source : (float) Source of series (close, high, low, etc.)
smoothlen : (int) Period for smoothing
subtrahend : (int) Denominator. Useful in unbounded indicators. For example, in CCI.
denominator
Returns: (float) Series of PSO
stochRsi(sourceRSI, lengthRSI, kLength, kSmoothing, dSmoothing, maTypeK, maTypeD, almaOffsetKD, almaSigmaKD, lsmaOffSetKD)
Parameters:
sourceRSI
lengthRSI
kLength
kSmoothing
dSmoothing
maTypeK
maTypeD
almaOffsetKD
almaSigmaKD
lsmaOffSetKD
stochRoc(sourceROC, lengthROC, kLength, kSmoothing, dSmoothing, maTypeK, maTypeD, almaOffsetKD, almaSigmaKD, lsmaOffSetKD)
Parameters:
sourceROC
lengthROC
kLength
kSmoothing
dSmoothing
maTypeK
maTypeD
almaOffsetKD
almaSigmaKD
lsmaOffSetKD
stochUO(fastLength, middleLength, slowLength, kLength, kSmoothing, dSmoothing, maTypeK, maTypeD, almaOffsetKD, almaSigmaKD, lsmaOffSetKD)
Parameters:
fastLength
middleLength
slowLength
kLength
kSmoothing
dSmoothing
maTypeK
maTypeD
almaOffsetKD
almaSigmaKD
lsmaOffSetKD
stochTSI(source, shortLength, longLength, maType, almaOffset, almaSigma, lsmaOffSet, kLength, kSmoothing, dSmoothing, maTypeK, maTypeD, almaOffsetKD, almaSigmaKD, lsmaOffSetKD)
Parameters:
source
shortLength
longLength
maType
almaOffset
almaSigma
lsmaOffSet
kLength
kSmoothing
dSmoothing
maTypeK
maTypeD
almaOffsetKD
almaSigmaKD
lsmaOffSetKD
stochWPR(source, length, kLength, kSmoothing, dSmoothing, maTypeK, maTypeD, almaOffsetKD, almaSigmaKD, lsmaOffSetKD)
Parameters:
source
length
kLength
kSmoothing
dSmoothing
maTypeK
maTypeD
almaOffsetKD
almaSigmaKD
lsmaOffSetKD
stochCCI(source, length, maType, almaOffset, almaSigma, lsmaOffSet, kLength, kSmoothing, dSmoothing, maTypeK, maTypeD, almaOffsetKD, almaSigmaKD, lsmaOffSetKD)
Parameters:
source
length
maType
almaOffset
almaSigma
lsmaOffSet
kLength
kSmoothing
dSmoothing
maTypeK
maTypeD
almaOffsetKD
almaSigmaKD
lsmaOffSetKD
stochMACD(source, fastLength, slowLength, signalLength, maTypeFast, maTypeSlow, maTypeMACD, almaOffset, almaSigma, lsmaOffSet, kLength, kSmoothing, dSmoothing, maTypeK, maTypeD, almaOffsetKD, almaSigmaKD, lsmaOffSetKD)
Parameters:
source
fastLength
slowLength
signalLength
maTypeFast
maTypeSlow
maTypeMACD
almaOffset
almaSigma
lsmaOffSet
kLength
kSmoothing
dSmoothing
maTypeK
maTypeD
almaOffsetKD
almaSigmaKD
lsmaOffSetKD
stochFT(length, kLength, kSmoothing, dSmoothing, maTypeK, maTypeD, almaOffsetKD, almaSigmaKD, lsmaOffSetKD)
Parameters:
length
kLength
kSmoothing
dSmoothing
maTypeK
maTypeD
almaOffsetKD
almaSigmaKD
lsmaOffSetKD
stochVolume(kLength, kSmoothing, dSmoothing, maTypeK, maTypeD, almaOffsetKD, almaSigmaKD, lsmaOffSetKD)
Parameters:
kLength
kSmoothing
dSmoothing
maTypeK
maTypeD
almaOffsetKD
almaSigmaKD
lsmaOffSetKD
stochMFI(source, length, kLength, kSmoothing, dSmoothing, maTypeK, maTypeD, almaOffsetKD, almaSigmaKD, lsmaOffSetKD)
Parameters:
source
length
kLength
kSmoothing
dSmoothing
maTypeK
maTypeD
almaOffsetKD
almaSigmaKD
lsmaOffSetKD
stochOBV(source, kLength, kSmoothing, dSmoothing, maTypeK, maTypeD, almaOffsetKD, almaSigmaKD, lsmaOffSetKD)
Parameters:
source
kLength
kSmoothing
dSmoothing
maTypeK
maTypeD
almaOffsetKD
almaSigmaKD
lsmaOffSetKD
stochPVI(source, kLength, kSmoothing, dSmoothing, maTypeK, maTypeD, almaOffsetKD, almaSigmaKD, lsmaOffSetKD)
Parameters:
source
kLength
kSmoothing
dSmoothing
maTypeK
maTypeD
almaOffsetKD
almaSigmaKD
lsmaOffSetKD
stochNVI(source, kLength, kSmoothing, dSmoothing, maTypeK, maTypeD, almaOffsetKD, almaSigmaKD, lsmaOffSetKD)
Parameters:
source
kLength
kSmoothing
dSmoothing
maTypeK
maTypeD
almaOffsetKD
almaSigmaKD
lsmaOffSetKD
stochPVT(source, kLength, kSmoothing, dSmoothing, maTypeK, maTypeD, almaOffsetKD, almaSigmaKD, lsmaOffSetKD)
Parameters:
source
kLength
kSmoothing
dSmoothing
maTypeK
maTypeD
almaOffsetKD
almaSigmaKD
lsmaOffSetKD
stochVO(shortLen, longLen, maType, almaOffset, almaSigma, lsmaOffSet, kLength, kSmoothing, dSmoothing, maTypeK, maTypeD, almaOffsetKD, almaSigmaKD, lsmaOffSetKD)
Parameters:
shortLen
longLen
maType
almaOffset
almaSigma
lsmaOffSet
kLength
kSmoothing
dSmoothing
maTypeK
maTypeD
almaOffsetKD
almaSigmaKD
lsmaOffSetKD
stochVROC(length, kLength, kSmoothing, dSmoothing, maTypeK, maTypeD, almaOffsetKD, almaSigmaKD, lsmaOffSetKD)
Parameters:
length
kLength
kSmoothing
dSmoothing
maTypeK
maTypeD
almaOffsetKD
almaSigmaKD
lsmaOffSetKD
iftRSI(sourceRSI, lengthRSI, lengthIFT)
Parameters:
sourceRSI
lengthRSI
lengthIFT
iftROC(sourceROC, lengthROC, lengthIFT)
Parameters:
sourceROC
lengthROC
lengthIFT
iftUO(fastLength, middleLength, slowLength, lengthIFT)
Parameters:
fastLength
middleLength
slowLength
lengthIFT
iftStoch(kLength, kSmoothing, dSmoothing, maTypeK, maTypeD, almaOffsetKD, almaSigmaKD, lsmaOffSetKD, lengthIFT)
Parameters:
kLength
kSmoothing
dSmoothing
maTypeK
maTypeD
almaOffsetKD
almaSigmaKD
lsmaOffSetKD
lengthIFT
iftTSI(source, shortLength, longLength, maType, almaOffset, almaSigma, lsmaOffSet, lengthIFT)
Parameters:
source
shortLength
longLength
maType
almaOffset
almaSigma
lsmaOffSet
lengthIFT
iftCCI(source, length, maType, almaOffset, almaSigma, lsmaOffSet, lengthIFT)
Parameters:
source
length
maType
almaOffset
almaSigma
lsmaOffSet
lengthIFT
iftFisher(length, lengthIFT)
Parameters:
length
lengthIFT
iftMACD(source, fastLength, slowLength, signalLength, maTypeFast, maTypeSlow, maTypeMACD, almaOffset, almaSigma, lsmaOffSet, lengthIFT)
Parameters:
source
fastLength
slowLength
signalLength
maTypeFast
maTypeSlow
maTypeMACD
almaOffset
almaSigma
lsmaOffSet
lengthIFT
iftWPR(source, length, lengthIFT)
Parameters:
source
length
lengthIFT
iftMFI(source, length, lengthIFT)
Parameters:
source
length
lengthIFT
iftCMF(length, lengthIFT)
Parameters:
length
lengthIFT
iftVO(shortLen, longLen, maType, almaOffset, almaSigma, lsmaOffSet, lengthIFT)
Parameters:
shortLen
longLen
maType
almaOffset
almaSigma
lsmaOffSet
lengthIFT
iftVROC(length, lengthIFT)
Parameters:
length
lengthIFT
smiRSI(source, length, shortLengthTSI, longLengthTSI, maTypeTSI, almaOffsetTSI, almaSigmaTSI, lsmaOffSetTSI, maTypeSignal, smoothingLengthSignal, almaOffsetSignal, almaSigmaSignal, lsmaOffSetSignal)
Parameters:
source
length
shortLengthTSI
longLengthTSI
maTypeTSI
almaOffsetTSI
almaSigmaTSI
lsmaOffSetTSI
maTypeSignal
smoothingLengthSignal
almaOffsetSignal
almaSigmaSignal
lsmaOffSetSignal
smiROC(source, length, shortLengthTSI, longLengthTSI, maTypeTSI, almaOffsetTSI, almaSigmaTSI, lsmaOffSetTSI, maTypeSignal, smoothingLengthSignal, almaOffsetSignal, almaSigmaSignal, lsmaOffSetSignal)
Parameters:
source
length
shortLengthTSI
longLengthTSI
maTypeTSI
almaOffsetTSI
almaSigmaTSI
lsmaOffSetTSI
maTypeSignal
smoothingLengthSignal
almaOffsetSignal
almaSigmaSignal
lsmaOffSetSignal
smiVROC(length, shortLengthTSI, longLengthTSI, maTypeTSI, almaOffsetTSI, almaSigmaTSI, lsmaOffSetTSI, maTypeSignal, smoothingLengthSignal, almaOffsetSignal, almaSigmaSignal, lsmaOffSetSignal)
Parameters:
length
shortLengthTSI
longLengthTSI
maTypeTSI
almaOffsetTSI
almaSigmaTSI
lsmaOffSetTSI
maTypeSignal
smoothingLengthSignal
almaOffsetSignal
almaSigmaSignal
lsmaOffSetSignal
smiWPR(source, length, shortLengthTSI, longLengthTSI, maTypeTSI, almaOffsetTSI, almaSigmaTSI, lsmaOffSetTSI, maTypeSignal, smoothingLengthSignal, almaOffsetSignal, almaSigmaSignal, lsmaOffSetSignal)
Parameters:
source
length
shortLengthTSI
longLengthTSI
maTypeTSI
almaOffsetTSI
almaSigmaTSI
lsmaOffSetTSI
maTypeSignal
smoothingLengthSignal
almaOffsetSignal
almaSigmaSignal
lsmaOffSetSignal
smiFT(length, shortLengthTSI, longLengthTSI, maTypeTSI, almaOffsetTSI, almaSigmaTSI, lsmaOffSetTSI, maTypeSignal, smoothingLengthSignal, almaOffsetSignal, almaSigmaSignal, lsmaOffSetSignal)
Parameters:
length
shortLengthTSI
longLengthTSI
maTypeTSI
almaOffsetTSI
almaSigmaTSI
lsmaOffSetTSI
maTypeSignal
smoothingLengthSignal
almaOffsetSignal
almaSigmaSignal
lsmaOffSetSignal
smiFT(source, length, shortLengthTSI, longLengthTSI, maTypeTSI, almaOffsetTSI, almaSigmaTSI, lsmaOffSetTSI, maTypeSignal, smoothingLengthSignal, almaOffsetSignal, almaSigmaSignal, lsmaOffSetSignal)
Parameters:
source
length
shortLengthTSI
longLengthTSI
maTypeTSI
almaOffsetTSI
almaSigmaTSI
lsmaOffSetTSI
maTypeSignal
smoothingLengthSignal
almaOffsetSignal
almaSigmaSignal
lsmaOffSetSignal
smiCCI(source, length, maTypeCCI, almaOffsetCCI, almaSigmaCCI, lsmaOffSetCCI, shortLengthTSI, longLengthTSI, maTypeTSI, almaOffsetTSI, almaSigmaTSI, lsmaOffSetTSI, maTypeSignal, smoothingLengthSignal, almaOffsetSignal, almaSigmaSignal, lsmaOffSetSignal)
Parameters:
source
length
maTypeCCI
almaOffsetCCI
almaSigmaCCI
lsmaOffSetCCI
shortLengthTSI
longLengthTSI
maTypeTSI
almaOffsetTSI
almaSigmaTSI
lsmaOffSetTSI
maTypeSignal
smoothingLengthSignal
almaOffsetSignal
almaSigmaSignal
lsmaOffSetSignal
smiUO(fastLength, middleLength, slowLength, shortLengthTSI, longLengthTSI, maTypeTSI, almaOffsetTSI, almaSigmaTSI, lsmaOffSetTSI, maTypeSignal, smoothingLengthSignal, almaOffsetSignal, almaSigmaSignal, lsmaOffSetSignal)
Parameters:
fastLength
middleLength
slowLength
shortLengthTSI
longLengthTSI
maTypeTSI
almaOffsetTSI
almaSigmaTSI
lsmaOffSetTSI
maTypeSignal
smoothingLengthSignal
almaOffsetSignal
almaSigmaSignal
lsmaOffSetSignal
smiMACD(source, fastLength, slowLength, signalLength, maTypeFast, maTypeSlow, maTypeMACD, almaOffset, almaSigma, lsmaOffSet, shortLengthTSI, longLengthTSI, maTypeTSI, almaOffsetTSI, almaSigmaTSI, lsmaOffSetTSI, maTypeSignal, smoothingLengthSignal, almaOffsetSignal, almaSigmaSignal, lsmaOffSetSignal)
Parameters:
source
fastLength
slowLength
signalLength
maTypeFast
maTypeSlow
maTypeMACD
almaOffset
almaSigma
lsmaOffSet
shortLengthTSI
longLengthTSI
maTypeTSI
almaOffsetTSI
almaSigmaTSI
lsmaOffSetTSI
maTypeSignal
smoothingLengthSignal
almaOffsetSignal
almaSigmaSignal
lsmaOffSetSignal
smiVol(shortLengthTSI, longLengthTSI, maTypeTSI, almaOffsetTSI, almaSigmaTSI, lsmaOffSetTSI, maTypeSignal, smoothingLengthSignal, almaOffsetSignal, almaSigmaSignal, lsmaOffSetSignal)
Parameters:
shortLengthTSI
longLengthTSI
maTypeTSI
almaOffsetTSI
almaSigmaTSI
lsmaOffSetTSI
maTypeSignal
smoothingLengthSignal
almaOffsetSignal
almaSigmaSignal
lsmaOffSetSignal
smiMFI(source, length, shortLengthTSI, longLengthTSI, maTypeTSI, almaOffsetTSI, almaSigmaTSI, lsmaOffSetTSI, maTypeSignal, smoothingLengthSignal, almaOffsetSignal, almaSigmaSignal, lsmaOffSetSignal)
Parameters:
source
length
shortLengthTSI
longLengthTSI
maTypeTSI
almaOffsetTSI
almaSigmaTSI
lsmaOffSetTSI
maTypeSignal
smoothingLengthSignal
almaOffsetSignal
almaSigmaSignal
lsmaOffSetSignal
smiCMF(length, shortLengthTSI, longLengthTSI, maTypeTSI, almaOffsetTSI, almaSigmaTSI, lsmaOffSetTSI, maTypeSignal, smoothingLengthSignal, almaOffsetSignal, almaSigmaSignal, lsmaOffSetSignal)
Parameters:
length
shortLengthTSI
longLengthTSI
maTypeTSI
almaOffsetTSI
almaSigmaTSI
lsmaOffSetTSI
maTypeSignal
smoothingLengthSignal
almaOffsetSignal
almaSigmaSignal
lsmaOffSetSignal
smiOBV(source, shortLengthTSI, longLengthTSI, maTypeTSI, almaOffsetTSI, almaSigmaTSI, lsmaOffSetTSI, maTypeSignal, smoothingLengthSignal, almaOffsetSignal, almaSigmaSignal, lsmaOffSetSignal)
Parameters:
source
shortLengthTSI
longLengthTSI
maTypeTSI
almaOffsetTSI
almaSigmaTSI
lsmaOffSetTSI
maTypeSignal
smoothingLengthSignal
almaOffsetSignal
almaSigmaSignal
lsmaOffSetSignal
smiPVT(source, shortLengthTSI, longLengthTSI, maTypeTSI, almaOffsetTSI, almaSigmaTSI, lsmaOffSetTSI, maTypeSignal, smoothingLengthSignal, almaOffsetSignal, almaSigmaSignal, lsmaOffSetSignal)
Parameters:
source
shortLengthTSI
longLengthTSI
maTypeTSI
almaOffsetTSI
almaSigmaTSI
lsmaOffSetTSI
maTypeSignal
smoothingLengthSignal
almaOffsetSignal
almaSigmaSignal
lsmaOffSetSignal
smiVO(shortLen, longLen, maType, almaOffset, almaSigma, lsmaOffSet, shortLengthTSI, longLengthTSI, maTypeTSI, almaOffsetTSI, almaSigmaTSI, lsmaOffSetTSI, maTypeSignal, smoothingLengthSignal, almaOffsetSignal, almaSigmaSignal, lsmaOffSetSignal)
Parameters:
shortLen
longLen
maType
almaOffset
almaSigma
lsmaOffSet
shortLengthTSI
longLengthTSI
maTypeTSI
almaOffsetTSI
almaSigmaTSI
lsmaOffSetTSI
maTypeSignal
smoothingLengthSignal
almaOffsetSignal
almaSigmaSignal
lsmaOffSetSignal
smiPVI(source, shortLengthTSI, longLengthTSI, maTypeTSI, almaOffsetTSI, almaSigmaTSI, lsmaOffSetTSI, maTypeSignal, smoothingLengthSignal, almaOffsetSignal, almaSigmaSignal, lsmaOffSetSignal)
Parameters:
source
shortLengthTSI
longLengthTSI
maTypeTSI
almaOffsetTSI
almaSigmaTSI
lsmaOffSetTSI
maTypeSignal
smoothingLengthSignal
almaOffsetSignal
almaSigmaSignal
lsmaOffSetSignal
smiNVI(source, shortLengthTSI, longLengthTSI, maTypeTSI, almaOffsetTSI, almaSigmaTSI, lsmaOffSetTSI, maTypeSignal, smoothingLengthSignal, almaOffsetSignal, almaSigmaSignal, lsmaOffSetSignal)
Parameters:
source
shortLengthTSI
longLengthTSI
maTypeTSI
almaOffsetTSI
almaSigmaTSI
lsmaOffSetTSI
maTypeSignal
smoothingLengthSignal
almaOffsetSignal
almaSigmaSignal
lsmaOffSetSignal
rsiVolume(length)
Parameters:
length
rsiMA(sourceMA, lengthMA, maType, almaOffset, almaSigma, lsmaOffSet, lengthRSI)
Parameters:
sourceMA
lengthMA
maType
almaOffset
almaSigma
lsmaOffSet
lengthRSI
Indikatoren und Strategien

UtilsLibrary "Utils"
Utility functions. Mathematics, colors, and auxiliary algorithms.
setTheme(vc, theme)
Set theme for levels (predefined colors).
Parameters:
vc : (valueColorSpectrum) Object to associate a color with a value, taking into account the previous value and its levels.
theme : (int) Theme (predefined colors).
0 = 'User defined'
1 = 'Spectrum Blue-Green-Red'
2 = 'Monokai'
3 = 'Green'
4 = 'Purple'
5 = 'Blue'
6 = 'Red'
Returns: (void)
setTheme(vc, colorLevel_Lv1, colorLevel_Lv1_Lv2, colorLevel_Lv2_Lv3, colorLevel_Lv3_Lv4, colorLevel_Lv4_Lv5, colorLevel_Lv5)
Set theme for levels (customized colors).
Parameters:
vc : (valueColorSpectrum) Object to associate a color with a value, taking into account the previous value and its levels
colorLevel_Lv1 : (color) Color associeted with value when below Level 1.
colorLevel_Lv1_Lv2 : (color) Color associeted with value when between Level 1 and 2.
colorLevel_Lv2_Lv3 : (color) Color associeted with value when between Level 2 and 3.
colorLevel_Lv3_Lv4 : (color) Color associeted with value when between Level 3 and 4.
colorLevel_Lv4_Lv5 : (color) Color associeted with value when between Level 4 and 5.
colorLevel_Lv5 : (color) Color associeted with value when above Level 5.
Returns: (void)
setCurrentColorValue(vc)
Set color to a current value, taking into account the previous value and its levels
Parameters:
vc : (valueColorSpectrum) Object to associate a color with a value, taking into account the previous value and its levels
Returns: (void)
setCurrentColorValue(vc, gradient)
Set color to a current value, taking into account the previous value.
Parameters:
vc : (valueColor) Object to associate a color with a value, taking into account the previous value
gradient
Returns: (void)
setCustomLevels(vc, level1, level2, level3, level4, level5)
Set boundaries for custom levels.
Parameters:
vc : (valueColorSpectrum) Object to associate a color with a value, taking into account the previous value and its levels
level1 : (float) Boundary for level 1
level2 : (float) Boundary for level 2
level3 : (float) Boundary for level 3
level4 : (float) Boundary for level 4
level5 : (float) Boundary for level 5
Returns: (void)
getPeriodicColor(originalColor, density)
Returns a periodic color. Useful for creating dotted lines for example.
Parameters:
originalColor : (color) Original color.
density : (float) Density of color. Expression used in modulo to obtain the integer remainder.
If the remainder equals zero, the color appears, otherwise it remains hidden.
Returns: (color) Periodic color.
dinamicZone(source, sampleLength, pcntAbove, pcntBelow)
Get Dynamic Zones
Parameters:
source : (float) Source
sampleLength : (int) Sample Length
pcntAbove : (float) Calculates the top of the dynamic zone, considering that the maximum values are above x% of the sample
pcntBelow : (float) Calculates the bottom of the dynamic zone, considering that the minimum values are below x% of the sample
Returns: A tuple with 3 series of values: (1) Upper Line of Dynamic Zone;
(2) Lower Line of Dynamic Zone; (3) Center of Dynamic Zone (x = 50%)
valueColorSpectrum
# Object to associate a color with a value, taking into account the previous value and its levels.
Fields:
currentValue
previousValue
level1
level2
level3
level4
level5
currentColorValue
colorLevel_Lv1
colorLevel_Lv1_Lv2
colorLevel_Lv2_Lv3
colorLevel_Lv3_Lv4
colorLevel_Lv4_Lv5
colorLevel_Lv5
theme
valueColor
# Object to associate a color with a value, taking into account the previous value
Fields:
currentValue
previousValue
currentColorValue
colorUp
colorDown

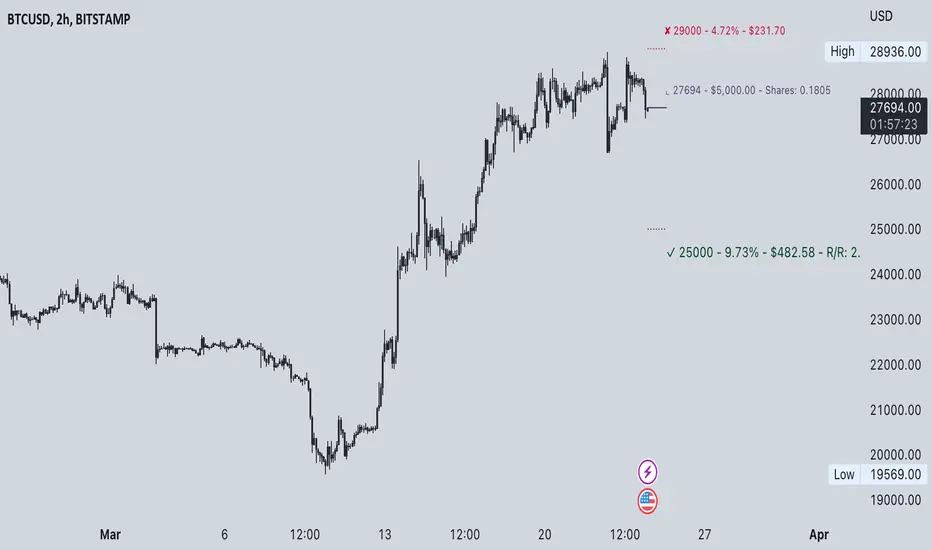
Commission-aware Trade LabelsCommission-aware Trade Labels
Description:
This library provides an easy way to visualize take-profit and stop-loss levels on your chart, taking into account trading commissions. The library calculates and displays the net profit or loss, along with other useful information such as risk/reward ratio, shares, and position size.
Features:
Configurable take-profit and stop-loss prices or percentages.
Set entry amount or shares.
Calculates and displays the risk/reward ratio.
Shows net profit or loss, considering trading commissions.
Customizable label appearance.
Usage:
Add the script to your chart.
Create an Order object for take-profit and stop-loss with desired configurations.
Call target_label() and stop_label() methods for each order object.
Example:
target_order = Order.new(take_profit_price=27483, stop_loss_price=28000, shares=0.2)
stop_order = Order.new(stop_loss_price=29000, shares=1)
target_order.target_label()
stop_order.stop_label()
This script is a powerful tool for visualizing your trading strategy's performance and helps you make better-informed decisions by considering trading commissions in your profit and loss calculations.
Library "tradelabels"
entry_price(this)
Parameters:
this : Order object
@return entry_price
take_profit_price(this)
Parameters:
this : Order object
@return take_profit_price
stop_loss_price(this)
Parameters:
this : Order object
@return stop_loss_price
is_long(this)
Parameters:
this : Order object
@return entry_price
is_short(this)
Parameters:
this : Order object
@return entry_price
percent_to_target(this, target)
Parameters:
this : Order object
target : Target price
@return percent
risk_reward(this)
Parameters:
this : Order object
@return risk_reward_ratio
shares(this)
Parameters:
this : Order object
@return shares
position_size(this)
Parameters:
this : Order object
@return position_size
commission_cost(this, target_price)
Parameters:
this : Order object
@return commission_cost
target_price
net_result(this, target_price)
Parameters:
this : Order object
target_price : The target price to calculate net result for (either take_profit_price or stop_loss_price)
@return net_result
create_take_profit_label(this, prefix, size, offset_x, bg_color, text_color)
Parameters:
this
prefix
size
offset_x
bg_color
text_color
create_stop_loss_label(this, prefix, size, offset_x, bg_color, text_color)
Parameters:
this
prefix
size
offset_x
bg_color
text_color
create_entry_label(this, prefix, size, offset_x, bg_color, text_color)
Parameters:
this
prefix
size
offset_x
bg_color
text_color
create_line(this, target_price, line_color, offset_x, line_style, line_width, draw_entry_line)
Parameters:
this
target_price
line_color
offset_x
line_style
line_width
draw_entry_line
Order
Order
Fields:
entry_price : Entry price
stop_loss_price : Stop loss price
stop_loss_percent : Stop loss percent, default 2%
take_profit_price : Take profit price
take_profit_percent : Take profit percent, default 6%
entry_amount : Entry amount, default 5000$
shares : Shares
commission : Commission, default 0.04%
WIPTensorLibrary "WIPTensor"
A Tensor or 3 dimensional array structure and interface.
---
Note: im just highjacking the name to use it as a 3d array on a project..
there is no optimization attempts or tensor specific functionality within.
to_string(this)
Convert `Tensor` to a string format.
Parameters:
this : Tensor data.
Returns: string.
to_vector(this)
Convert `Tensor` to a one dimension array.
Parameters:
this : Tensor data.
Returns: New array with flattened `Tensor` data.
new(x, y, z, initial_value)
Create a new `Tensor` with provided shape.
Parameters:
x : Dimension `X` size.
y : Dimension `Y` size.
z : Dimension `Z` size.
initial_value : Value to fill the `Tensor`.
Returns: New `Tensor`.
new(shape, initial_value)
Create a new `Tensor` with provided shape.
Parameters:
shape : Shape of dimensions size.
initial_value : Value to fill the `Tensor`.
Returns: New `Tensor`.
from(expression, sepx, sepy, sepz)
Create a `Tensor` from provided array and shape.
Parameters:
expression
sepx
sepy
sepz
Returns: New `Tensor`.
from(vector, x, y, z)
Create a `Tensor` from provided array and shape.
Parameters:
vector : Data with flattened dimensions.
x
y
z
Returns: New `Tensor`.
from(vector, shape)
Parameters:
vector
shape
get(this, x, y, z)
Get the value at position.
Parameters:
this : `Tensor` data.
x
y
z
Returns: Value at position.
get(this, position)
Parameters:
this
position
set(this, x, y, z, value)
Set the value at position.
Parameters:
this : `Tensor` data.
x
y
z
value : New Value.
set(this, position, value)
Parameters:
this
position
value
Vector
Helper type for 3d structure.
Fields:
v : Vector of the 3rd dimension.
Tensor
A Tensor is a three dimensional array were the 3rd dimension accounts for time.
Fields:
m : Matrix that holds the vectors.
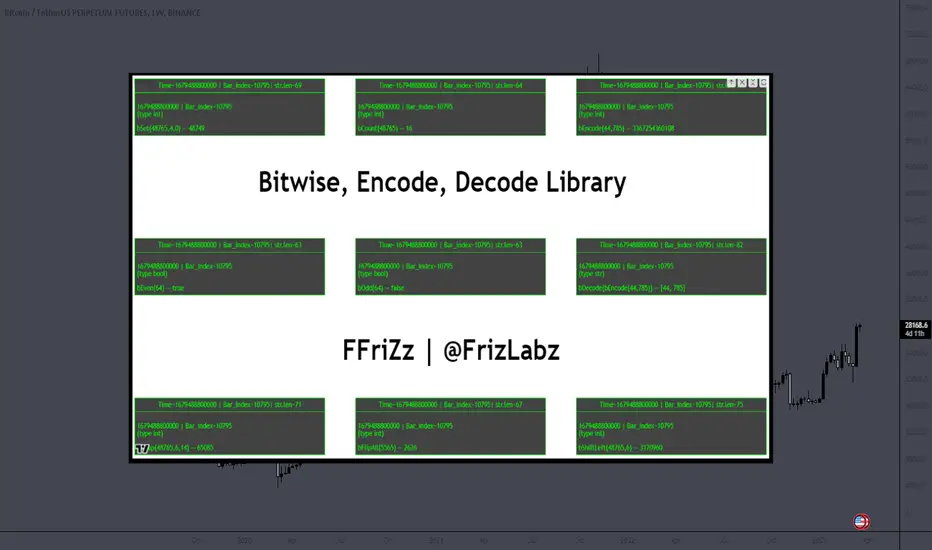
Bitwise, Encode, DecodeLibrary "Bitwise, Encode, Decode"
Bitwise, Encode, Decode, and more Library
docs()
Hover-Over Documentation for inside Text Editor
bAnd(a, b)
Returns the bitwise AND of two integers
Parameters:
a : `int` - The first integer
b : `int` - The second integer
Returns: `int` - The bitwise AND of the two integers
bOr(a, b)
Performs a bitwise OR operation on two integers.
Parameters:
a : `int` - The first integer.
b : `int` - The second integer.
Returns: `int` - The result of the bitwise OR operation.
bXor(a, b)
Performs a bitwise Xor operation on two integers.
Parameters:
a : `int` - The first integer.
b : `int` - The second integer.
Returns: `int` - The result of the bitwise Xor operation.
bNot(n)
Performs a bitwise NOT operation on an integer.
Parameters:
n : `int` - The integer to perform the bitwise NOT operation on.
Returns: `int` - The result of the bitwise NOT operation.
bShiftLeft(n, step)
Performs a bitwise left shift operation on an integer.
Parameters:
n : `int` - The integer to perform the bitwise left shift operation on.
step : `int` - The number of positions to shift the bits to the left.
Returns: `int` - The result of the bitwise left shift operation.
bShiftRight(n, step)
Performs a bitwise right shift operation on an integer.
Parameters:
n : `int` - The integer to perform the bitwise right shift operation on.
step : `int` - The number of bits to shift by.
Returns: `int` - The result of the bitwise right shift operation.
bRotateLeft(n, step)
Performs a bitwise right shift operation on an integer.
Parameters:
n : `int` - The int to perform the bitwise Left rotation on the bits.
step : `int` - The number of bits to shift by.
Returns: `int`- The result of the bitwise right shift operation.
bRotateRight(n, step)
Performs a bitwise right shift operation on an integer.
Parameters:
n : `int` - The int to perform the bitwise Right rotation on the bits.
step : `int` - The number of bits to shift by.
Returns: `int` - The result of the bitwise right shift operation.
bSetCheck(n, pos)
Checks if the bit at the given position is set to 1.
Parameters:
n : `int` - The integer to check.
pos : `int` - The position of the bit to check.
Returns: `bool` - True if the bit is set to 1, False otherwise.
bClear(n, pos)
Clears a particular bit of an integer (changes from 1 to 0) passes if bit at pos is 0.
Parameters:
n : `int` - The integer to clear a bit from.
pos : `int` - The zero-based index of the bit to clear.
Returns: `int` - The result of clearing the specified bit.
bFlip0s(n)
Flips all 0 bits in the number to 1.
Parameters:
n : `int` - The integer to flip the bits of.
Returns: `int` - The result of flipping all 0 bits in the number.
bFlip1s(n)
Flips all 1 bits in the number to 0.
Parameters:
n : `int` - The integer to flip the bits of.
Returns: `int` - The result of flipping all 1 bits in the number.
bFlipAll(n)
Flips all bits in the number.
Parameters:
n : `int` - The integer to flip the bits of.
Returns: `int` - The result of flipping all bits in the number.
bSet(n, pos, newBit)
Changes the value of the bit at the given position.
Parameters:
n : `int` - The integer to modify.
pos : `int` - The position of the bit to change.
newBit : `int` - na = flips bit at pos reguardless 1 or 0 | The new value of the bit (0 or 1).
Returns: `int` - The modified integer.
changeDigit(n, pos, newDigit)
Changes the value of the digit at the given position.
Parameters:
n : `int` - The integer to modify.
pos : `int` - The position of the digit to change.
newDigit : `int` - The new value of the digit (0-9).
Returns: `int` - The modified integer.
bSwap(n, i, j)
Switch the position of 2 bits of an int
Parameters:
n : `int` - int to manipulate
i : `int` - bit pos to switch with j
j : `int` - bit pos to switch with i
Returns: `int` - new int with bits switched
bPalindrome(n)
Checks to see if the binary form is a Palindrome (reads the same left to right and vice versa)
Parameters:
n : `int` - int to check
Returns: `bool` - result of check
bEven(n)
Checks if n is Even
Parameters:
n : `int` - The integer to check.
Returns: `bool` - result.
bOdd(n)
checks if n is Even if not even Odd
Parameters:
n : `int` - The integer to check.
Returns: `bool` - result.
bPowerOfTwo(n)
Checks if n is a Power of 2.
Parameters:
n : `int` - number to check.
Returns: `bool` - result.
bCount(n, to_count)
Counts the number of bits that are equal to 1 in an integer.
Parameters:
n : `int` - The integer to count the bits in.
to_count `string` - the bits to count
Returns: `int` - The number of bits that are equal to 1 in n.
GCD(a, b)
Finds the greatest common divisor (GCD) of two numbers.
Parameters:
a : `int` - The first number.
b : `int` - The second number.
Returns: `int` - The GCD of a and b.
LCM(a, b)
Finds the least common multiple (LCM) of two integers.
Parameters:
a : `int` - The first integer.
b : `int` - The second integer.
Returns: `int` - The LCM of a and b.
aLCM(nums)
Finds the LCM of an array of integers.
Parameters:
nums : `int ` - The list of integers.
Returns: `int` - The LCM of the integers in nums.
adjustedLCM(nums, LCM)
adjust an array of integers to Least Common Multiple (LCM)
Parameters:
nums : `int ` - The first integer
LCM : `int` - The second integer
Returns: `int ` - array of ints with LCM
charAt(str, pos)
gets a Char at a given position.
Parameters:
str : `string` - string to pull char from.
pos : `int` - pos to get char from string (left to right index).
Returns: `string` - char from pos of string or "" if pos is not within index range
decimalToBinary(num)
Converts a decimal number to binary
Parameters:
num : `int` - The decimal number to convert to binary
Returns: `string` - The binary representation of the decimal number
decimalToBinary(num, to_binary_int)
Converts a decimal number to binary
Parameters:
num : `int` - The decimal number to convert to binary
to_binary_int : `bool` - bool to convert to int or to string (true for int, false for string)
Returns: `string` - The binary representation of the decimal number
binaryToDecimal(binary)
Converts a binary number to decimal
Parameters:
binary : `string` - The binary number to convert to decimal
Returns: `int` - The decimal representation of the binary number
decimal_len(n)
way of finding decimal length using arithmetic
Parameters:
n `float` - floating decimal point to get length of.
Returns: `int` - number of decimal places
int_len(n)
way of finding number length using arithmetic
Parameters:
n : `int`- value to find length of number
Returns: `int` - lenth of nunber i.e. 23 == 2
float_decimal_to_whole(n)
Converts a float decimal number to an integer `0.365 to 365`.
Parameters:
n : `string` - The decimal number represented as a string.
Returns: `int` - The integer obtained by removing the decimal point and leading zeroes from s.
fractional_part(x)
Returns the fractional part of a float.
Parameters:
x : `float` - The float to get the fractional part of.
Returns: `float` - The fractional part of the float.
form_decimal(a, b, zero_fix)
helper to form 2 ints into 1 float seperated by the decimal
Parameters:
a : `int` - a int
b : `int` - b int
zero_fix : `bool` - fix for trailing zeros being truncated when converting to float
Returns: ` ` - float = float decimal of ints | string = string version of b for future use to ref length
bEncode(n1, n2)
Encodes two numbers into one using bit OR. (fastest)
Parameters:
n1 : `int` - The first number to Encodes.
n2 : `int` - The second number to Encodes.
Returns: `int` - The result of combining the two numbers using bit OR.
bDecode(n)
Decodes an integer created by the bCombine function.(fastest)
Parameters:
n : `int` - The integer to decode.
Returns: ` ` - A tuple containing the two decoded components of the integer.
Encode(a, b)
Encodes by seperating ints into left and right of decimal float
Parameters:
a : `int` - a int
b : `int` - b int
Returns: `float` - new float of encoded ints one on left of decimal point one on right
Decode(encoded)
Decodes float of 2 ints seperated by decimal point
Parameters:
encoded : `float` - the encoded float value
Returns: ` ` - tuple of the 2 ints from encoded float
encode_heavy(a, b)
Encodes by combining numbers and tracking size in the
decimal of a floating number (slowest)
Parameters:
a : `int` - a int
b : `int` - b int
Returns: `float` - new decimal of encoded ints
decode_heavy(encoded)
Decodes encoded float that tracks size of ints in float decimal
Parameters:
encoded : `float` - encoded float
Returns: ` ` - tuple of decoded ints
decimal of float (slowest)
Parameters:
encoded : `float` - the encoded float value
Returns: ` ` - tuple of the 2 ints from encoded float
Bitwise, Encode, Decode Docs
In the documentation you may notice the word decimal
not used as normal this is because when referring to
binary a decimal number is a number that
can be represented with base 10 numbers 0-9
(the wiki below explains better)
A rule of thumb for the two integers being
encoded it to keep both numbers
less than 65535 this is because anything lower uses 16 bits or less
this will maintain 100% accuracy when decoding
although it is possible to do numbers up to 2147483645 with
this library doesnt seem useful enough
to explain or demonstrate.
The functions provided work within this 32-bit range,
where the highest number is all 1s and
the lowest number is all 0s. These functions were created
to overcome the lack of built-in bitwise functions in Pinescript.
By combining two integers into a single number,
the code can access both values i.e when
indexing only one array index
for a matrices row/column, thus improving execution time.
This technique can be applied to various coding
scenarios to enhance performance.
Bitwise functions are a way to use integers in binary form
that can be used to speed up several different processes
most languages have operators to perform these function such as
`<<, >>, &, ^, |, ~`
en.wikipedia.org
Simple Trendlines📈 Trendlines, made easy.
Simple Trendlines is a carefully made library that provides an easy and accessible way to draw trendlines on the chart.
Containing only 10 properties and 2 methods, the implementation is designed to be understandable through an object-oriented structure and provides developers the opportunity to expand without having to deal with slope calculation while also ensuring that there's no leakage between the trendlines before they're drawn.
Developers only need to provide 5 expressions to get everything up in running. This includes the following but is not limited to
The x-axis
Point A (Y1 Value)
Point B (Y2 Value)
A condition to draw the line
A condition to keep the trendline under continuation
Automatic x-axis calculation is not a built-in feature due to the inconsistency it could bring.
📕 Quick Example
import HoanGhetti/SimpleTrendlines/1 as tl
input_len = input.int(defval = 10)
pivotLow = fixnan(ta.pivotlow(input_len, input_len))
xAxis = ta.valuewhen(ta.change(pivotLow), bar_index, 0) - ta.valuewhen(ta.change(pivotLow), bar_index, 1)
prevPivot = ta.valuewhen(ta.change(pivotLow), pivotLow, 1)
pivotCondition = ta.change(pivotLow) and pivotLow > prevPivot
plData = tl.new(x_axis = xAxis, offset = input_len)
plData.drawLine(pivotCondition, prevPivot, pivotLow)
plData.drawTrendline(close > 0)
plData.lines.trendline.set_style(line.style_dashed)
plData.lines.trendline.set_width(2)
plData.lines.startline.set_width(2)
Excluding the styling at the bottom, that was only 8 lines of code which yields the following result.
⏳ Before continuing
The library does not support block-scoped execution. Conditions must be declared before and integrated as a parameter. This doesn't limit any capabilities and only involves thinking logically about precedence. It was made this way for code readability and to keep things organized.
The offset value inside the TrendlineSettings object can potentially affect performance (although very minimal) if you're using strict mode. When using strict mode, it loops through historical values to then do backend calculations.
🔽 Getting Started 🔽
Creating trendlines without a library isn't a hard task. However, the library features a built-in system called strict mode. We'll dive further into this below.
Creating an Instance
You can create an instance of the library by calling the new() function. Passing an identifier is conventionally mandatory in this case so you can reference properties and methods.
import HoanGhetti/SimpleTrendlines/2 as tl
lineData = tl.new(int x_axis, int offset, bool strictMode, int strictType)
___
int x_axis (Required) The distance between point A and point B provided by the user.
int offset (Optional) The offset from x2 and the current bar_index. Used in situations where conditions execute ahead of where the x2 location is such as pivót events.
bool strictMode (Optional) Strict mode works in the backend of things to ensure that the price hasn't closed below the trendline before the trendline is drawn.
int strictType (Optional) Only accepts 0 and 1, 0 ensures that the price during slope calculation is above the line, and 1 ensures that the price during slope calculation is below the line.
The Initial Line
After instantiating the library, we can go ahead use the identifer we made above and create an instance of our initial line by calling the drawLine() method.
lineData.drawLine(bool condition, float y1, float y2, float src)
___
bool condition (Required) The condition in order to draw a new line.
float y1 (Required) The y-value of point A.
float y2 (Required) The y-value of point B.
float src (Optional) Determines which value strict mode will actively check for leakage before a trendline is drawn.
Typically used if you're not referencing OHLC values for your y-values, or you want to check for another value to exceed the line besides using the close value.
The Trendline
The trendline that gets drawn solely uses the values of the initial line and can be called using the drawTrendline() method. The library enforces a condition as a parameter in order to maintain simplicity.
lineData.drawTrendline(bool condition)
___
bool condition (Required) The condition in order to maintain and continue drawing the trendline.
⚙️ Features
🔹 Automatic Slope Calculation
In the background, the library calculates the next Y2 and X2 values on every tick for the trendline. Preventing the developer from having to do such a process themself.
🔹 Object-Oriented
Each object contains manipulative properties that allow the developer to debug and have the freedom they want.
🔹 Enforced Error Checking
Runtime errors have been put in place to ensure you're doing things correctly.
🔹 Strict Mode & Offset
Strict mode can only be used when the offset value is over 0. It's a feature that's only meant to function under scenarios where a condition executes further than where the X2 is relative to the current bar_index value.
Let's think about pivot systems. As you're aware, pivot events are detected based on historical factors. If a swing low occurred nth bars ago, then the pivot condition will execute at the current bar_index instead of executing nth bars back.
Now because of this, what if you wanted to draw a trendline when the pivot event is executed? The offset value takes care of this just as you would when developing your other scripts, basically how we always do bar_index - n. However, what does this mean for strict mode?
The photo below represents the logic behind the execution.
When looking at this image, imagine this just happened, the event just executed and the trendline is now drawn. Pay attention to all the values inside the surrounding box. As you can see there are some candles that closed below the trendline before the trendline was drawn.
From what I can see 5-6 candles closed below the trendline during slope calculation. The goal of strict mode is to be a provisional system that prevents such occurrences from happening.
Here's a photo with strict mode on.
🔹 Strict Type
A parameter used in the new() function that acts as a representation of what strict mode should calculate for. It accepts only two values, 0 and 1.
0 - Ensures that all candles have closed above the trendline before the trendline is drawn.
1 - Ensures that all candles have closed below the trendline before the trendline is drawn.
In the most recent photo above, I used 0 for strict type, since I was wanting to have a clean trendline and ensure that not a single candlestick closed below.
If you want to reference something else besides the close value during strict mode calculation, you can change it in the drawLine() method.
If it's still difficult to understand, think 0 for pivot lows, and 1 for pivot highs.
📕 Methods and Property Inheritance
The library isn't crazy, but hopefully, it helps.
That is all.👍

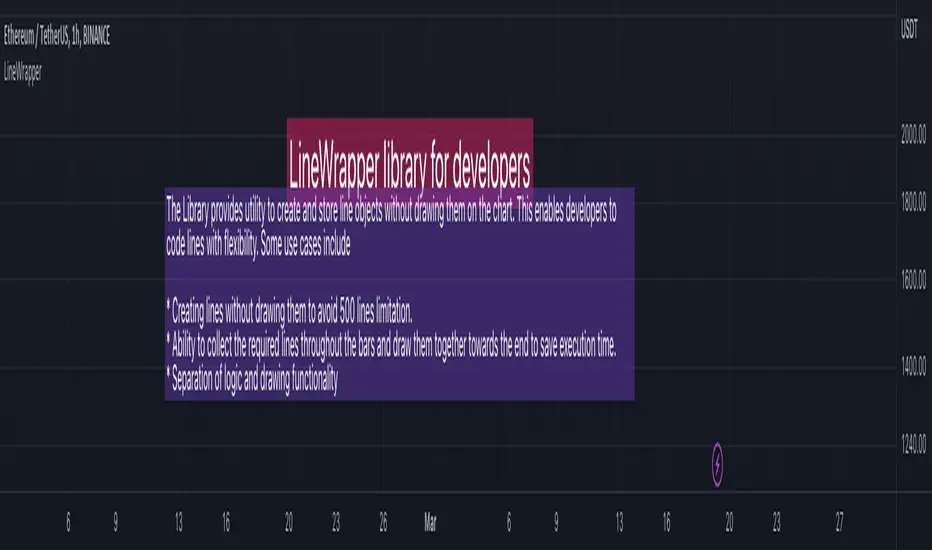
LineWrapperLibrary "LineWrapper"
Wrapper Type for Line. Useful when you want to store the line details without drawing them. Can also be used in scnearios where you collect lines to be drawn and draw together towards the end.
draw(this)
draws line as per the wrapper object contents
Parameters:
this : (series Line) Line object.
Returns: current Line object
draw(this)
draws lines as per the wrapper object array
Parameters:
this : (series array) Array of Line object.
Returns: current Array of Line objects
update(this)
updates or redraws line as per the wrapper object contents
Parameters:
this : (series Line) Line object.
Returns: current Line object
update(this)
updates or redraws lines as per the wrapper object array
Parameters:
this : (series array) Array of Line object.
Returns: current Array of Line objects
get_price(this, bar)
get line price based on bar
Parameters:
this : (series Line) Line object.
bar : (series/int) bar at which line price need to be calculated
Returns: line price at given bar.
get_x1(this)
Returns UNIX time or bar index (depending on the last xloc value set) of the first point of the line.
Parameters:
this : (series Line) Line object.
Returns: UNIX timestamp (in milliseconds) or bar index.
get_x2(this)
Returns UNIX time or bar index (depending on the last xloc value set) of the second point of the line.
Parameters:
this : (series Line) Line object.
Returns: UNIX timestamp (in milliseconds) or bar index.
get_y1(this)
Returns price of the first point of the line.
Parameters:
this : (series Line) Line object.
Returns: Price value.
get_y2(this)
Returns price of the second point of the line.
Parameters:
this : (series Line) Line object.
Returns: Price value.
set_x1(this, x, draw, update)
Sets bar index or bar time (depending on the xloc) of the first point.
Parameters:
this : (series Line) Line object.
x : (series int) Bar index or bar time. Note that objects positioned using xloc.bar_index cannot be drawn further than 500 bars into the future.
draw : (series bool) draw line after setting attribute
update : (series bool) update line instead of redraw. Only valid if draw is set.
Returns: Current Line object
set_x2(this, x, draw, update)
Sets bar index or bar time (depending on the xloc) of the second point.
Parameters:
this : (series Line) Line object.
x : (series int) Bar index or bar time. Note that objects positioned using xloc.bar_index cannot be drawn further than 500 bars into the future.
draw : (series bool) draw line after setting attribute
update : (series bool) update line instead of redraw. Only valid if draw is set.
Returns: Current Line object
set_y1(this, y, draw, update)
Sets price of the first point
Parameters:
this : (series Line) Line object.
y : (series int/float) Price.
draw : (series bool) draw line after setting attribute
update : (series bool) update line instead of redraw. Only valid if draw is set.
Returns: Current Line object
set_y2(this, y, draw, update)
Sets price of the second point
Parameters:
this : (series Line) Line object.
y : (series int/float) Price.
draw : (series bool) draw line after setting attribute
update : (series bool) update line instead of redraw. Only valid if draw is set.
Returns: Current Line object
set_color(this, color, draw, update)
Sets the line color
Parameters:
this : (series Line) Line object.
color : (series color) New line color
draw : (series bool) draw line after setting attribute
update : (series bool) update line instead of redraw. Only valid if draw is set.
Returns: Current Line object
set_extend(this, extend, draw, update)
Sets extending type of this line object. If extend=extend.none, draws segment starting at point (x1, y1) and ending at point (x2, y2). If extend is equal to extend.right or extend.left, draws a ray starting at point (x1, y1) or (x2, y2), respectively. If extend=extend.both, draws a straight line that goes through these points.
Parameters:
this : (series Line) Line object.
extend : (series string) New extending type.
draw : (series bool) draw line after setting attribute
update : (series bool) update line instead of redraw. Only valid if draw is set.
Returns: Current Line object
set_style(this, style, draw, update)
Sets the line style
Parameters:
this : (series Line) Line object.
style : (series string) New line style.
draw : (series bool) draw line after setting attribute
update : (series bool) update line instead of redraw. Only valid if draw is set.
Returns: Current Line object
set_width(this, width, draw, update)
Sets the line width.
Parameters:
this : (series Line) Line object.
width : (series int) New line width in pixels.
draw : (series bool) draw line after setting attribute
update : (series bool) update line instead of redraw. Only valid if draw is set.
Returns: Current Line object
set_xloc(this, x1, x2, xloc, draw, update)
Sets x-location and new bar index/time values.
Parameters:
this : (series Line) Line object.
x1 : (series int) Bar index or bar time of the first point.
x2 : (series int) Bar index or bar time of the second point.
xloc : (series string) New x-location value.
draw : (series bool) draw line after setting attribute
update : (series bool) update line instead of redraw. Only valid if draw is set.
Returns: Current Line object
set_xy1(this, x, y, draw, update)
Sets bar index/time and price of the first point.
Parameters:
this : (series Line) Line object.
x : (series int) Bar index or bar time. Note that objects positioned using xloc.bar_index cannot be drawn further than 500 bars into the future.
y : (series int/float) Price.
draw : (series bool) draw line after setting attribute
update : (series bool) update line instead of redraw. Only valid if draw is set.
Returns: Current Line object
set_xy2(this, x, y, draw, update)
Sets bar index/time and price of the second point
Parameters:
this : (series Line) Line object.
x : (series int) Bar index or bar time. Note that objects positioned using xloc.bar_index cannot be drawn further than 500 bars into the future.
y : (series int/float) Price.
draw : (series bool) draw line after setting attribute
update : (series bool) update line instead of redraw. Only valid if draw is set.
Returns: Current Line object
delete(this)
Deletes the underlying line drawing object
Parameters:
this : (series Line) Line object.
Returns: Current Line object
Line
Line Wrapper object
Fields:
x1 : (series int) Bar index (if xloc = xloc.bar_index) or bar UNIX time (if xloc = xloc.bar_time) of the first point of the line. Note that objects positioned using xloc.bar_index cannot be drawn further than 500 bars into the future.
y1 : (series int/float) Price of the first point of the line.
x2 : (series int) Bar index (if xloc = xloc.bar_index) or bar UNIX time (if xloc = xloc.bar_time) of the second point of the line. Note that objects positioned using xloc.bar_index cannot be drawn further than 500 bars into the future.
y2 : (series int/float) Price of the second point of the line.
xloc : (series string) See description of x1 argument. Possible values: xloc.bar_index and xloc.bar_time. Default is xloc.bar_index.
extend : (series string) If extend=extend.none, draws segment starting at point (x1, y1) and ending at point (x2, y2). If extend is equal to extend.right or extend.left, draws a ray starting at point (x1, y1) or (x2, y2), respectively. If extend=extend.both, draws a straight line that goes through these points. Default value is extend.none.
color : (series color) Line color.
style : (series string) Line style. Possible values: line.style_solid, line.style_dotted, line.style_dashed, line.style_arrow_left, line.style_arrow_right, line.style_arrow_both.
width : (series int) Line width in pixels.
obj : line object
L_Trade_BoundariesLibrary "L_Trade_Boundaries"
Trade Boundaries suggest a strength of the security with respect to previous lows. The "L" implies library, and the trade boundaries implies it could be utilized for price strengths. Though, this should not be used as a single parameter to trade wildly. This library can be imported to a custom indicator to utilized the custom functions. There are moving averages attached at the bottom right of the canvas (overlay) to benchmark the closing price with respect to Moving Averages: 20, 28, and 200 (i.e., "D" if timeframe == "D") respectively. The Volume Indicator located at the top of the canvas is a default function (function already made by the trading view) this shows the volume with respect to the selected time frame. All of the indicators tell a story with regard to the security price (in strength terms).
What is available in this Library?
Litmus Color
> This is a function will change color of two numbers, if the first number is less than the second, the color will be red; otherwise, the color will be green.
Lister
> This is simply using an array by revisiting previous lows and plotting to the current time frame (i.e., "D"). There is a custom frequency input for the function, it will go back as much as the implied/specified length. Note: I am still learning how to use array, use this function with discretion. I would also appreciate if there are suggestions commented below.
Moving Average
> This function invokes three moving average metrics: 20, 28, and 200 respectively. The values are displayed at the bottom right of the canvas.
Timeframe Highlight
> This function checks for the input timeframe (i.e., "D", "W", "M") and if the time frame happens to be the same, it will give a "true" result. This result can be utilized for highlighting the positive results on the canvas (the red lines).
litmus_color(value1, value2)
Parameters:
value1
value2
lister(length)
Parameters:
length
moving_averages()
timeframe_highlight(timeframe)
Parameters:
timeframe

[VWMA] Net Volume LibraryLibrary " Net Volume Library"
TODO: The underlying logic and function that calculates the net volume for the Net Volume indicator. Exposes the nv function and nvPoint fields for use.
nv(src, length, useVwma, offset, sigma, multHigh, multMed, multLow)
Parameters:
src : (float) The source price value
length : (int) The lookback length
useVwma : (bool) To use VWMA in the calculation or not
offset : (float) The ALMA offset value
sigma : (int) The ALMA sigma value
multHigh : (float) The multiplier high band
multMed : (float) The multiplier medium band
multLow : (float) The multiplier low band
Returns: Returns the calculated net volume for each band in an nvPoint object
nvPoint
Fields:
h2
h1
h
n
l
l1
l2

ThemeLibraryLibrary "ThemeLibrary"
TODO: add library description here
theme(_theme)
: a library of themed colors
Parameters:
_theme : : the theme color to fetch
Returns: : an array of colors

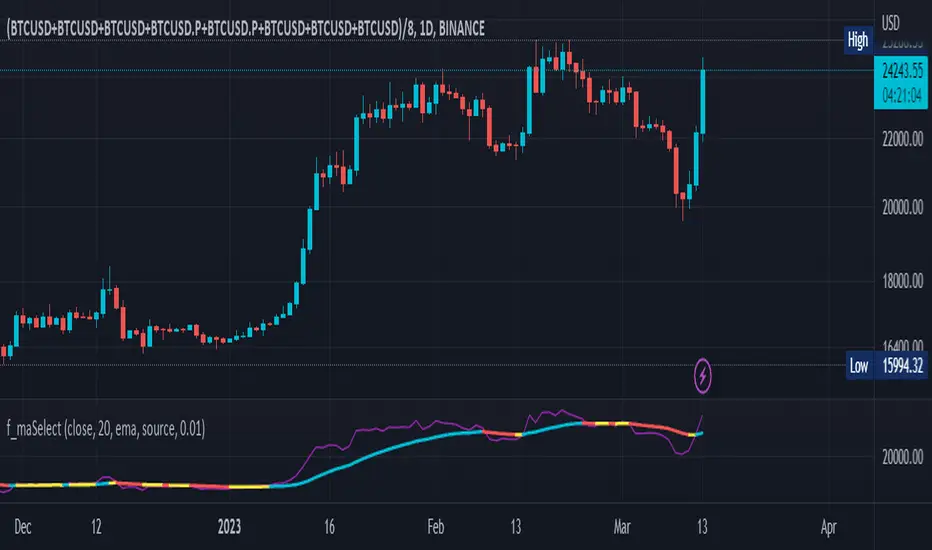
f_maSelectLibrary "f_maSelect"
Easy to use drop-in facade function to lots of different moving average calculations, including some that are not natively available in PineScript v5 such as Zero-Lag EMA. Simply call f_maSelect(series float serie, simple string ma_type="sma", ma_length=14) instead of a ta.*ma() call and you get access to all MAs offered by PineScript and more.
zema(src, len)
Zero-lag EMA (ZLMA)
Parameters:
src : Input series
len : Lookback period
Returns: Series smoothed with ZLMA
approximate_sma(x, ma_length)
Approximate Standard Moving Average, which substracts the average instead of popping the oldest element, hence losing the base frequency and is why it is approximative. For some reason, this appears to give the same results as a standard RMA
Parameters:
x : Input series.
ma_length : Lookback period.
Returns: Approximate SMA series.
f_maSelect(serie, ma_type, ma_length)
Generalized moving average selector
Parameters:
serie : Input series
ma_type : String describing which moving average to use
ma_length : Lookback period
Returns: Serie smoothed with the selected moving average.
generalized_dev(src, length, avg, lmode)
Generalized deviation calculation: Whereas other Bollinger Bands often just change the basis but not the stdev calculation, the correct way to change the basis is to also change it inside the stdev calculation.
Parameters:
src : Series to use (default: close)
length : Lookback period
avg : Average basis to use to calculate the standard deviation
lmode : L1 or L2 regularization? (ie, lmode=1 uses abs() to cutoff negative values hence it calculates the Mean Absolute Deviation as does the ta.dev(), lmode=2 uses sum of squares hence it calculates the true Standard Deviation as the ta.stdev() function does). See also the research works of everget:
Returns: stdev Standard deviation series
generalized_dev_discount(src, length, avg, lmode, temporal_discount)
Standard deviation calculation but with different probabilities assigned to each bar, with newer bars having more weights en.wikipedia.org
Parameters:
src : Series to use (default: close)
length : Lookback period
avg : Average basis to use to calculate the standard deviation
lmode : L1 or L2 regularization? (ie, lmode=1 uses abs() to cutoff negative values hence it calculates the Mean Absolute Deviation as does the ta.dev(), lmode=2 uses sum of squares hence it calculates the true Standard Deviation as the ta.stdev() function does). See also the research works of everget:
temporal_discount : Probabilistic gamma factor to discount old values in favor of new ones, higher value = more weight to newer bars
Returns: stdev Standard deviation series
median_absdev(src, length, median)
Median Absolute Deviation
Parameters:
src : Input series
length : Lookback period
median : Median already calculated on the input series
Returns: mad, the median absolute deviation value
composite_ticker_cleanerLibrary "composite_ticker_cleaner"
Extract a clean symbol from a composite ticker. E.g., (BINANCE:BTCUSD+KRAKEN:BTCUSD)/2 as input will return BTCUSD or BINANCE:BTCUSD
composite_ticker_cleaner_extract_first(symbol, keepexchange)
Extract the first symbol out of the supplied string (usually ticker.standard(syminfo.tickerid) )
Parameters:
symbol : string input string to search in
keepexchange : bool (optional) Keep exchange in the returned ticker? By default, we only return the symbol without the exchange.
Returns: first occurrence of a symbol
composite_ticker_cleaner_extract_first(keepexchange)
Extract the first symbol out of the current tickerid (as provided by ticker.standard(syminfo.tickerid) )
Parameters:
keepexchange : bool (optional) Keep exchange in the returned ticker? By default, we only return the symbol without the exchange.
Returns: first occurrence of a symbol in the current tickerid
This is inspired by the work I did on this indicator:
I needed a similar functionality in another script, so instead of duplicating code, I thought generalizing the process in a library could be helpful for me and others, and will be easier to maintain and upgrade with new features if I need to.

distance_ratioLibrary "distance_ratio"
Collection of types and functions that can be used for the calculation of the ratio of a distance
from a barrier price using several methods. Methods supported are percentagewise (PERC), atr-based (ATR), fixed
profit (PROF), tick-based (TICKS), risk reward ratio (RR) and local extrema (LOC).
This library is meant to replace my previously published "distance_percentile" library since it offers a more intuitive interface by using the method syntax.

wbburgin_utilsLibrary "wbburgin_utils"
trendUp(source)
Parameters:
source
smoothrng(source, sampling_period, range_mult)
Parameters:
source
sampling_period
range_mult
rngfilt(source, smoothrng)
Parameters:
source
smoothrng
fusion(overallLength, rsiLength, mfiLength, macdLength, cciLength, tsiLength, rviLength, atrLength, adxLength)
Parameters:
overallLength
rsiLength
mfiLength
macdLength
cciLength
tsiLength
rviLength
atrLength
adxLength
zonestrength(amplitude, wavelength)
Parameters:
amplitude
wavelength
atr_anysource(source, atr_length)
Parameters:
source
atr_length
supertrend_anysource(source, factor, atr_length)
Parameters:
source
factor
atr_length

SessionAndTimeFct_publicLibrary "SessionAndTimeFct_public"
is_in_session(sessionTime, sessionTimeZone)
: Check if actual bar is in specific session with specific time zone
Parameters:
sessionTime
sessionTimeZone
is_session_start(sessionTime, sessionTimeZone)
: Check if actual bar the first bar of a specific session
Parameters:
sessionTime
sessionTimeZone
is_new_day(timeZone)
: Check if a new day started
Parameters:
timeZone
is_new_week(timeZone)
: Check if a new week started
Parameters:
timeZone
is_new_month(timeZone)
: Check if a new month started
Parameters:
timeZone
is_element_to_show_with_tf_up(base, value)
: Check if an element is to show compared to a specific timeframe >
Parameters:
base
value
is_element_to_show_with_tf_down(base, value)
: Check if an element is to show compared to a specific timeframe <
Parameters:
base
value

Drawings_publicLibrary "Drawings_public"
: Functions to manage drawings on the chart
extend_line(lineId, labelId)
: Extend specific line with its label
Parameters:
lineId
labelId
update_line_coordinates(lineId, labelId, x1, y1, x2, y2)
: Update specific line coordinates with its label
Parameters:
lineId
labelId
x1
y1
x2
y2
update_label_coordinates(labelId, value)
: Update coordinates of a label
Parameters:
labelId
value
delete_line(lineId, labelId)
: Delete specific line with its label
Parameters:
lineId
labelId
update_box_coordinates(boxId, labelId, left, top, right, bottom)
: Update specific box coordinates with its label
Parameters:
boxId
labelId
left
top
right
bottom
delete_box(boxId, labelId)
: Delete specific box with its label
Parameters:
boxId
labelId

DataChartLibrary "DataChart"
Library to plot scatterplot or heatmaps for your own set of data samples
draw(this)
draw contents of the chart object
Parameters:
this : Chart object
Returns: current chart object
init(this)
Initialize Chart object.
Parameters:
this : Chart object to be initialized
Returns: current chart object
addSample(this, sample, trigger)
Add sample data to chart using Sample object
Parameters:
this : Chart object
sample : Sample object containing sample x and y values to be plotted
trigger : Samples are added to chart only if trigger is set to true. Default value is true
Returns: current chart object
addSample(this, x, y, trigger)
Add sample data to chart using x and y values
Parameters:
this : Chart object
x : x value of sample data
y : y value of sample data
trigger : Samples are added to chart only if trigger is set to true. Default value is true
Returns: current chart object
addPriceSample(this, priceSampleData, config)
Add price sample data - special type of sample designed to measure price displacements of events
Parameters:
this : Chart object
priceSampleData : PriceSampleData object containing event driven displacement data of x and y
config : PriceSampleConfig object containing configurations for deriving x and y from priceSampleData
Returns: current chart object
Sample
Sample data for chart
Fields:
xValue : x value of the sample data
yValue : y value of the sample data
ChartProperties
Properties of plotting chart
Fields:
title : Title of the chart
suffix : Suffix for values. It can be used to reference 10X or 4% etc. Used only if format is not format.percent
matrixSize : size of the matrix used for plotting
chartType : Can be either scatterplot or heatmap. Default is scatterplot
outliersStart : Indicates the percentile of data to filter out from the starting point to get rid of outliers
outliersEnd : Indicates the percentile of data to filter out from the ending point to get rid of outliers.
backgroundColor
plotColor : color of plots on the chart. Default is color.yellow. Only used for scatterplot type
heatmapColor : color of heatmaps on the chart. Default is color.red. Only used for heatmap type
borderColor : border color of the chart table. Default is color.yellow.
plotSize : size of scatter plots. Default is size.large
format : data representation format in tooltips. Use mintick.percent if measuring any data in terms of percent. Else, use format.mintick
showCounters : display counters which shows totals on each quadrants. These are single cell tables at the corners displaying number of occurences on each quadrant.
showTitle : display title at the top center. Uses the title string set in the properties
counterBackground : background color of counter table cells. Default is color.teal
counterTextColor : text color of counter table cells. Default is color.white
counterTextSize : size of counter table cells. Default is size.large
titleBackground : background color of chart title. Default is color.maroon
titleTextColor : text color of the chart title. Default is color.white
titleTextSize : text size of the title cell. Default is size.large
addOutliersToBorder : If set, instead of removing the outliers, it will be added to the border cells.
useCommonScale : Use common scale for both x and y. If not selected, different scales are calculated based on range of x and y values from samples. Default is set to false.
plotchar : scatter plot character. Default is set to ascii bullet.
ChartDrawing
Chart drawing objects collection
Fields:
properties : ChartProperties object which determines the type and characteristics of chart being plotted
titleTable : table containing title of the chart.
mainTable : table containing plots or heatmaps.
quadrantTables : Array of tables containing counters of all 4 quandrants
Chart
Chart type which contains all the information of chart being plotted
Fields:
properties : ChartProperties object which determines the type and characteristics of chart being plotted
samples : Array of Sample objects collected over period of time for plotting on chart.
displacements : Array containing displacement values. Both x and y values
displacementX : Array containing only X displacement values.
displacementY : Array containing only Y displacement values.
drawing : ChartDrawing object which contains all the drawing elements
PriceSampleConfig
Configs used for adding specific type of samples called PriceSamples
Fields:
duration : impact duration for which price displacement samples are calculated.
useAtrReference : Default is true. If set to true, price is measured in terms of Atr. Else is measured in terms of percentage of price.
atrLength : atrLength to be used for measuring the price based on ATR. Used only if useAtrReference is set to true.
PriceSampleData
Special type of sample called price sample. Can be used instead of basic Sample type
Fields:
trigger : consider sample only if trigger is set to true. Default is true.
source : Price source. Default is close
highSource : High price source. Default is high
lowSource : Low price source. Default is low
tr : True range value. Default is ta.tr

VolumeIndicatorsLibrary "VolumeIndicators"
This is a library of 'Volume Indicators'.
It aims to facilitate the grouping of this category of indicators, and also offer the customized supply of the source, not being restricted to just the closing price.
Indicators:
1. Volume Moving Average (VMA):
Moving average of volume. Identify trends in trading volume.
2. Money Flow Index (MFI): Measures volume pressure in a range of 0 to 100.
Calculates the ratio of volume when the price goes up and when the price goes down
3. On-Balance Volume (OBV):
Identify divergences between trading volume and an asset's price.
Sum of trading volume when the price rises and subtracts volume when the price falls.
4. Accumulation/Distribution (A/D):
Identifies buying and selling pressure by tracking the flow of money into and out of an asset based on volume patterns.
5. Chaikin Money Flow (CMF):
A variation of A/D that takes into account the daily price variation and weighs trading volume accordingly.
6. Volume Oscillator (VO):
Identify divergences between trading volume and an asset's price. Ratio of change of volume, from a fast period in relation to a long period.
7. Positive Volume Index (PVI):
Identify the upward strength of an asset. Volume when price rises divided by total volume.
8. Negative Volume Index (NVI):
Identify the downward strength of an asset. Volume when price falls divided by total volume.
9. Price-Volume Trend (PVT):
Identify the strength of an asset's price trend based on its trading volume. Cumulative change in price with volume factor
vma(length, maType, almaOffset, almaSigma, lsmaOffSet)
@description Volume Moving Average (VMA)
Parameters:
length : (int) Length for moving average
maType : (int) Type of moving average for smoothing
almaOffset : (float) Offset for Arnauld Legoux Moving Average
almaSigma : (float) Sigma for Arnauld Legoux Moving Average
lsmaOffSet : (float) Offset for Least Squares Moving Average
Returns: (float) Moving average of Volume
mfi(source, length)
@description MFI (Money Flow Index).
Uses both price and volume to measure buying and selling pressure in an asset.
Parameters:
source : (float) Source of series (close, high, low, etc.)
length
Returns: (float) Money Flow series
obv(source)
@description On Balance Volume (OBV)
Same as ta.obv(), but with customized type of source
Parameters:
source : (float) Series
Returns: (float) OBV
ad()
@description Accumulation/Distribution (A/D)
Returns: (float) Accumulation/Distribution (A/D) series
cmf(length)
@description CMF (Chaikin Money Flow).
Measures the flow of money into or out of an asset over time, using a combination of price and volume, and is used to identify the strength and direction of a trend.
Parameters:
length
Returns: (float) Chaikin Money Flow series
vo(shortLen, longLen, maType, almaOffset, almaSigma, lsmaOffSet)
@description Volume Oscillator (VO)
Parameters:
shortLen : (int) Fast period for volume
longLen : (int) Slow period for volume
maType : (int) Type of moving average for smoothing
almaOffset
almaSigma
lsmaOffSet
Returns: (float) Volume oscillator
pvi(source)
@description Positive Volume Index (PVI)
Same as ta.pvi(), but with customized type of source
Parameters:
source : (float) Series
Returns: (float) PVI
nvi(source)
@description Negative Volume Index (NVI)
Same as ta.nvi(), but with customized type of source
Parameters:
source : (float) Series
Returns: (float) PVI
pvt(source)
@description Price-Volume Trend (PVT)
Same as ta.pvt(), but with customized type of source
Parameters:
source : (float) Series
Returns: (float) PVI
store - larger data storage for complex item typesLibrary "store"
Object/Property Storage System Semi-Simplified. .
It's a helpful toolset while designing UDT's as it remains flexible,
this helps in not having to remap an entire script while tinkering.
Set an object up, and add as man properties as yyou wish.
a property can be one of any pine built in types. so a single
object can contain sa, ohlc each with a color, a float, an assigned int
and those 4 props each have 3 sub-assigned values.
as in demo, the alternating table object has 2 different tables
it's a pseudo more complex wa to create our own flexible
version of a UDT, but that will not ~break~ on library updates
so you can update awa without fear, as this libb will no change
saving ou the hassle of creating UDT's that continually change.
set(dict, _object, _prop, _item)
Add/Updates item to storage. Autoselects subclass dictionary on set
Parameters:
dict : (dictionary) dict.type subdictionary (req for overload)
_object : (string) object name
_prop
_item : () item to set
Returns: item item wwith column/row
set(dict, _object, _prop, _item)
Parameters:
dict
_object
_prop
_item
set(dict, _object, _prop, _item)
Parameters:
dict
_object
_prop
_item
set(dict, _object, _prop, _item)
Parameters:
dict
_object
_prop
_item
set(dict, _object, _prop, _item)
Parameters:
dict
_object
_prop
_item
set(dict, _object, _prop, _item)
Parameters:
dict
_object
_prop
_item
set(dict, _object, _prop, _item)
Parameters:
dict
_object
_prop
_item
set(dict, _object, _prop, _item)
Parameters:
dict
_object
_prop
_item
set(dict, _object, _prop, _item)
Parameters:
dict
_object
_prop
_item
set(dict, _object, _prop, _item)
Parameters:
dict
_object
_prop
_item
set(dict, _index, _item)
Parameters:
dict
_index
_item
set(dict, _index, _item)
Parameters:
dict
_index
_item
set(dict, _index, _item)
Parameters:
dict
_index
_item
set(dict, _index, _item)
Parameters:
dict
_index
_item
set(dict, _index, _item)
Parameters:
dict
_index
_item
set(dict, _index, _item)
Parameters:
dict
_index
_item
set(dict, _index, _item)
Parameters:
dict
_index
_item
set(dict, _index, _item)
Parameters:
dict
_index
_item
set(dict, _index, _item)
Parameters:
dict
_index
_item
set(dict, _index, _item)
Parameters:
dict
_index
_item
get(typedict, _object, _prop)
Get item by object name and property (string)
Parameters:
typedict : (dict) dict.type subdictionary (req for overload)
_object : (string) object name
_prop
Returns: item from storage
get(typedict, _object, _prop)
Parameters:
typedict
_object
_prop
get(typedict, _object, _prop)
Parameters:
typedict
_object
_prop
get(typedict, _object, _prop)
Parameters:
typedict
_object
_prop
get(typedict, _object, _prop)
Parameters:
typedict
_object
_prop
get(typedict, _object, _prop)
Parameters:
typedict
_object
_prop
get(typedict, _object, _prop)
Parameters:
typedict
_object
_prop
get(typedict, _object, _prop)
Parameters:
typedict
_object
_prop
get(typedict, _object, _prop)
Parameters:
typedict
_object
_prop
get(typedict, _object, _prop)
Parameters:
typedict
_object
_prop
get(typedict, _index)
Parameters:
typedict
_index
get(typedict, _index)
Parameters:
typedict
_index
get(typedict, _index)
Parameters:
typedict
_index
get(typedict, _index)
Parameters:
typedict
_index
get(typedict, _index)
Parameters:
typedict
_index
get(typedict, _index)
Parameters:
typedict
_index
get(typedict, _index)
Parameters:
typedict
_index
get(typedict, _index)
Parameters:
typedict
_index
get(typedict, _index)
Parameters:
typedict
_index
get(typedict, _index)
Parameters:
typedict
_index
remove(typedict, _object, _prop)
Remove a specific property from an object
Parameters:
typedict : (dict) dict.type subdictionary (req for overload)
_object : (string) object name
_prop
Returns: item from storage
remove(typedict, _object, _prop)
Parameters:
typedict
_object
_prop
remove(typedict, _object, _prop)
Parameters:
typedict
_object
_prop
remove(typedict, _object, _prop)
Parameters:
typedict
_object
_prop
remove(typedict, _object, _prop)
Parameters:
typedict
_object
_prop
remove(typedict, _object, _prop)
Parameters:
typedict
_object
_prop
remove(typedict, _object, _prop)
Parameters:
typedict
_object
_prop
remove(typedict, _object, _prop)
Parameters:
typedict
_object
_prop
remove(typedict, _object, _prop)
Parameters:
typedict
_object
_prop
remove(typedict, _object, _prop)
Parameters:
typedict
_object
_prop
remove(typedict, _index)
Parameters:
typedict
_index
remove(typedict, _index)
Parameters:
typedict
_index
remove(typedict, _index)
Parameters:
typedict
_index
remove(typedict, _index)
Parameters:
typedict
_index
remove(typedict, _index)
Parameters:
typedict
_index
remove(typedict, _index)
Parameters:
typedict
_index
remove(typedict, _index)
Parameters:
typedict
_index
remove(typedict, _index)
Parameters:
typedict
_index
remove(typedict, _index)
Parameters:
typedict
_index
remove(typedict, _index)
Parameters:
typedict
_index
delete(_dict, _object)
Remove a complete Object and all props
Parameters:
_dict
_object : (string) object name
Returns: item from storage
delete(_dict, _index)
Parameters:
_dict
_index
wipe(_dict, _object, _prop)
Remove Property slot for all 10 item types
Parameters:
_dict : (dictionary) The full dictionary item
_object : (string) object name
_prop
Returns: item from storage
wipe(_dict, _index)
Parameters:
_dict
_index
init(_Objlim, _Proplim)
Create New Dictionary ready to use (9999 size limit - (_objlim +_Proplim) for row/column 0)
# Full dictionary with all types
> start with this
Parameters:
_Objlim : (int) maximum objects (think horizontal)
_Proplim : (int) maximum properties per obj (vertical)
Returns: dictionary typoe object
boxdict
Fields:
keys
items
booldict
Fields:
keys
items
colordict
Fields:
keys
items
floatdict
Fields:
keys
items
intdict
Fields:
keys
items
labeldict
Fields:
keys
items
linedict
Fields:
keys
items
linefilldict
Fields:
keys
items
stringdict
Fields:
keys
items
tabledict
Fields:
keys
items
dictionary
Fields:
boxs
bools
colors
floats
ints
labels
lines
linefills
strings
tables
keys
item
Fields:
objCol
propRow
object
property
actionItem
dictionaries
Dictionar OF dictionaries
Fields:
dicts

string_utilsLibrary "string_utils"
Collection of string utilities that can be used to replace sub-strings in a string and string functions
that are not part of the standard library.
This a more simple replacement of my previous string_variables library since it uses types for better
performance due to data locality and methods that give a more intuitive API.
Feature ScalingLibrary "Feature_Scaling"
FS: This library helps you scale your data to certain ranges or standarize, normalize, unit scale or min-max scale your data in your prefered way. Mostly used for normalization purposes.
minmaxscale(source, min, max, length)
minmaxscale: Min-max normalization scales your data to set minimum and maximum range
Parameters:
source
min
max
length
Returns: res: Data scaled to the set minimum and maximum range
meanscale(source, length)
meanscale: Mean normalization of your data
Parameters:
source
length
Returns: res: Mean normalization result of the source
standarize(source, length, biased)
standarize: Standarization of your data
Parameters:
source
length
biased
Returns: res: Standarized data
unitlength(source, length)
unitlength: Scales your data into overall unit length
Parameters:
source
length
Returns: res: Your data scaled to the unit length
TableBuilderLibrary "TableBuilder"
A helper library to make it simpler to create tables in pinescript
This is a simple table building library that I created because I personally feel that the built-in table building method is too verbose. It features chaining methods and variable arguments.
There are many features that are lacking because the implementation is early, and there may be antipatterns because I am not familiar with the runtime behavior like pinescript. If you have any comments on code improvements or features you want, please comment :D

SILLibrary "SIL"
mean_src(x, y)
calculates moving average : x is the source of price (OHLC) & y = the lookback period
Parameters:
x
y
stan_dev(x, y, z)
calculates standard deviation, x = source of price (OHLC), y = the average lookback, z = average given prior two float and intger inputs, call the f_avg_src() function in f_stan_dev()
Parameters:
x
y
z
vawma(x, y)
calculates volume weighted moving average, x = source of price (OHLC), y = loookback period
Parameters:
x
y
gethurst(x, y, z)
calculates the Hurst Exponent and Hurst Exponent average, x = source of price (OHLC), y = lookback period for Hurst Exponent Calculation, z = lookback period for average Hurst Exponent
Parameters:
x
y
z
