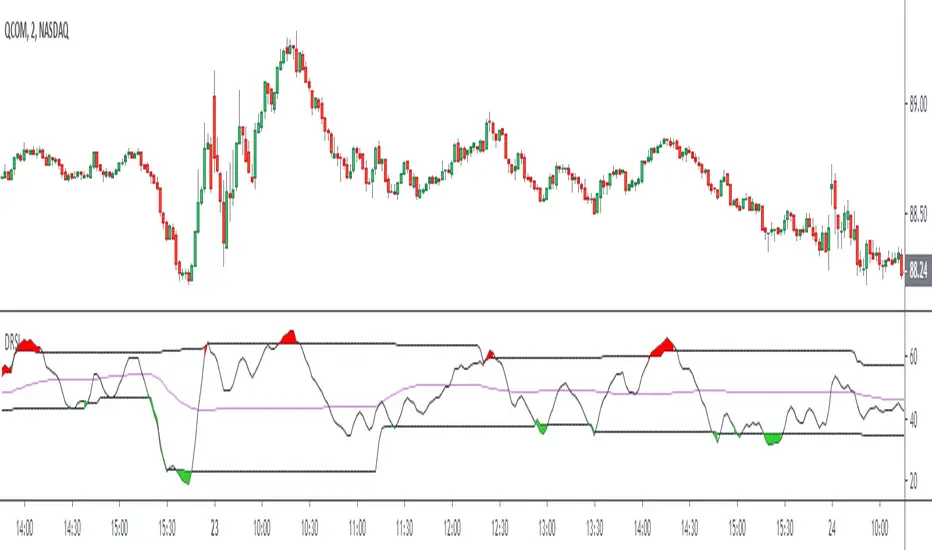
Dynamic RSIThe Dynamic RSI indicator is a kind of exponential RSI. The overbought and oversold levels (respectively HiLine and LoLine) are calculated according to the recent highest and lowest values of the Dynamic RSI line.
Oversold
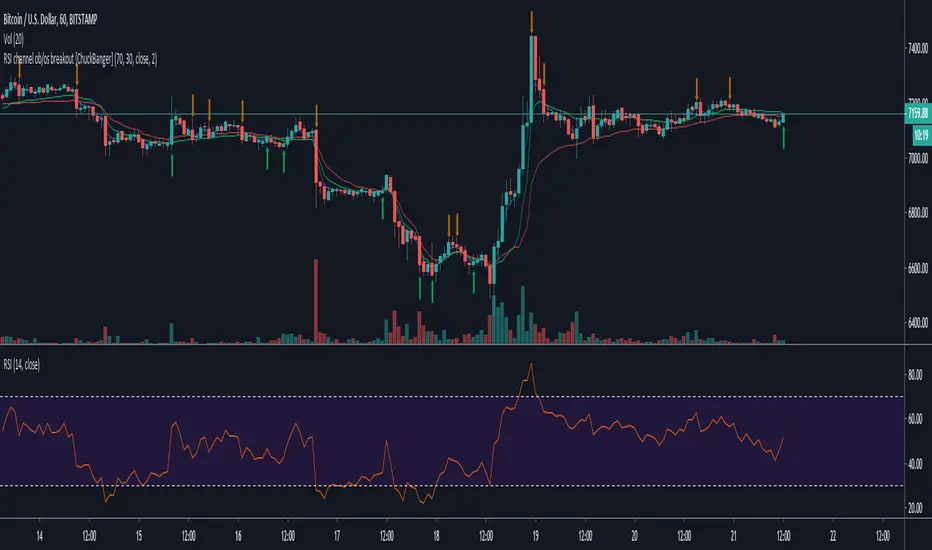
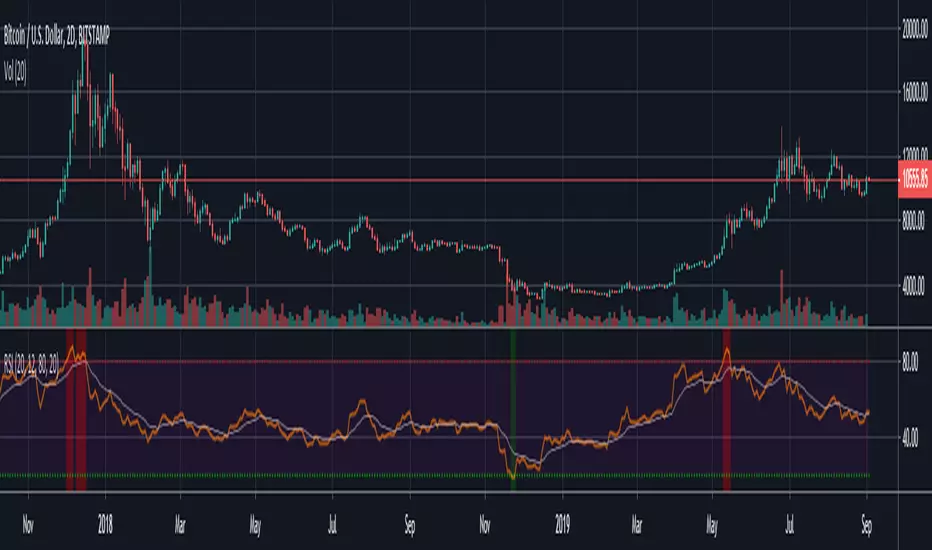
RSI channel ob/os breakout [ChuckBanger]This is a breakout signal script based on reverse engineering of RSI. It shows a channel of overbought and oversold readings that the trader can sett in settings. When low crosses under lower line it shows bullish signal and when high is crossing upper line it shows a bearish signal. The script also has wilder's moving average as filter instead of high/low.
Good luck traders!
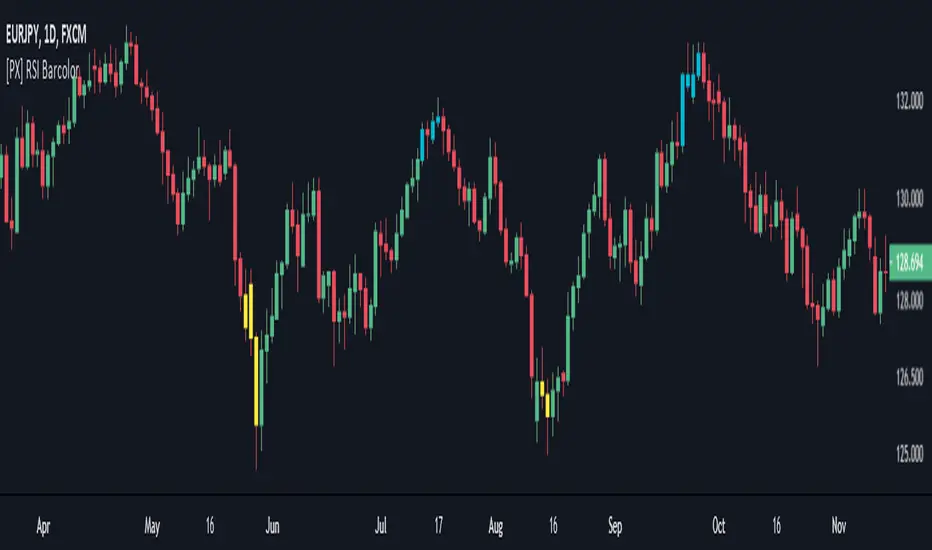
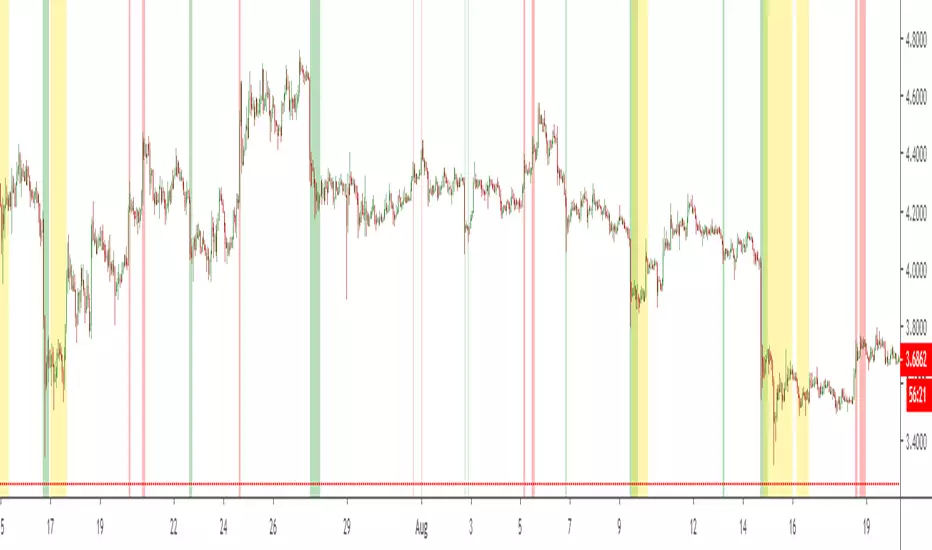
[PX] RSI BarcolorThis script simply colors the candles based on the defined "overbought" and "oversold" RSI-levels set in the input section of the indicator.
If the price is below the oversold level, the candle is colored in yellow.
If the price is above the overbought level, the candle is colored in aqua.
If the price moves back between both levels, no color will be applied.
Might be useful for some of you ;)
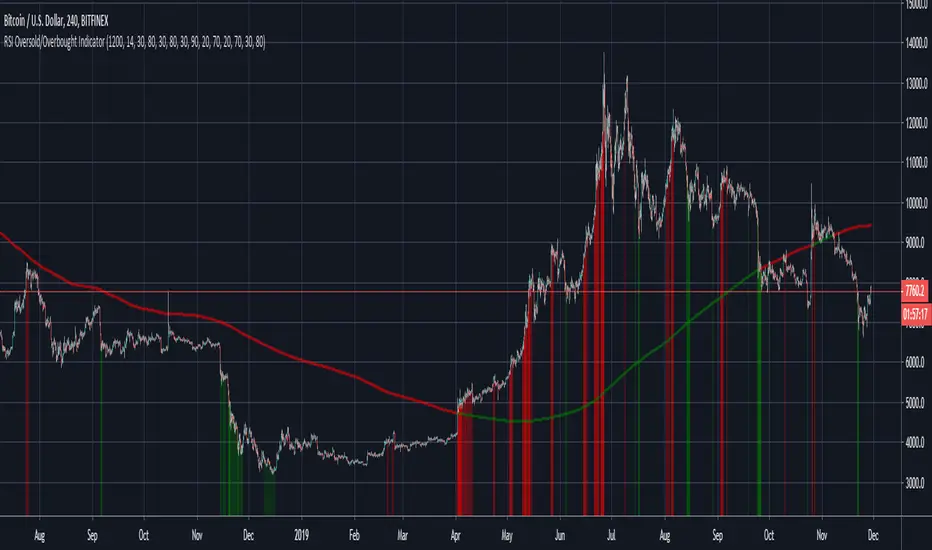
RSI Oversold/Overbought IndicatorThis is a very simple but quite powerful indicator which looks at the RSI simultaneously over the 4h, Daily and Weekly timeframes, and places bands on the chart when one or more timeframes move into oversold/overbought territory. For further filtering I use the 200 day SMA to determine if we are in a Bull or Bear market, which puts a bias on the RSI (30/80 in a Bull market and 20/70 in a Bear market).
The deeper the colour, the more oversold the market is. The weekly RSI can be used as an early warning sign, with the Daily/ 4h RSI useful to identify local peaks.
WaveTrend Oscillator + Divergence + Direction Detection +AlertsMake this version of the famous WaveTrend indicator has the following characteristics:
- WaveTrend direction detection
- Customizable overbought and oversold level (set by default just like the original version)
- Possibility to modify the length of the channel (set by default same as the original version)
- Possibility of modifying mobile period (set by default same as the original version)
- Show ONLY overbought sales.
- Show all sales.
- Show ONLY purchases in oversold.
- Show all purchases.
- See histogram.
- See half signal.
- Paint Bars.
- Modification of colors.
Alerts:
The indicator has the following alerts:
- Sales in oversold
- All Sales
- Purchases in oversold
- All Purchases
- Purchases / Overbought sales / Sales
- All Sales / Purchases
- Change WT Direction
NOTE: This single indicator should not be taken as a trading strategy is only a tool for the trader that gives a sense of depth market and potential opportunities for purchase / sale which must be evaluated in the context generally used this indicator to look for positions in areas of overbought / sell, also for detecting differences, other aspects such as the direction of Wavetrend, levels, histogram, etc, also provide useful information.
Release Notes: Add a field to change reaction and color change direction WT, is set to 1 as fast (default), better greater number address filter but is slower.
Release Notes: Add a Hidden Divergences detector and Regulars (bulls and the bears), from setup can activate them, also can turn off the labels and leave only the lines, configure it to your liking.
NOTE: SCRIPT IN SPANISH

Modified Stochastic MACD Oscillator - Vitali ApirineFor all MACD enthusiasts out there, hot off the press, I present this next generation "Modified Stochastic MACD Oscillator" employing PSv4.0, originally formulated by Vitali Apirine for TASC - November 2019 Traders Tips. Just when you may have thought it was the end of the evolutionary line for MACD technology, it's not! Basically it's a NEW hybridization of a MACD and stochastic rolled into one, maintaining scale symmetry to support overbought/oversold defined levels across time frames and assets, unlike the ordinary MACD. On the ordinary MACD, this is virtually impossible to do properly, and trust me, I have tried with zero success. My less than 40 line implementation, at initial release, is a heavily modified version of the original indicator using novel techniques, surpassing not only Apirine's original intended design, but also the "contemporary MACD" provided by TV, visible on the bottom of the chart.
Utilizing the "Power of Pine", I included the maximum amount of features I could surmise in an ultra small yet powerful package. I provided an abundance of control over each feature as an attempt to create another heavenly MACD experience in an open source package, only rivaled by my "Ultimate MACD Super Pack". Configurations are displayed above in multiple scenarios that should be suitable for most traders. Of notable mention, I rescaled the oscillator more towards a zero mean unity scale, while still leaving the waveforms completely intact.
Features List Includes:
Dark Background - Easily disabled in indicator Settings->Style for "Light" charts or with Pine commenting
AND much, much more... you have the source!
For those of you who are new to Pine Script, this script also may help you understand advanced programming techniques in Pine and how they may be utilized in a most effective manner. I would like to see Tradingview become the go to platform for the best MACD indicators attainable with this contribution to the TV community. This is commonly what my dense intricate code looks like behind the veil, and if you are wondering why there is no notes, that's because the notation is in the variable naming. If you wish to contribute additional ideas, please do so below in the comments about all things MACD in Pine.
NOTICE: Copy pasting bandits who may be having nefarious thoughts, DO NOT attempt this, because this may violate Tradingview's terms, conditions and/or house rules. "WE" are always watching the TV community vigilantly for mischievous behaviors and actions that exploit well intended authors for the purpose of unscrupulously increasing brownie points in reputation scores. Hiding behind a "protected" wall may not protect you from investigation and account penalization by TV staff. Be respectful, and don't just throw a meaningless feature in there branding it as "your" gizmo. Fair enough? Alrighty then... I firmly believe in "innovating" future state-of-the-art indicators, and please contact me if you wish to do so.
The comments section below is solely just for commenting and other remarks, ideas, compliments, etc... regarding only this indicator, not others. When available time provides itself, I will consider your inquiries, thoughts, and concepts presented below in the comments section if you do have any questions or comments regarding this indicator. When my indicators achieve more prevalent use by TV members, I may implement more ideas when they present themselves as worthy additions. As always, "Like" it if you simply just like it with a proper thumbs up, and also return to my scripts list occasionally for additional postings. Have a profitable future everyone!

MS MONEY CCI SQUEEZEAbout
I have used this indicator to find many lucrative opportunities. This indicator takes the moving average of CCI in custom, volatility-specific conditions. CCI measures "overbought" in the red-shaded region and "Oversold" in the green-shaded region. The shaded regions do not constitute a buy/sell signal alone, the MS CCI Squeeze is best used when market conditions agree and is best used when the user has fundamental reasoning for "reversal-like" situations to align. The MS CCI Squeeze will soon have a synergistic partner called "MS RSI Squeeze" indicator that will look similar to help better measure volatility and strength trend.
About the Commodity Channel Index (CCI)
The commodity channel index (CCI) is an oscillator originally introduced by Donald Lambert in 1980. Since its introduction, the indicator has grown in popularity and is now a very common tool for traders in identifying cyclical trends not only in commodities, but also equities (stocks) and currency trading.
How to set an Alert
If the user wants to set an alert , click on one of the support/ resistance lines (black-dashed) near the zero mark. Clicking on the horizontal line above or below the zero line will populate a yellow arrow which will allow you to set alerts when wanted.
Please Read For Better Efficiency
When using this indicator, keep an eye out for harmonic patterns, both bullish and bearish head and shoulders patterns for "HIDDEN" breakout opportunities.
Please like, follow and share and I will continue building better indicators.

How To Use Dynamic ZonesExample of how to apply and use Dynamic Zones with an indicator by injecting it's source into my adaptation of the original idea by Leo Zamansky, Ph.D., and David Stendahl.
• Load your desired oscillating indicator on your chart (CCI, RSI, etc).
• Load my "How To Use Dynamic Zones" indicator on your chart.
• In the "How To Use Dynamic Zones" indicator settings choose your desired oscillating indicator as the Oscillator Source.
You will now have dynamic overbought and oversold levels. I have also included alerts which may be used to indicate when these conditions occur.
If desired you may repeat the above process by loading additional indicators along with additional copies of my indicator to use with each oscillator.
Oscillator Source: CLOSE uses your chosen indicator as a source or you may use price as a source
Sample Length: 70 uses number of previous values for evaluating
Hi is Above X% of Sample: 88 sets overbought zone
Lo is Below X% of Sample: 88 sets oversold zone
The simplest explanation of what these default settings are doing is that they take 70 previous values of your chosen indicator, then create an overbought level that is above 88% of those previous values and an oversold level that is below 88% of those previous values. As new bars form the levels are dynamically reevaluated and updated.
---
"This investing style follows a very simple form of logic: Enter the market only when an oscillator has moved far above or below traditional trading levels. However, these oscillator driven systems lack the ability to evolve with the market because they use fixed buy and sell zones. Traders typically use one set of buy and sell zones for a bull market and substantially different zones for a bear market. And therein lies the problem.
Once traders begin introducing their market opinions into trading equations, by changing the zones, they negate the system’s mechanical nature. The objective is to have a system automatically define its own buy and sell zones and thereby profitably trade in any market — bull or bear. Dynamic zones offer a solution to the problem of fixed buy and sell zones for any oscillator-driven system."
Reference: Stocks & Commodities V15:7 (306-310): Dynamic Zones by Leo Zamansky, Ph.D., and David Stendahl
---
NOTICE: This is an example script and not meant to be used as an actual strategy. By using this script or any portion thereof, you acknowledge that you have read and understood that this is for research purposes only and I am not responsible for any financial losses you may incur by using this script!

Function : Stochastic Oscillator Here is the Stochastic Oscillator function.
Now you can easily use length with mutable variables !!

Function : Relative Strength Index The relative strength index function is defined.
Now you can easily use length with mutable variables !!

Stochastic [Gu5]To know if we are in range, I recommend my other indicator "Trend Channel Gu5"
Stochastic shows overbought / oversold
--
Para saber cuando no hay tendencia y estamos en rango, recomiendo usar mi indicador "Trend Channel Gu5"
El cruce de K & D nos muestra cundo el mercado esta en sobre-compra o sobre-venta
Las alertas con banderas ayudan a visualizar mas claramente, evitando las alertas duplicadas

RSI_EMA_FlashesCombination of Chris Moody's RSI + EMA with the background flashes from the Ultimate MTF RSI. Made by request.
Elgrand - Overbought/sold Rsi + Stochastic zonesVisualize on your chart when price in an oversold or overbought zone. A combination of Rsi and Stochasticrsi is used for higher probability. Wait for an zone to be displayed and then wait for price to exit a zone. Once this happens check candlestick patterns and support/resistance "lines" to find appropiate stoplosses for you entry or exit
Elgrand - Overbought Rsi and StochRsi on multiple timeframesScript to visualize the overbought and oversold condition on multiple timeframes. Good way to determine when you have a lower risk for enter a trade or to determine when you need to be on the lookout to sell.


Function StochRSI Stochastic Relative Strength Index developed by Tushar Chande and Stanley Kroll.
This script has been written to eliminate the period variable.(Integer)
Thus, it can be used comfortably in adaptive period scripts ! (For example : Adaptive Moving Average , KAMA , FAMA .. etc. )
All efforts goes to ChaosTrader () ,
RicardoSantos () ,
Hpotter for barcolor codes (iff) ()
I hope it will help your new ideas . Best regards ! Noldo .

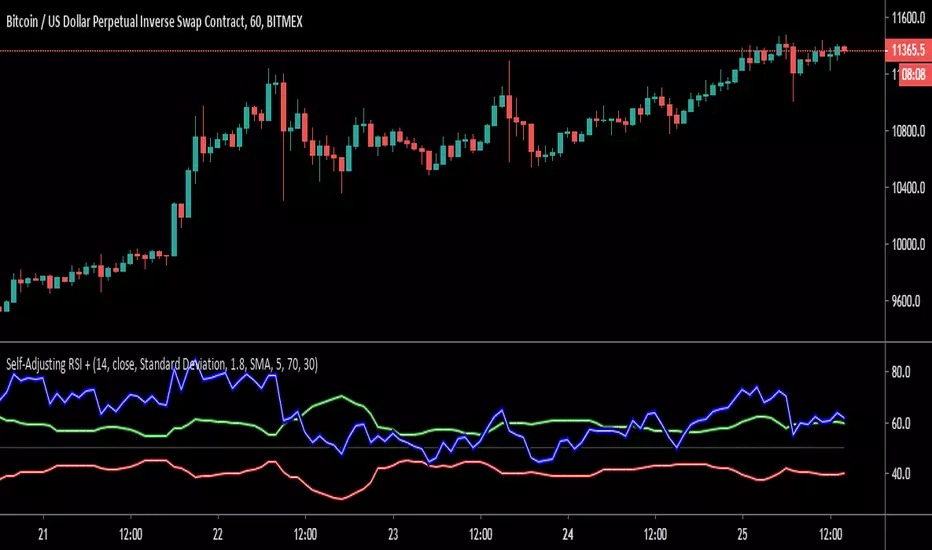
Self-Adjusting RSI +Here is an open source (no request needed!) version of the Self-Adjusting RSI by David Sepiashvili.
Published in Stocks & Commodities V. 24:2 (February, 2006): The Self-Adjusting RSI
David Sepiashvili's article, "The Self-Adjusting RSI," presents a technique to adjust the traditional RSI overbought and oversold thresholds so as to ensure that 70-80% of RSI values lie between the two thresholds. Sepiashvili presents two algorithms for adjusting the thresholds. One is based on standard deviation, the other on a simple moving average of the RSI.
This script allows you to choose between plotting the Self-Adjusting bands or the traditional bands. You can also plot a smoothed RSI (SMA or EMA) and change the theme color for dark or light charts.
If you find this code useful, please pass it forward by sharing open source!
Thank you to all of the open source heroes out there!
"If I have seen a little further it is by standing on the shoulders of Giants."

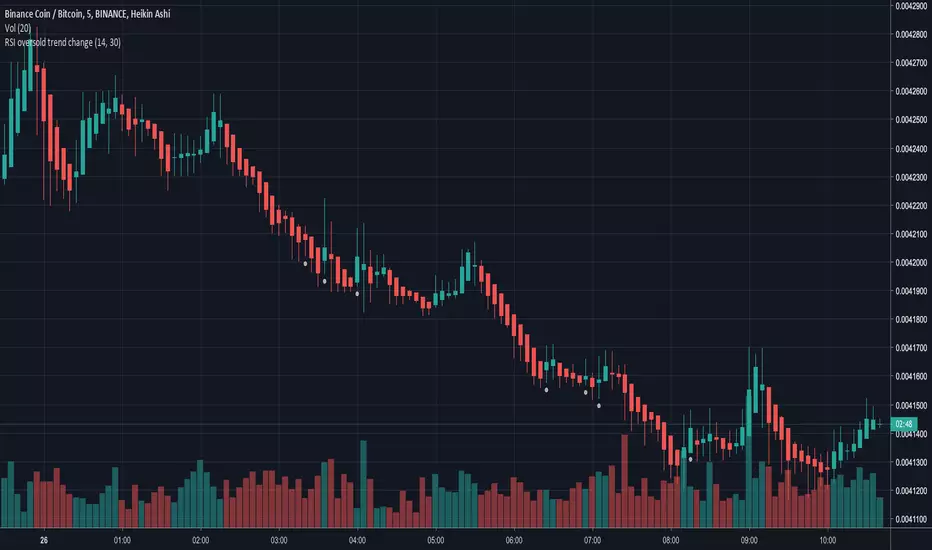
RSI oversold trend changeSimple script that will plot a circle indication on the chart when RSI returns above 30 from oversold position.
Also allows you to create a custom alert.
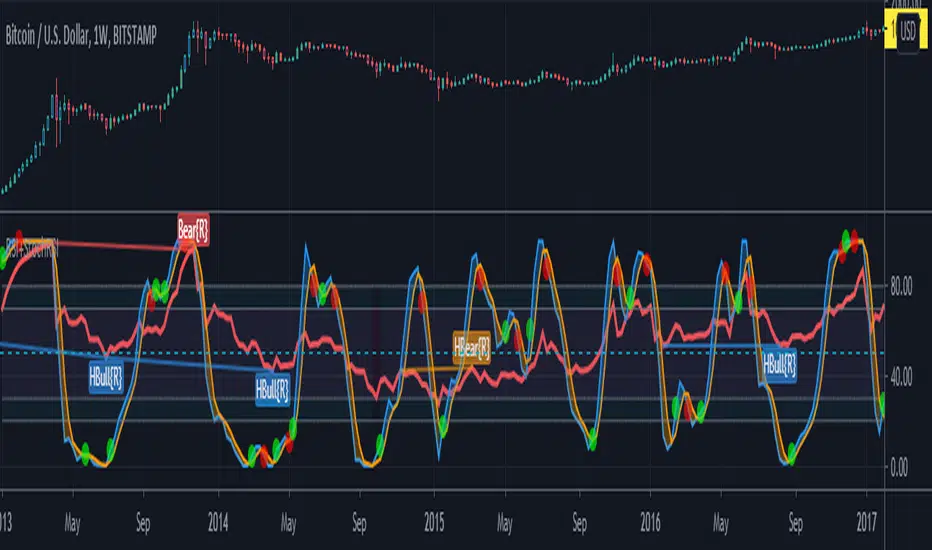
Spiky Iguana Multi RSI Bands (Reverse RSI for the Price) by RRBSpiky Iguana Multi RSI Bands by RagingRocketBull 2018
Version 1.0
This indicator shows multiple RSI Bands with prices corresponding to specified overbought/oversold RSI levels.
It is used to extrapolate the exact price levels currently matching a given set of RSI levels based on prior price/RSI levels action.
You can think of it as a reverse RSI where RSI levels are moving dynamically around the price instead of price bouncing between straight lines.
Features:
- 6+6 = 12 customizable Overbought(R)/Oversold(S) RSI Levels + 6 Mean(M) lines
- Multicolor levels/fill ranges
- Show/Hide specific S/R/M levels and fill ranges
1. uses plot*, fill and is based on RSIBANDS_LB
Good Luck! Feel free to explore and learn from the code

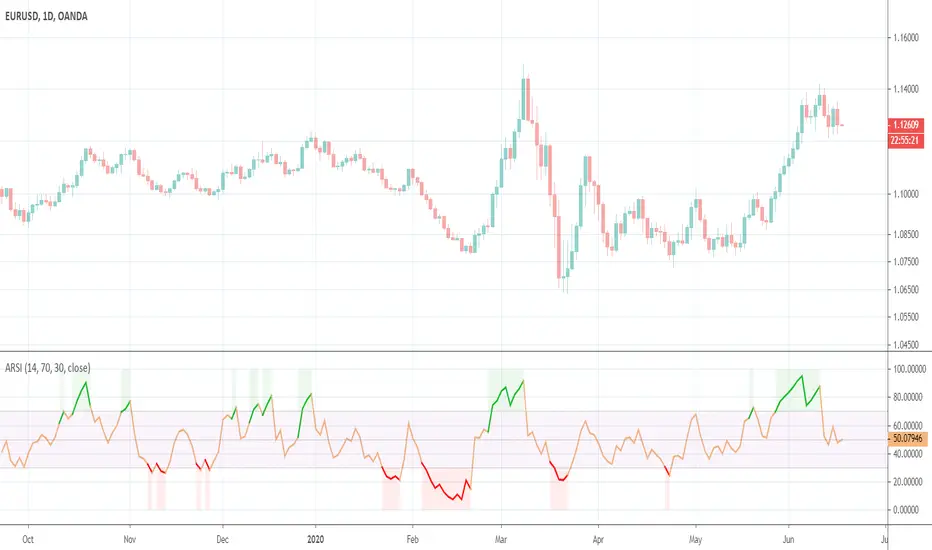
Asymmetrical RSIThis indicator was originally developed by Sylvain Vervoort (Stocks & Commodities, V.26:11 (October, 2008): "ARSI, The Asymmetrical RSI").