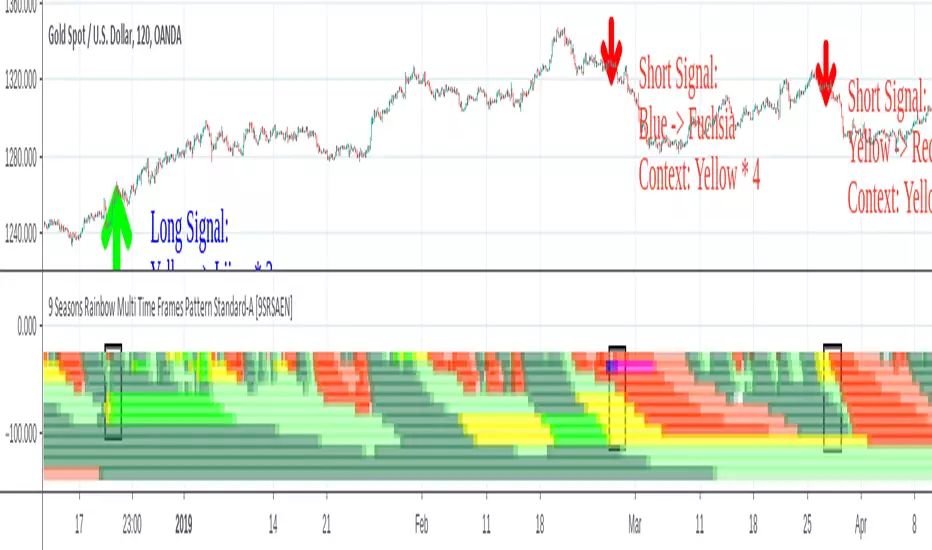
9 Seasons Rainbow Multi TimeFrames Pattern Standard-A [9SRSAEN]The indicator discovers profitable patterns by associating Price Season of multiple timeframes.
Full Name: 9 Seasons Rainbow - Multiple TimeFrames Associated Price Wave Pattern Indicator
Version: Invite-Only STANDARD-A
This is a sibling version OF “9 Seasons Rainbow Multi TimeFrames Pattern Standard ” with some functions for developing needs, without update notice function.
Language: English
Copyright: 2019
---------- How to use the indicator ----------
Go through the manual and related ideas underneath or follow the tutorials list. Look through the profitable patterns and related cases, wait for or set alert for specific profitable pattern.
---------- Definition: 9 Seasons ----------
A life cycle of Price Wave is divided into 9 Seasons. Each time frame, from 5 minute to 1 month, has 9 seasons, Independent of each other:
Bull (Green)
Bull Pullback (Light Green): a pullback or retracement
Resistance / Overbought (Yellow): a resistance area , may become a Top, or be broken through.
Crazy Bought (Lime): Price is going up in a high volatility , could be a valid breakout, or a Bull Trap.
Neutral (White): a wandering season without direction, evolves into Bull or Bear
Bear (Red)
Bear Bounce (Light Red): Price bounces
Support / Oversold (Blue): a support area , may become a Bottom, or be broken through.
Crazy Sold (Fuchsia): Price is going down in a high volatility , could be a valid breakdown, or a Bear Trap.
---------- Some important evolution between seasons ----------
Resistance / Overbought (Yellow) -> Crazy Bought (Lime):
Bull is breaking through a resistance.
Crazy Bought (Lime) -> Resistance / Overbought (Yellow):
This normally indicates a failed breakout, Price goes back to the resistance.
Crazy Bought (Lime) -> Bull Pullback (Light Green):
This normally indicates Price has risen to a new level
Support / Oversold (Blue) -> Crazy Sold (Fuchsia):
Bear is breaking through a support.
Crazy Sold (Fuchsia) -> Support / Oversold (Blue):
This normally indicates a failed breakdown, Price recovers to the support.
Crazy Sold (Fuchsia) -> Bear Bounce (Light Red):
This normally indicates price has dropped to a new level
---------- Rainbow Ribbons for Multiple TimeFrames ----------
Each ribbon of a rainbow represents a time frame.
The uppermost ribbon represents the shortest-term time frame - current time period of the chart, which is the time frame for trading.
The lowermost ribbon represent longest-term time frame, which work as environment, together with the other medium-term and long-term time frames.
The difference between two frames is 1.4142 fold (square root of 2), if level 1 is 15 minute, level 2 is 15 minute * (square root of 2) .
Examples of time frames in a rainbow:
For STANDARD in 15M: 15M - 21M - 30M - 42M - 60M(1H) - 85M - 120M(2H) - 170M
For PRO in 15M: 15M - 21M - 30M - 42M - 60M(1H) - 85M - 120M(2H) - 170M - 240M(4H) - 339M - 480M(8H) - 679M
---------- Trading Methods ----------
How to open a Long position?
When a profitable Long pattern appears, open small position first based on signal on shortest-term time frame; after retesting and confirming the support, open 2nd position; when it breaks through the resistance, pullbacks and confirms the breakout, open 3rd position.
How to exit a Long position?
Lift the Stop to a confirmed higher low, so that to take advantages of the bull run as possible.
How to open a Short position?
When a profitable Short pattern appears, open small position first based on signal on shortest-term time frame; after retesting and confirming the resistance, open 2nd position; when it breaks through the support, bounces and confirms the breakdown, add 3rd position.
How to exit a Short position?
Lower the Stop to a confirmed lower high, so that to take advantages of the bear run as possible.
---------- Versions Description ----------
The author reserves the right to change the features without advance notice.
PRO:
Invite-Only, with the following advanced features:
12 Ribbons Rainbow displays 9 Seasons of 12 time frames on a chart.
Advanced alert sets allows set alerts on short-term, medium-term, and long-term time frames.
Capability to input different trading instrument to compare with the current ticker.
Full time periods access allows apply it to broadest time periods, from 1 minute to 1 week (if history data is enough)
More new features in updates.
STANDARD:
Invite-Only, with the following advanced features:
8 Ribbons Rainbow displays 9 Seasons of 8 time frames on a chart.
Advanced alert sets allows set alerts on upper and lower frames.
Broad time periods access allows apply it to the most popular time periods, from 15 minute to 1 week (if history data is enough)
More new features in updates.
DEMO:
DEMO version is for trial purpose, having most of the features.
It is applicable to a list of trading instruments and specific time periods (1 hour to 1 day), which may change later without advance notice.
---------- Access to Indicators ----------
Please use DEMO version for Trial
Asking access to Invite-Only PRO and STANDARD versions:
9seasonsrainbowindicator.blogspot.com
Or contact the author.
---------- Install Invite Only: STANDARD & PRO Version----------
Ask access to STANDARD or PRO version
Open the chart -> Indicators (On the Top) -> Invite-Only Scripts (2nd button of the left bar)
Like/Favorite the indicator
Click to install on the chart
---------- About Loading Time ----------
It may take up to 2 minutes for your browser to load a new setting, depending on the your computer and network speed.
---------- List of the author's Indicators ----------
www.tradingview.com
---------- Disclaimer ----------
By using or requesting access to the indicator, you acknowledge that you have read and accepted that the indicator and any related content, including but not limited to: user manual, tutorials, ideas, videos, chats, emails, blog, are for the purpose of trading strategies studying and paper trading.
If a customer or user uses the indicator or related content mentioned above for live trading or investment, she/he should take all risks and be responsible for her/his own trading and investment activities.
---------- Updates ----------
The latest updates override the previous description.
To activate a update: Close the browser, Reopen the chart and apply the indicator.
Overbought
Ichimoku Cloud Daily Offset with Alerts The Skript uses Offsets in both positive and negative direction to give buy and sell alerts.
Use the Script on a daily Timeframe
- No financial advice -
There are 3 Buy and 3 Sell alerts in the Skript.
Buy 1 - B1: Buy e.g. 3%
Buy 2 - B2: Buy e.g. 10%
Buy 3 - B3: Buy e.g. 50%
Sell 1 - S1: Sell e.g. 5%
Sell 2 - S2: Sell e.g. 30%
Sell 3 - S3: Sell e.g. 90%

9 Seasons Rainbow Multiple Time Frames Pattern DEMO [9SRDEN]The indicator discovers profitable patterns by associating Price Season of multiple time frames.
Full Name: 9 Seasons Rainbow - Multiple Time Frames Associated Price Wave Pattern Indicator
This is redefined from “9 Seasons Rainbow Indicator DEMO”, with clearer definition of 9 Seasons and user manual.
Version: DEMO
Language: English
Copyright: 2019
---------- How to use the indicator ----------
Go through the manual and related ideas underneath or follow the tutorials list. Look through the profitable patterns and related cases, wait for or set alert for specific profitable pattern.
---------- Definition: 9 Seasons ----------
A life cycle of Price Wave is divided into 9 Seasons. Each time frame, from 5 minute to 1 month, has 9 seasons, Independent of each other:
Bull (Green)
Bull Pullback (Light Green): a pullback or retracement
Resistance / Overbought (Yellow): a resistance area, may become a Top, or be broken through.
Crazy Bought (Lime): Price is going up in a high volatility, could be a valid breakout, or a Bull Trap.
Neutral (White): a wandering season without direction, evolves into Bull or Bear
Bear (Red)
Bear Bounce (Light Red): Price bounces
Support / Oversold (Blue): a support area, may become a Bottom, or be broken through.
Crazy Sold (Fuchsia): Price is going down in a high volatility, could be a valid breakdown, or a Bear Trap.
---------- Some important evolution between seasons ----------
Resistance / Overbought (Yellow) -> Crazy Bought (Lime):
Bull is breaking through a resistance.
Crazy Bought (Lime) -> Resistance / Overbought (Yellow):
This normally indicates a failed breakout, Price goes back to the resistance.
Crazy Bought (Lime) -> Bull Pullback (Light Green):
This normally indicates Price has risen to a new level
Support / Oversold (Blue) -> Crazy Sold (Fuchsia):
Bear is breaking through a support.
Crazy Sold (Fuchsia) -> Support / Oversold (Blue):
This normally indicates a failed breakdown, Price recovers to the support.
Crazy Sold (Fuchsia) -> Bear Bounce (Light Red):
This normally indicates price has dropped to a new level
---------- Rainbow Ribbons for Multiple Time Frames ----------
Each ribbon of a rainbow represents a time frame.
The uppermost ribbon represents the shortest-term time frame - current time period of the chart, which is the time frame for trading.
The lowermost ribbon represent longest-term time frame, which work as environment, together with the other medium-term and long-term time frames.
The difference between two frames is 1.4142 fold (square root of 2), if level 1 is 15 minute, level 2 is 15 minute * (square root of 2) .
Examples of time frames in a rainbow:
For STANDARD in 15M: 15M - 21M - 30M - 42M - 60M(1H) - 85M - 120M(2H) - 170M
For PRO in 15M: 15M - 21M - 30M - 42M - 60M(1H) - 85M - 120M(2H) - 170M - 240M(4H) - 339M - 480M(8H) - 679M
---------- Trading Methods ----------
How to open a Long position?
When a profitable Long pattern appears, open small position first based on signal on shortest-term time frame; after retesting and confirming the support, open 2nd position; when it breaks through the resistance, pullbacks and confirms the breakout, open 3rd position.
How to exit a Long position?
Lift the Stop to a confirmed higher low, so that to take advantages of the bull run as possible.
How to open a Short position?
When a profitable Short pattern appears, open small position first based on signal on shortest-term time frame; after retesting and confirming the resistance, open 2nd position; when it breaks through the support, bounces and confirms the breakdown, add 3rd position.
How to exit a Short position?
Lower the Stop to a confirmed lower high, so that to take advantages of the bear run as possible.
---------- Versions Description ----------
The features may change later without advance notice.
PRO:
Invite-Only, with the following advanced features:
12 Ribbons Rainbow displays 9 Seasons of 12 time frames on a chart.
Advanced alert sets allows set alerts on short-term, medium-term, and long-term time frames.
Capability to input different trading instrument to compare with the current ticker.
Full time periods access allows apply it to broadest time periods, from 1 minute to 1 week (if history data is enough)
More new features in updates.
STANDARD:
Invite-Only, with the following advanced features:
8 Ribbons Rainbow displays 9 Seasons of 8 time frames on a chart.
Advanced alert sets allows set alerts on upper and lower frames.
Broad time periods access allows apply it to the most popular time periods, from 15 minute to 1 week (if history data is enough)
More new features in updates.
DEMO:
DEMO version is for trial purpose, having most of the features.
It is applicable to a list of trading instruments and specific time periods (1 hour to 1 day), which may change later without advance notice.
---------- Access to Indicators ----------
Please use DEMO version for Trial
Asking access to Invite-Only PRO and STANDARD versions:
9seasonsrainbowindicator.blogspot.com
Or contact the author.
---------- Install Invite Only: STANDARD & PRO Version----------
Ask access to STANDARD or PRO version
Open the chart -> Indicators (On the Top) -> Invite-Only Scripts (2nd button of the left bar)
Like/Favorite the indicator
Click to install on the chart
---------- About Loading Time ----------
It may take up to 2 minutes for your browser to load a new setting, depending on the your computer and network speed.
---------- List of the author's Indicators ----------
www.tradingview.com
---------- Disclaimer ----------
By using or requesting access to the indicator, you acknowledge that you have read and accepted that the indicator and any related content, including but not limited to: user manual, tutorials, ideas, videos, chats, emails, blog, are for the purpose of trading strategies studying and paper trading.
If a customer or user uses the indicator or related content mentioned above for live trading or investment, she/he should take all risks and be responsible for her/his own trading and investment activities.
---------- Updates ----------
The latest updates override the previous description.
To activate a update: Close the browser, Reopen the chart and apply the indicator.

Janus ƩRSI An overhaul to classical RSI
First version have 12 lag types to chose from, extreme conditions are highlighted with horizontal bands to be more intuitive.
Dynamics and signals vastly depend on filter used.
Main signals for current modes variate from self explanatory oscillators color change while moving out of extreme condition zone (overbought/oversold) to a brownish tint forming on impulse edges and representing S/R
Previous version hosted in tradingview bellow

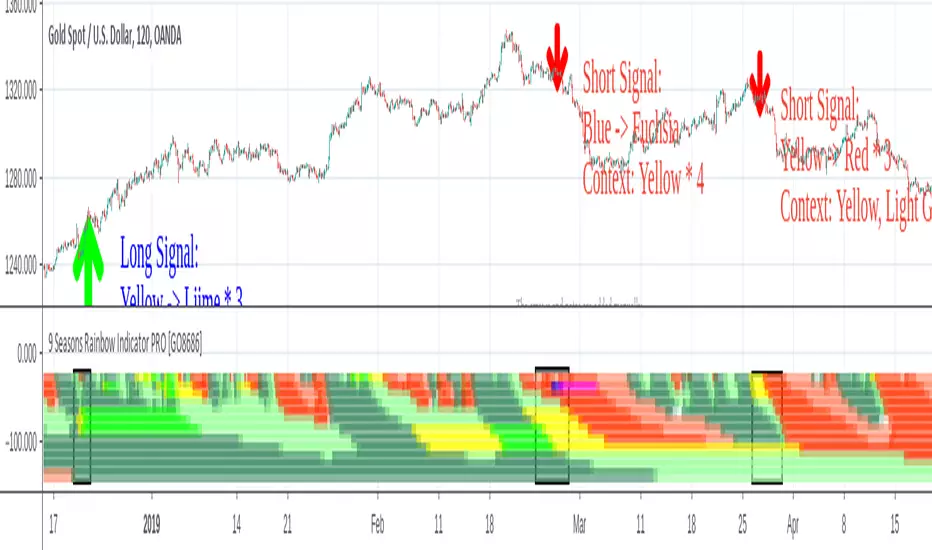
9 Seasons Rainbow Indicator PRO [GO8686]Trading on 5 minutes frame can be as reasonable as on 4H frame, use 9 Seasons Rainbow Indicator PRO for both.
5分钟维度的交易可以与4小时维度一样合理,请使用9季彩虹指标 PRO 。
Market is full of life, with seasons.
9 Seasons Rainbow Indicator displays 9 seasons of any trading instrument in multiple time frames, helping traders and investors understand the flow of price.
The combination of seasons in different time dimensions may give perfect trading signals, for instance: overbought in both small time frame and big time frame has high success probability of shorting trade.
Please install the indicator: Demo, PRO or STANDARD Version. Apply the indicator to your favorites trading instruments: indices, stocks, futures , forex or crypto currencies. Find your patterns that make money.
---------- 9 Seasons ----------
Bull(Green), evolves into BullRest, OverBought, Bear, or Neutral
Bull Rest(Light Green): a pullback or retracement, evolves into Bull or Bear
OverBought(Yellow): may have defined a top or resistance, can happen in range, evolves into CrazyBought or Bear
CrazyBought(Lime): going up in a high volatility , evolves into Bear, OverBought, or BullRest
Neutral(White): a wandering season without direction, evolves into Bull or Bear
Bear(Red), evolves into BearRest, OverSold, Bull or Neutral
Bear Rest(Light Red): a bounce, evolves into Bear or Bull
OverSold(Blue): may have defined a bottom or support, can happen in range, evolves into CrazySold or Bull
CrazySold(Fuchsia): going down in a high volatility , evolves into Bull, OverSold, or BearRest
---------- Some important evolutions of seasons ----------
OverBought -> CrazyBought: can happen with a breakout
CrazyBought -> OverBought or Bear: could mean fading of a breakout
CrazyBought -> BullRest: can happen after rising over a new level
OverSold -> CrazySold: can happen with a breakdown
CrazySold -> OverSold or Bear: could mean fading of a breakdown
CrazySold -> BearRest: can happen after dropping to a new level
---------- Rainbow Ribbons for multiple time frames ----------
Each ribbon of the rainbow represents a time frame,
The difference between two frames is 1.4142 fold (square root of 2), if level 1 is 15 M, level 2 is 15 * (square root of 2) M. level 3 is 15*2 M, level 4 is 30 * (square root of 2) M, level 5 is 30 * 2 m etc.
The uppermost ribbon represents the smallest time frame - current time period of the chart.
The lower ribbons represent bigger time frames, which work as context.
Examples for time frame rainbow:
For DEMO in 30M: 30M - 42M - 60M(1H) - 85M - 120M(2H) - 170M - 240M(4H) - 339M
For STANDARD in 15M: 15M - 21M - 30M - 42M - 60M(1H) - 85M - 120M(2H) - 170M
For PRO in 15M: 15M - 21M - 30M - 42M - 60M(1H) - 85M - 120M(2H) - 170M - 240M(4H) - 339M - 480M(8H) - 679M
---------- Versions Description ----------
The features may change later, please refer to latest update.
PRO:
PRO version of 9 Seasons Rainbow Indicator is invite-only, with the following advanced features:
12 Ribbon Rainbow lets you discover trading opportunities hidden in the 1.4142 fold time dimension while monitoring market conditions spanning 45 times.
Advanced alert sets allows you set alerts for Overbought, Crazybought, OverSold, CrazySold on low, medium, and high time frames.
Option to input different trading instrument to compare with the current ticker.
Full time periods access allows you to watch the market on broadest time dimensions.
More new features in updates.
STANDARD:
This is STANDARD version of 9 Seasons Rainbow Indicator, invite-only, with the following advanced features:
8 Ribbon Rainbow lets you discover trading opportunities hidden in the 1.4142 fold time dimension while monitoring market conditions spanning 11 times.
Advanced alert sets allows you set alerts for Overbought, Crazybought, OverSold, CrazySold on upper and lower time frames.
Broad time periods access allows you to watch the market on popular time dimensions from 15M - 1D,2D,3D,4D,5D,6D,1W.
More new features in updates.
DEMO:
A DEMO of Standard version for trial purpose, having most the functions except alert preset conditions.
It is applicable to a list of trading instruments and specific time periods(30m-1D), which may change later. please refer to latest updates.
---List of tickers applicable for Demo version.
Currency Index:AXY, BXY , CXY , DXY , EXY , JXY , SXY , ZXY ,
Stock Index:SPX,TSX, DAX , NI225 ,KOSPI,399001, SHCOMP , HSI , XJO , TAIEX , SX5E ,
Crypto:BTCUSD
Commodity:BCOUSD, GOLD
---------- Access to Indicators ----------
Please use DEMO version to taste the indicator.
Please contact the author for access to PRO or Standard versions.
---------- About Loading Time ----------
It may take up to 2 minutes for your browser to load a new setting, depending on the your computer and network speed.
---------- List of the author's Indicators ----------
tradingview.com/u/go8686/#published-scripts
---------- Disclaim ----------
By using or requesting access to this indicator, you acknowledge that you have read and accepted that this indicator is for study purposes only and it does NOT guarantee you will make money.
I am not financial adviser and I am NOT responsible for any profits or losses you may incur by using this indicator!
Users should make their own decisions, carefully assess risks and be responsible for investment and trading activities.
The latest updates override the previous description. Please check the updates.
9季彩虹指标 PRO
市场充满生机。
9季彩虹指标在多个时间维度上显示任何交易品种的9个季节交替,帮助交易者和投资者了解价格流动。
不同时间维度的季节组合可以给出完美的交易信号,例如:在小时间框架和大时间框架上同时出现超买具有很高的卖空交易成功概率。
请安装指标:DEMO,STANDARD 或者 PRO 版本. 应用指标到您的交易品种:证券,期货,外汇或者加密货币。找到属于您的盈利模式。
---------- 季节的定义 ----------
牛(绿色),可以演变到牛市回调,超买,熊 或者 中性
牛市回调(淡绿色):可以演变到牛或者熊
超买(黄色),可能刚刚定义了一个头部或者阻力区,可以发生在盘整期,可以演变到狂买或者熊
狂买(亮绿色):高波动性上涨,可以演变到熊,超买或者牛市回调
中性(白色): 没有方向的徘徊期,可以演变到牛或者熊
熊(红色),可以演变到熊市反弹,超卖,牛 或者 中性
熊市反弹(淡红色),可以演变到熊或者牛
超卖(蓝色),可能刚刚定义了一个底部或者支撑,可以发生在盘整期,可以演变到狂卖或者牛
狂卖(紫红色),高波动性下跌,可以演变到牛,超卖 或者熊市反弹
一些重要的季节交替
超买 -> 狂买:可能发生在向上突破时
狂买 -> 熊 或者 超买:可能发生在突破失败时
狂买 -> 牛市回调: 可能发生在上平台后
超卖 -> 狂卖:可能发生在向下突破时
狂卖 -> 牛 或者 超卖:可能发生在突破失败时
狂卖 -> 熊市回调: 可能发生在下平台后
---------- 色带彩虹所代表的时间维度 ----------
每条色带代表一个时间维度。
色带间隔1.4142倍(2的开方),如果第一维度是15分钟,第二维度是15*1.4142=21分钟,第三维度是15*2=30分钟,以此类推。
最上面的色带代表最小的时间维度,也就是目前图表的时间维度
最下面的色带代表最大的时间维度。
例子:
演示版: 30m-42m-60m(1H)-85m-120m(2H)-170m-240m(4H)-339m
标准版: 15m-21m-30m-42m-60m(1H)-85m-120m(2H)-170m
专业版: 15m-21m-30m-42m-60m(1H)-85m-120m(2H)-170m-240m(4H)-339m-480m(8H)-679m
---------- 不同版本功能描述 ----------
这些特征及功能可能会发生变化,以更新为准。
---专业版PRO高级特征
12色带彩虹让您发现隐藏在1.4142时间维度的交易机会,同时监控时间跨度达四十五倍的市场状态
高级警报功能:允许您在低,中,高时间帧上设置超买,狂买,超卖,狂卖的警报。
可以输入不同的交易品种用于指标,便于与当前交易品种进行比较。
全时间维度(分钟到日线级别)给您全视角观察市场
更新中的更多新功能。
---标准版STANDARD特征
8色带彩虹让您发现隐藏在1.4142时间维度的交易机会,同时监控时间跨度达十一倍的市场状态
高级警报功能:允许您在低,高时间层级上设置超买,狂买,超卖,狂卖的警报。
宽时间维度(15分钟到日线级别)让您从更宽阔的视角观察市场
更新中的更多新功能。
--演示版DEMO
演示版用于标准版的演示和试用,适用于特定的资产列表和时间维度(30M-1D),后续可能调整.
适用的品种列表
AXY , BXY , CXY , DXY , EXY , JXY , SXY , ZXY ,
SPX ,TSX, DAX , NI225 ,KOSPI,399001, SHCOMP , HSI , XJO , TAIEX , SX5E ,
BTCUSD , BCOUSD , GOLD
---------- 获得使用权 ----------
请使用演示版以初步了解指标的运行机理。
联系指标开发者以取得标准版和专业版的使用权
---------- 开发者的指标列表 ----------
tradingview.com/u/go8686/#published-scripts
---------- 加载时间 ----------
可能需要2分钟,取决于网络和电脑配置。
---------- 免责声明 ----------
在要求获得本指标使用权之前以及在使用本指标之前,用户认可已经完全了解和接受:本指标仅供研究目的, 它不提供任何赢利的可能性。
本指标的开发者并非专业投资顾问,因此不对用户的任何赢亏负责。
用户应独立判断,审慎评估并自负投资和交易风险!
最近的更新会覆盖之前的说明。 请参阅更新来查看指标的新特征和功能。
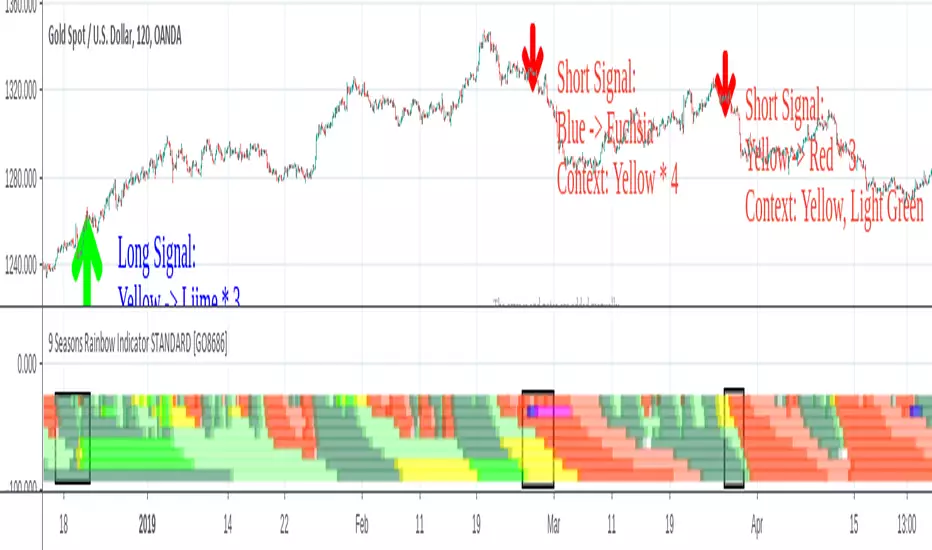
9 Seasons Rainbow Indicator STANDARD [GO8686]Market is full of life, with seasons.
9 Seasons Rainbow Indicator displays 9 seasons of any trading instrument in multiple time frames, helping traders and investors understand the flow of price.
The combination of seasons in different time dimensions may give perfect trading signals, for instance: overbought in both small time frame and big time frame has high success probability of shorting trade.
Please install the indicator: Demo, PRO or STANDARD Version. Apply the indicator to your favorites trading instruments: indices, stocks, futures , forex or crypto currencies. Find your patterns that make money.
---------- 9 Seasons ----------
Bull(Green), evolves into BullRest, OverBought, Bear, or Neutral
Bull Rest(Light Green): a pullback or retracement, evolves into Bull or Bear
OverBought(Yellow): may have defined a top or resistance, can happen in range, evolves into CrazyBought or Bear
CrazyBought(Lime): going up in a high volatility , evolves into Bear, OverBought, or BullRest
Neutral(White): a wandering season without direction, evolves into Bull or Bear
Bear(Red), evolves into BearRest, OverSold, Bull or Neutral
Bear Rest(Light Red): a bounce, evolves into Bear or Bull
OverSold(Blue): may have defined a bottom or support, can happen in range, evolves into CrazySold or Bull
CrazySold(Fuchsia): going down in a high volatility , evolves into Bull, OverSold, or BearRest
---------- Some important evolutions of seasons ----------
OverBought -> CrazyBought: can happen with a breakout
CrazyBought -> OverBought or Bear: could mean fading of a breakout
CrazyBought -> BullRest: can happen after rising over a new level
OverSold -> CrazySold: can happen with a breakdown
CrazySold -> OverSold or Bear: could mean fading of a breakdown
CrazySold -> BearRest: can happen after dropping to a new level
---------- Rainbow Ribbons for multiple time frames ----------
Each ribbon of the rainbow represents a time frame,
The difference between two frames is 1.4142 fold (square root of 2), if level 1 is 15 M, level 2 is 15 * (square root of 2) M. level 3 is 15*2 M, level 4 is 30 * (square root of 2) M, level 5 is 30 * 2 m etc.
The uppermost ribbon represents the smallest time frame - current time period of the chart.
The lower ribbons represent bigger time frames, which work as context.
Examples for time frame rainbow:
For DEMO in 30M: 30M - 42M - 60M(1H) - 85M - 120M(2H) - 170M - 240M(4H) - 339M
For STANDARD in 15M: 15M - 21M - 30M - 42M - 60M(1H) - 85M - 120M(2H) - 170M
For PRO in 15M: 15M - 21M - 30M - 42M - 60M(1H) - 85M - 120M(2H) - 170M - 240M(4H) - 339M - 480M(8H) - 679M
---------- Versions Description ----------
The features may change later, please refer to latest update.
STANDARD:
This is STANDARD version of 9 Seasons Rainbow Indicator, invite-only, with the following advanced features:
8 Ribbon Rainbow lets you discover trading opportunities hidden in the 1.4142 fold time dimension while monitoring market conditions spanning 11 times.
Advanced alert sets allows you set alerts for Overbought, Crazybought, OverSold, CrazySold on upper and lower time frames.
Broad time periods access allows you to watch the market on popular time dimensions from 15M - 1D,2D,3D,4D,5D,6D,1W.
More new features in updates.
PRO:
PRO version of 9 Seasons Rainbow Indicator is invite-only, with the following advanced features:
12 Ribbon Rainbow lets you discover trading opportunities hidden in the 1.4142 fold time dimension while monitoring market conditions spanning 45 times.
Advanced alert sets allows you set alerts for Overbought, Crazybought, OverSold, CrazySold on low, medium, and high time frames.
Option to input different trading instrument to compare with the current ticker.
Full time periods access allows you to watch the market on broadest time dimensions.
More new features in updates.
DEMO:
A DEMO of Standard version for trial purpose, having most the functions except alert preset conditions.
It is applicable to a list of trading instruments and specific time periods(30m-1D), which may change later. please refer to latest updates.
---List of tickers applicable for Demo version.
Currency Index:AXY, BXY , CXY , DXY , EXY , JXY , SXY , ZXY ,
Stock Index:SPX,TSX, DAX , NI225 ,KOSPI,399001, SHCOMP , HSI , XJO , TAIEX , SX5E ,
Crypto:BTCUSD
Commodity:BCOUSD, GOLD
---------- Access to Indicators ----------
Please contact the author for access to PRO or Standard versions.
---------- About Loading Time ----------
It may take up to 2 minutes for your browser to load a new setting, depending on the your computer and network speed.
---------- List of the author's Indicators ----------
tradingview.com/u/go8686/#published-scripts
---------- Disclaim ----------
By using or requesting access to this indicator, you acknowledge that you have read and accepted that this indicator is for study purposes only and it does NOT guarantee you will make money.
I am not financial adviser and I am NOT responsible for any profits or losses you may incur by using this indicator!
Users should make their own decisions, carefully assess risks and be responsible for investment and trading activities.
The latest updates override the previous description. Please check the updates.
9季彩虹指标 标准版 STANDARD
市场充满生机。
9季彩虹指标在多个时间维度上显示任何交易品种的9个季节交替,帮助交易者和投资者了解价格流动。
不同时间维度的季节组合可以给出完美的交易信号,例如:在小时间框架和大时间框架上同时出现超买具有很高的卖空交易成功概率。
请安装指标:DEMO,STANDARD 或者 PRO 版本. 应用指标到您的交易品种:证券,期货,外汇或者加密货币。找到属于您的盈利模式。
---------- 季节的定义 ----------
牛(绿色),可以演变到牛市回调,超买,熊 或者 中性
牛市回调(淡绿色):可以演变到牛或者熊
超买(黄色),可能刚刚定义了一个头部或者阻力区,可以发生在盘整期,可以演变到狂买或者熊
狂买(亮绿色):高波动性上涨,可以演变到熊,超买或者牛市回调
中性(白色): 没有方向的徘徊期,可以演变到牛或者熊
熊(红色),可以演变到熊市反弹,超卖,牛 或者 中性
熊市反弹(淡红色),可以演变到熊或者牛
超卖(蓝色),可能刚刚定义了一个底部或者支撑,可以发生在盘整期,可以演变到狂卖或者牛
狂卖(紫红色),高波动性下跌,可以演变到牛,超卖 或者熊市反弹
一些重要的季节交替
超买 -> 狂买:可能发生在向上突破时
狂买 -> 熊 或者 超买:可能发生在突破失败时
狂买 -> 牛市回调: 可能发生在上平台后
超卖 -> 狂卖:可能发生在向下突破时
狂卖 -> 牛 或者 超卖:可能发生在突破失败时
狂卖 -> 熊市回调: 可能发生在下平台后
---------- 色带彩虹所代表的时间维度 ----------
每条色带代表一个时间维度。
色带间隔1.4142倍(2的开方),如果第一维度是15分钟,第二维度是15*1.4142=21分钟,第三维度是15*2=30分钟,以此类推。
最上面的色带代表最小的时间维度,也就是目前图表的时间维度
最下面的色带代表最大的时间维度。
例子:
演示版: 30m-42m-60m(1H)-85m-120m(2H)-170m-240m(4H)-339m
标准版: 15m-21m-30m-42m-60m(1H)-85m-120m(2H)-170m
专业版: 15m-21m-30m-42m-60m(1H)-85m-120m(2H)-170m-240m(4H)-339m-480m(8H)-679m
---------- 不同版本功能描述 ----------
这些特征及功能可能会发生变化,以更新为准。
---标准版STANDARD特征
8色带彩虹让您发现隐藏在1.4142时间维度的交易机会,同时监控时间跨度达十一倍的市场状态
高级警报功能:允许您在低,高时间层级上设置超买,狂买,超卖,狂卖的警报。
宽时间维度(15分钟到日线级别)让您从更宽阔的视角观察市场
更新中的更多新功能。
---专业版PRO高级特征
12色带彩虹让您发现隐藏在1.4142时间维度的交易机会,同时监控时间跨度达四十五倍的市场状态
高级警报功能:允许您在低,中,高时间帧上设置超买,狂买,超卖,狂卖的警报。
可以输入不同的交易品种用于指标,便于与当前交易品种进行比较。
全时间维度(分钟到日线级别)给您全视角观察市场
更新中的更多新功能。
--演示版DEMO
演示版用于标准版的演示和试用,适用于特定的资产列表和时间维度(30M-1D),后续可能调整.
适用的品种列表
AXY , BXY , CXY , DXY , EXY , JXY , SXY , ZXY ,
SPX ,TSX, DAX , NI225 ,KOSPI,399001, SHCOMP , HSI , XJO , TAIEX , SX5E ,
BTCUSD , BCOUSD , GOLD
---------- 获得使用权 ----------
联系指标开发者以取得标准版和专业版的使用权
---------- 开发者的指标列表 ----------
tradingview.com/u/go8686/#published-scripts
---------- 加载时间 ----------
可能需要2分钟,取决于网络和电脑配置。
---------- 免责声明 ----------
在要求获得本指标使用权之前以及在使用本指标之前,用户认可已经完全了解和接受:本指标仅供研究目的, 它不提供任何赢利的可能性。
本指标的开发者并非专业投资顾问,因此不对用户的任何赢亏负责。
用户应独立判断,审慎评估并自负投资和交易风险!
最近的更新会覆盖之前的说明。 请参阅更新来查看指标的新特征和功能。
9 Seasons Rainbow Indicator DEMO [GO8686]Having good pattern recognition? Use this indicator to test and practice it.
Market is full of life, with seasons.
9 Seasons Rainbow Indicator displays 9 seasons of any trading instrument in multiple time frames, helping traders and investors understand the flow of price.
The combination of seasons in different time dimensions may give perfect trading signals, for instance: overbought in both small time frame and big time frame has high success probability of shorting trade.
Please install the indicator: Demo, PRO or STANDARD Version. Apply the indicator to your favorites trading instruments: indices, stocks, futures, forex or crypto currencies. Find your patterns that make money.
---------- 9 Seasons ----------
Bull(Green), evolves into BullRest, OverBought, Bear, or Neutral
Bull Rest(Light Green): a pullback or retracement, evolves into Bull or Bear
OverBought(Yellow): may have defined a top or resistance, can happen in range, evolves into CrazyBought or Bear
CrazyBought(Lime): going up in a high volatility, evolves into Bear, OverBought, or BullRest
Neutral(White): a wandering season without direction, evolves into Bull or Bear
Bear(Red), evolves into BearRest, OverSold, Bull or Neutral
Bear Rest(Light Red): a bounce, evolves into Bear or Bull
OverSold(Blue): may have defined a bottom or support, can happen in range, evolves into CrazySold or Bull
CrazySold(Fuchsia): going down in a high volatility, evolves into Bull, OverSold, or BearRest
---------- Some important evolutions of seasons ----------
OverBought -> CrazyBought: can happen with a breakout
CrazyBought -> OverBought or Bear: could mean fading of a breakout
CrazyBought -> BullRest: can happen after rising over a new level
OverSold -> CrazySold: can happen with a breakdown
CrazySold -> OverSold or Bear: could mean fading of a breakdown
CrazySold -> BearRest: can happen after dropping to a new level
---------- Rainbow Ribbons for multiple time frames ----------
Each ribbon of the rainbow represents a time frame,
The difference between two frames is 1.4142 fold (square root of 2), if level 1 is 15 M, level 2 is 15 * (square root of 2) M. level 3 is 15*2 M, level 4 is 30 * (square root of 2) M, level 5 is 30 * 2 m etc.
The uppermost ribbon represents the smallest time frame - current time period of the chart.
The lower ribbons represent bigger time frames, which work as context.
Examples for time frame rainbow:
For DEMO in 30M: 30M - 42M - 60M(1H) - 85M - 120M(2H) - 170M - 240M(4H) - 339M
For STANDARD in 15M: 15M - 21M - 30M - 42M - 60M(1H) - 85M - 120M(2H) - 170M
For PRO in 15M: 15M - 21M - 30M - 42M - 60M(1H) - 85M - 120M(2H) - 170M - 240M(4H) - 339M - 480M(8H) - 679M
---------- Versions Description ----------
The features may change later, please refer to latest update.
DEMO:
This is DEMO of Standard version for trial purpose, having most the functions except alert preset conditions.
It is applicable to a list of trading instruments and specific time periods(30m-1D), which may change later. please refer to latest updates.
---List of tickers applicable for Demo version.
Currency Index:AXY,BXY,CXY,DXY,EXY,JXY,SXY,ZXY,
Stock Index:SPX,TSX,DAX,NI225,KOSPI,399001,SHCOMP,HSI,XJO,TAIEX,SX5E,
Crypto:BTCUSD
Commodity:BCOUSD,GOLD
STANDARD:
STANDARD version of 9 Seasons Rainbow Indicator is invite-only, with the following advanced features:
8 Ribbon Rainbow lets you discover trading opportunities hidden in the 1.4142 fold time dimension while monitoring market conditions spanning 11 times.
Advanced alert sets allows you set alerts for Overbought, Crazybought, OverSold, CrazySold on upper and lower time frames.
Broad time periods access allows you to watch the market on popular time dimensions from 15M - 1D,2D,3D,4D,5D,6D,1W.
More new features in updates.
PRO:
PRO version of 9 Seasons Rainbow Indicator is invite-only, with the following advanced features:
12 Ribbon Rainbow lets you discover trading opportunities hidden in the 1.4142 fold time dimension while monitoring market conditions spanning 45 times.
Advanced alert sets allows you set alerts for Overbought, Crazybought, OverSold, CrazySold on low, medium, and high time frames.
Option to input different trading instrument to compare with the current ticker.
Full time periods access allows you to watch the market on broadest time dimensions.
More new features in updates.
---------- Access to Indicators ----------
Please contact the author for access to PRO or Standard versions.
---------- About Loading Time ----------
It may take up to 2 minutes for your browser to load a new setting, depending on the your computer and network speed.
---------- List of the author's Indicators ----------
www.tradingview.com
---------- Disclaim ----------
By using or requesting access to this indicator, you acknowledge that you have read and accepted that this indicator is for study purposes only and it does NOT guarantee you will make money.
I am not financial adviser and I am NOT responsible for any profits or losses you may incur by using this indicator!
Users should make their own decisions, carefully assess risks and be responsible for investment and trading activities.
The latest updates override the previous description. Please check the updates.
9季彩虹指标 演示版
具备优秀的模式识别能力吗? 9季彩虹指标检验,提升您的模式识别能力。
市场充满生机。
9季彩虹指标在多个时间维度上显示任何交易品种的9个季节交替,帮助交易者和投资者了解价格流动。
不同时间维度的季节组合可以给出完美的交易信号,例如:在小时间框架和大时间框架上同时出现超买具有很高的卖空交易成功概率。
请安装指标:Demo,STANDARD 或者 PRO 版本. 应用指标到您的交易品种:证券,期货,外汇或者加密货币。找到属于您的盈利模式。
---------- 季节的定义 ----------
牛(绿色),可以演变到牛市回调,超买,熊 或者 中性
牛市回调(淡绿色):可以演变到牛或者熊
超买(黄色),可能刚刚定义了一个头部或者阻力区,可以发生在盘整期,可以演变到狂买或者熊
狂买(亮绿色):高波动性上涨,可以演变到熊,超买或者牛市回调
中性(白色): 没有方向的徘徊期,可以演变到牛或者熊
熊(红色),可以演变到熊市反弹,超卖,牛 或者 中性
熊市反弹(淡红色),可以演变到熊或者牛
超卖(蓝色),可能刚刚定义了一个底部或者支撑,可以发生在盘整期,可以演变到狂卖或者牛
狂卖(紫红色),高波动性下跌,可以演变到牛,超卖 或者熊市反弹
一些重要的季节交替
超买 -> 狂买:可能发生在向上突破时
狂买 -> 熊 或者 超买:可能发生在突破失败时
狂买 -> 牛市回调: 可能发生在上平台后
超卖 -> 狂卖:可能发生在向下突破时
狂卖 -> 牛 或者 超卖:可能发生在突破失败时
狂卖 -> 熊市回调: 可能发生在下平台后
---------- 色带彩虹所代表的时间维度 ----------
每条色带代表一个时间维度。
色带间隔1.4142倍(2的开方),如果第一维度是15分钟,第二维度是15*1.4142=21分钟,第三维度是15*2=30分钟,以此类推。
最上面的色带代表最小的时间维度,也就是目前图表的时间维度
最下面的色带代表最大的时间维度。
例子:
演示版: 30m-42m-60m(1H)-85m-120m(2H)-170m-240m(4H)-339m
标准版: 15m-21m-30m-42m-60m(1H)-85m-120m(2H)-170m
专业版: 15m-21m-30m-42m-60m(1H)-85m-120m(2H)-170m-240m(4H)-339m-480m(8H)-679m
---------- 不同版本功能描述 ----------
这些特征及功能可能会发生变化,以更新为准。
--演示版DEMO
演示版用于标准版的演示和试用,适用于特定的资产列表和时间维度(30M-1D),后续可能调整.
适用的品种列表
AXY,BXY,CXY,DXY,EXY,JXY,SXY,ZXY,
SPX,TSX,DAX,NI225,KOSPI,399001,SHCOMP,HSI,XJO,TAIEX,SX5E,
BTCUSD,BCOUSD,GOLD
---标准版STANDARD特征
8色带彩虹让您发现隐藏在1.4142时间维度的交易机会,同时监控时间跨度达十一倍的市场状态
高级警报功能:允许您在低,高时间层级上设置超买,狂买,超卖,狂卖的警报。
宽时间维度(15分钟到日线级别)让您从更宽阔的视角观察市场
更新中的更多新功能。
---专业版PRO高级特征
12色带彩虹让您发现隐藏在1.4142时间维度的交易机会,同时监控时间跨度达四十五倍的市场状态
高级警报功能:允许您在低,中,高时间帧上设置超买,狂买,超卖,狂卖的警报。
可以输入不同的交易品种用于指标,便于与当前交易品种进行比较。
全时间维度(分钟到日线级别)给您全视角观察市场
更新中的更多新功能。
---------- 获得使用权 ----------
联系指标开发者以取得标准版和专业版的使用权
---------- 开发者的指标列表 ----------
www.tradingview.com
---------- 加载时间 ----------
可能需要2分钟,取决于网络和电脑配置。
---------- 免责声明 ----------
在要求获得本指标使用权之前以及在使用本指标之前,用户认可已经完全了解和接受:本指标仅供教育和研究目的, 它不提供任何赢利的可能性。
本指标的开发者并非专业投资顾问,因此不对用户的任何赢亏负责。
用户应独立判断,审慎评估并自负投资和交易风险!
最近的更新会覆盖之前的说明。 请参阅更新来查看指标的新特征和功能。

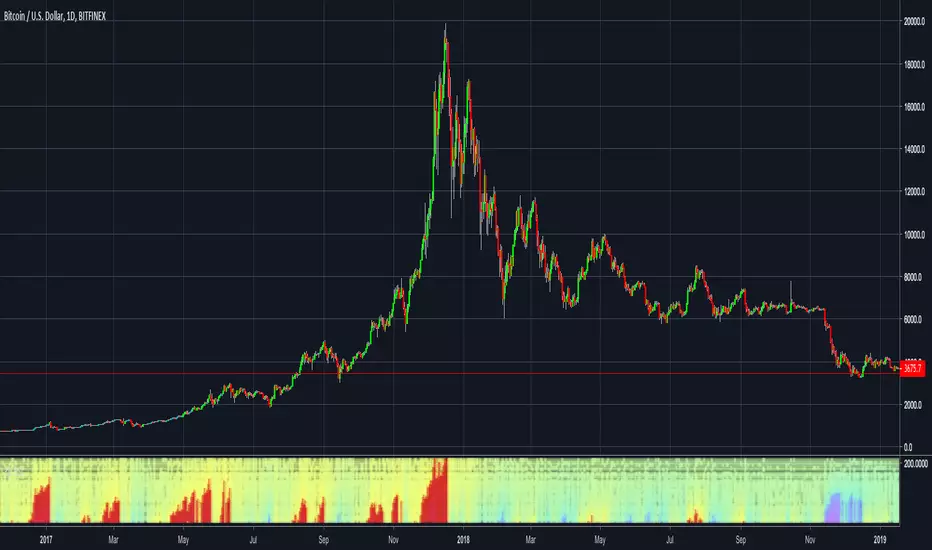
3D Relative Strength IndexThis indicator in form of a heatmap shows the longest periods of RSI values above 70 and under 30.
Red spots mean RSI is above 70 and blue ones RSI is under 30.
BUY ZONE ALERT SAM CRYPTOI HAVE 2 SCRIPTS FOR OVERBOUGHT AND OVERSOLD MARKET THATS WORK GREAT AND HAVE ABOVE 90% ACCURACY, IM USING THIS SCRIPT AND HAVE GREAT RESULT .. THERE ARE MANY SCRIPTS AND INDICATORS IN MARKET WHICH USE REPAINT AFTER CHART HAS DONE BUT ITS NOT HAPPEN IN THIS SCRIPT .....BY USING LITTLE BIT SENSE YOU CAN MAKE GREAT PROFIT IN BINANCE AND BITMEX BUT YOU WILL GET RARE SIGNAL NOT DAILY .....I MEAN TO SAY YOU WILL GET SIGNALS THOSE HAVE ALMOST ABOVE 90% ACCURACY ........
FOR MORE INFORMATION AND DEMO
DROP A MESSAGE TO ME
WHATS APP +919588843376

Relative Strength IndexEvery developer must create his own Relative Strength Index with midline and other features).
In addition to the midline, highlighting and levels customization I give you ability to play with non-standard sources like On Balance Volume.
If someone doesn't know what is this:
This indicator was originally developed by J. Welles Wilder and was described in his book "New Concepts in Technical Trading Systems" (1978). It is intended to measure the strength or weakness of an instrument for the specified period.
RSI is a momentum oscillator and can have a reading from 0 to 100. The values of 70 or above indicate that an instrument is becoming overbought or overvalued and may be primed for a trend reversal or corrective pullback in price. The values of 30 or below indicates an oversold or undervalued condition.
The other significant signals are divergences with price and middle line crossovers. RSI if one the most used indicators on the planet.
Enjoy and good luck!

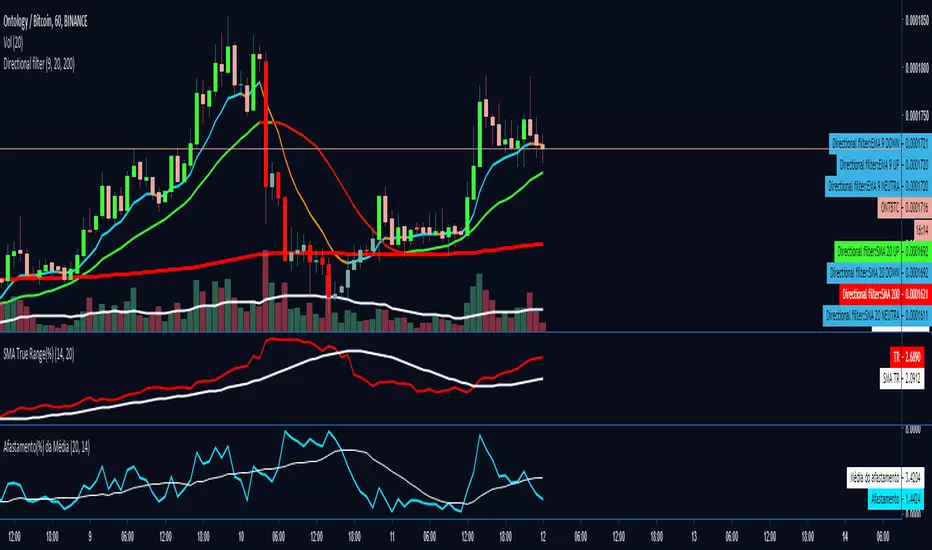
Afastamento da Média (by Fabio Figueiredo)This indicator was created by Fábio Figueiredo (VLAD)
The idea is to show the distance in percentage that the asset is of the SMA of the price, so it is possible to know if the price is very stretched or not
I also added the SMA of "distance of SMA" as extra information.
Enhanced Relative Strength Index (RSI)By member request I have provided this enhanced relative strength index (RSI), free to use for all, far surpassing the built-in RSI capabilities. The features list includes enable/disable dark background for enhanced visibility, dashed line zero mean of 50, adjustable RSI period, upper threshold adjustment, lower threshold adjustment, area highlighting of the exceeded threshold levels, and a red/green secondary range that adjusts +/- from the upper/lower thresholds. If you have any comments regarding this indicator, I will consider your thoughts and ideas presented below.
🚀Ehler's RocketRSI by Cryptorhythms🚀Ehler's RocketRSI by Cryptorhythms
This indicator does require some tinkering in cases to line up the waveforms. Here on the 4Hr I have used an RSI LB of 14 and SSF LB of 10.
Personally I find its better at picking short entries when the indicator is topping out. For bottoms it a bit less effective.
I do not use this indicator by itself, but rather as another tool when looking for short entries.
Description
The RocketRSI is an indicator that combines the approach used in the calculation of the Relative Strength Index (RSI) with some principles of signal processing and was developed by John Ehler. By smoothing out noisy price data and singling out a cyclic component within it, the indicator can be used for analysis of cyclic reversals, which could potentially signal trading
opportunities.
The calculation of the RocketRSI is as follows:
A close price change (momentum) from a past value is found for each bar. The offset between the current and the past price is constant.
The values found are run through Ehler
s 3-Pole SuperSmootherFilter to eliminate the noise.
The algebraic sum of one-bar changes in the filtered values is divided by the sum of absolute values of the same changes. The output of this step is limited to be in the range from -0.999 to +0.999.
The result is run through the Fisher transform to provide a easily interpreted wave-like output.
If there is a dominant cycle in the input data and the lengths are set correctly, the analysis of peaks and troughs of the output wave may provide valuable sell and buy signals.
👍Enjoying this indicator or find it useful? Please give me a like and follow! I post crypto analysis, price action strategies and free indicators regularly.
💬Questions? Comments? Want to get access to an entire suite of proven trading indicators? Come visit us on telegram and chat, or just soak up some knowledge. We make timely posts about the market, news, and strategy everyday. Our community isnt open only to subscribers - everyone is welcome to join.

Spiky Iguana Multi RSI Bands (Reverse RSI for the Price) by RRBSpiky Iguana Multi RSI Bands by RagingRocketBull 2018
Version 1.0
This indicator shows multiple RSI Bands with prices corresponding to specified overbought/oversold RSI levels.
It is used to extrapolate the exact price levels currently matching a given set of RSI levels based on prior price/RSI levels action.
You can think of it as a reverse RSI where RSI levels are moving dynamically around the price instead of price bouncing between straight lines.
Features:
- 6+6 = 12 customizable Overbought(R)/Oversold(S) RSI Levels + 6 Mean(M) lines
- Multicolor levels/fill ranges
- Show/Hide specific S/R/M levels and fill ranges
1. uses plot*, fill and is based on RSIBANDS_LB
Good Luck! Feel free to explore and learn from the code

Overbought/Oversold IndicatorAggregates 4 indicators with inputs you can specify for overbought / oversold levels. Adds up the signals and you can specify a minimum threshold to signal overbought or oversold. Works for stocks and crypto.
ImminentImminent Volume & Rsi Indicator
U can See how Volume & Rsi are overbought or oversold in the same time + Signal Divergence in to Volume vs Price xD

Quantum Currency Strength Indicator (CSI)If there is only one TradingView indicator you ever buy for trading forex – this has to be it.
Your success as a forex trader depends on being able to identify when a currency or currency pair is oversold or overbought. If it is strong or weak. It is this concept which lies at the heart of forex trading. Without the Quantum Currency Strength indicator, it’s almost impossible. There are simply too many currencies and too many pairs to do this quickly and easily yourself. You need help. The Quantum Currency Strenght indicator breaks this complex market down into the building blocks, the currencies themselves, from which you can then identify quickly, clearly and easily those pairs offering the best opportunities, which to ignore for the time being, and which to add to your watchlist. It’s your radar on the currency market.
The Quantum Currency Strength indicator has been designed with one simple objective in mind. To give you a bird’s eye view of the eight major currencies. To show you in a simple, quick and easy way, when a currency is either oversold or overbought, rising or falling strongly, or just going nowhere.
To help you, the indicator defines the overbought and oversold regions for you, with a simple horizontal line. One near the top at 80, and the other near the bottom at 20. When a currency reaches the upper grey line, it’s approaching an overbought state, and when a currency touches the lower grey line, conversely it’s approaching an oversold state.
It is at these points a trend is likely to reverse, offering you low-risk trading opportunities. Something you could never do quickly or easily yourself.
It displays the eight currencies individually, giving you endless combinations of trading opportunities from scalping to swing and trend trading in all the various currency pairs and in every timeframe.
US dollar – red
Euro – orange
British pound – yellow
Swiss franc – green
Japanese yen – magenta
Canadian dollar – purple
Australian dollar – blue
New Zealand dollar – white
Whilst this concept is simple, its use is sophisticated, and one which you can apply in a variety of ways. In fact four very different, but equally powerful ways, all of which will help you make money, confidently and without emotion:
First – the indicator tells you when an individual currency is overbought or oversold. Strong or weak. Unlike some assets, currencies never go to zero. It is when they reach these extreme points, that currencies offer the lowest risk trading opportunities. These are the regions at which a currency is likely to reverse from a previous trend, giving you the potential to get into a low-risk trading position early.
Second – the indicator will also tell you when it’s time to exit. After all, if it’s good enough to get you in, it’s good enough to get you out as well.
Third – when the currencies are all bunched together in the middle of the indicator – guess what. It’s time to sit on the sidelines and wait.
Finally, take your trading to another level using multiple timeframes. After all, if a currency is moving higher, or lower, across three timeframes, then even more reason to take a low-risk trade, so using the indicator in multiple timeframes is key.
And if this wasn’t enough. There is even more!
You can configure the indicator to your own personal trading style. Think of it like the volume control on your radio. You adjust it to your own personal preference. Well it’s the same here. If you are a scalping trader, simply adjust one of the indicator settings to speed up the indicator. If you are a swing or trend trader, tweak the controls to slow it down a little – the choice is yours. More control means one thing – more consistency and greater profits.
After all, why buy an indicator that you cannot match to your trading style? It would be like buying a radio with no volume control.
That’s why we call them the next generation of trading indicators for TradingView.
The Quantum Currency Strength indicator works in all timeframes from seconds and ticks to minutes and months, and the colour of each currency line on the indicator can be changed to your own personal preferences.


Hammer StrikerThis indicator Scans for Divergence and Hammer and inverted Hammer and doji
after the first oversold spike must come with divergence a doji or a hammer is armed depending on the time frame
is the capitulation candle that is collected
u can then buy or sell

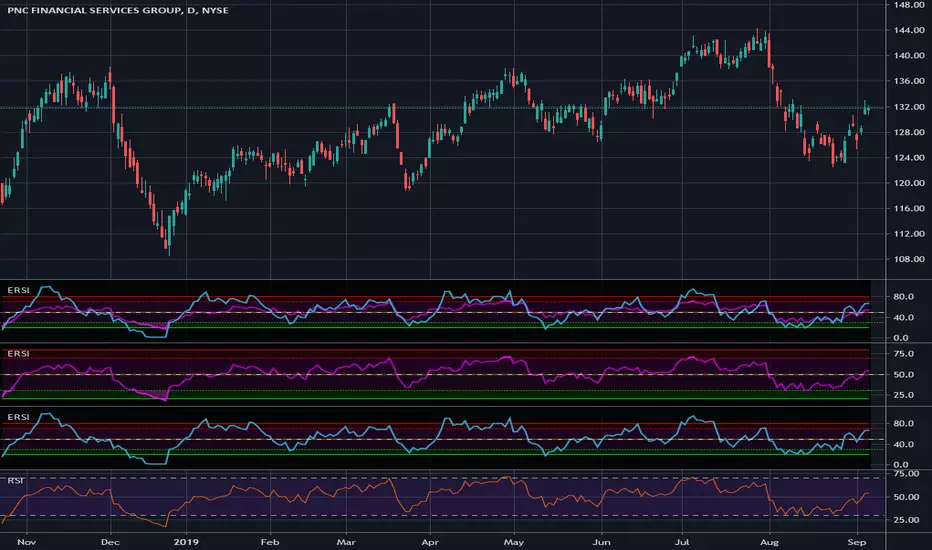
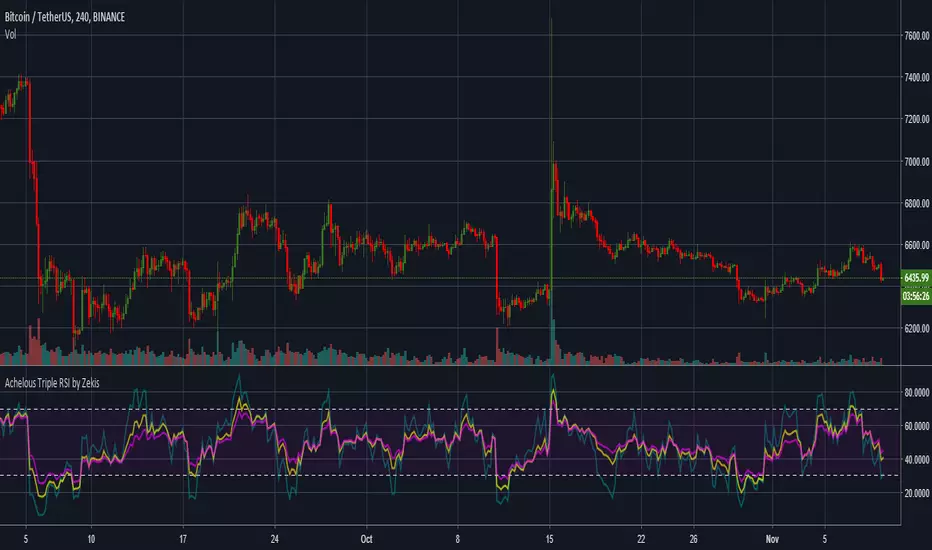
Achelous Triple RSI by ZekisTriple RSI (Relative Strength Index) in one script for a better view and a better analysis of the chart
Values and colors can be adjusted
Enjoy!
@ Zekis
🥢Crypto-Sticks: Ehler's Universal Oscillator by Cryptorthyhms🥢Crypto-Sticks™: Ehler's Ultimate Oscillator
A new series of indicators brought to you by Cryptorthyhms...giving you an alternate look at your trusted favorites! Follow me, there are still 2 dozen Crypto-Sticks indicators planned - all will be released in public library.
🚀Indicator Specific Info
New Crypto-Sticks option is an EMA of the average signal line output. Eventually I will go back and update the previous indicators with this feature as well!
Heiken Ashi candles (default) adds some more clear trend changing points. HA example here:
Volume weighting the HA candles adds a different dimension to the indicator which I have to explore more fully. VW does work somewhat on this indicator, skewing output but also adding (too much in my opinion) noise. An example of VW+HA:
💭Please leave me any ideas or feedback you have!
🚫If you use volume weighting you should be on heiken candles.
🚀Crypto-Sticks General Info
🚧This series isnt polished 100%, and I have some more options I will add in the future. But for now, I want to just release them, as I am not sure when I will have the time to put more work into them (many other big projects I am working on).
📊Its basically reinterpretations of all your favorite indicators. I calculate the values a little bit differently than normal, but the end result is creating a candlestick chart (for the indicator!). Then I added the option to plot them as Heiken Ashi candles to smooth out noise and make signaling easier. I recommend using the indicator on this setting.
🔊Lastly I implemented a Volume Weighting system for them all which simply integrates volume into the formulas for these indicators. For the most part this feature is experimental and doesn't provide huge utility (yet - I have other ways I want to try it as well - just no time). Though on some of the indicators it already shows great promise.
👍Enjoying this indicator or find it useful? Please give me a like and follow! There are many more indicators to be released in this series, not to mention I post crypto analysis and other free indicators regularly.
💬Questions? Comments? Want to get access to an entire suite of proven trading indicators? Come visit us on telegram and chat, or just soak up some knowledge. We make timely posts about the market, news, and strategy everyday. Our community isnt open only to subscribers - everyone is welcome to join.

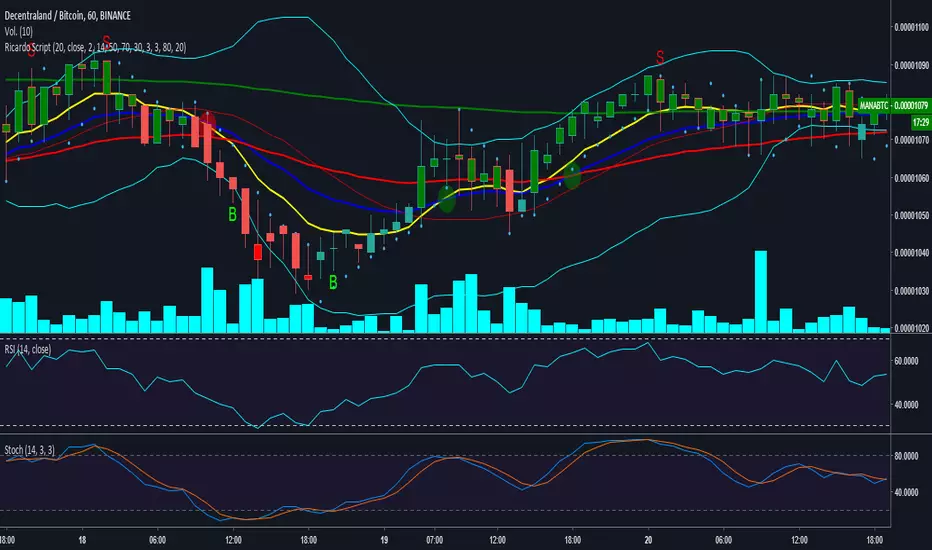
Ricardo Script Ver. 1* It is possible to create alarms with all the indicators
- ema10
- ema20
- ema50
- ema200
- Bollinger Bands
- Parabolic Sar
- Stochastic signal Overbought and Oversold
* Display the Rsi in the candles By green or red color, you can change the color from the panel, they will be highlighted in the candles above the RSI of 50 or you can activate it only when it is over bought and over sold in the range "70 and 30 "from the RSI
* Enables or disables the signs of purchase or sale of the Stochastic "RECOMMENDED FOR SCALPING WITH BOLLINGER BANDS"
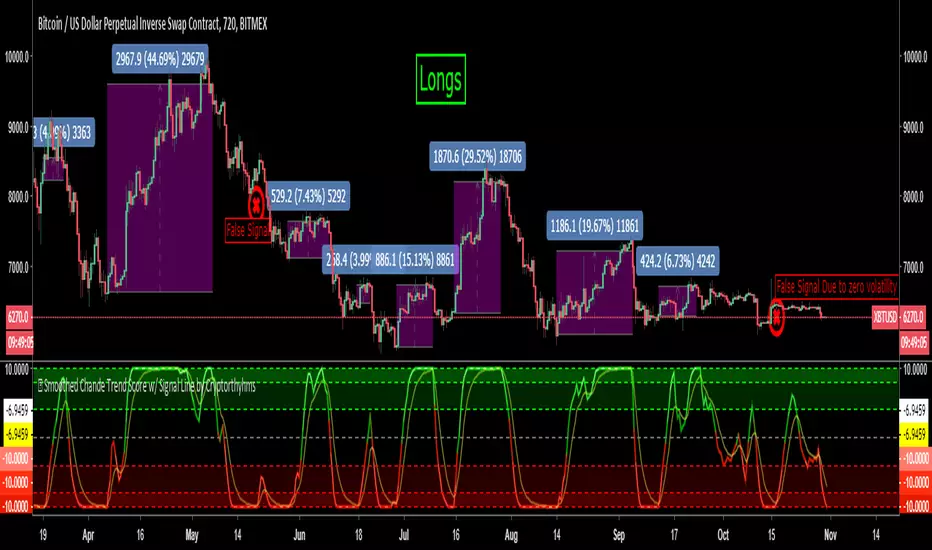
Smoothed Chande Trend Score w/ Signal Line by Cryptorhythms🆓 Smoothed Chande Trend Score w/ Signal Line by Cryptorhythms
👀Did not see this one in the public library yet, so here you go! I added an ema signal line that you can configure the length on. Also dressed it up a little with OB/OS zones and some purdy colors.
Here are long + short charts:
👍Enjoying this indicator or find it useful? Please give me a like and follow! I post crypto analysis, price action strategies and free indicators regularly.
💬Questions? Comments? Want to get access to an entire suite of proven trading indicators? Come visit us on telegram and chat, or just soak up some knowledge. We make timely posts about the market, news, and strategy everyday. Our community isnt open only to subscribers - everyone is welcome to join.
Description written by Chande...
As you may have noticed, a number of rather complicated indicators are available to measure trend strength. None of these indicators, unfortunately, is perfect. You could use J. Welles Wilder's average directional index (ADX) as an indicator of trend strength, or perhaps the r² value from linear regression analysis. Or you could even use the vertical horizontal filter (VHF) to help determine whether the market is trending.
Each of these indicators requires the user to determine how many days' data should be used in the calculations. As you vary the indicator length or number of days used in the calculation, however, the result of the calculation changes also. Thus, there is no unambiguous answer. If the market were about to enter or leave a trading range, you could get a different indication of trend strength every day — a frustrating set of circumstances.
RATING THE TREND
Here is my way of rating a trend, a method I call trendscore.
Add up the score for 10 comparisons; the score varies from + 10 to -10. If today's close is greater than all the previous closes, then the trend's score is +10; if today's close is less than all the previous closes, the score is -10. You can smooth the data by adding fewer than 10 days or more than 10 days. A positive score shows an upward trend bias. Similarly, a negative score shows a downward bias. A shorter time of comparison may be too volatile, producing frequent trend change signals, while a longer comparison time is slow to respond. During long trends, the trendscore remains at the outer limits, +10 or -10, for the duration of the trend. In sideways markets, the score doesn't remain at +10 or -10 for long, oscillating between these limits.
How to Use this Indicator
You could trade the trendscore many ways. You could use the zero crossing as an early signal. You would then buy when the trendscore becomes positive and sell when it becomes negative. Or you could wait one to three days after the trendscore reaches +10 or -10 before buying (+ 10) or selling (-10) . Or you could combine the trendscore with a moving average, trading an upward or downward cross over.
Another variation would be to go long after the trendscore crosses from -10 to above +5 and go short after the trendscore falls from +10 to below 5. The approach you choose depends on your trading style. You could also smooth the trendscore with more or fewer days than I used in my calculations. You could, for example, use fewer than 10 days for short-term and 20 to 30 days for intermediate-term trading. You could also combine trendscore with other indicators of trend strength. For example, if you combined it with the VHF indicator, trendscore would provide an indication of direction, while the VHF could provide additional information about the trend's strength. You could also substitute intraday data in the trendscore method for short-term trading, using hourly data to calculate a trend's score instead of daily data. Trendscore is a simple way to rate trend strength. It indicates both the direction and strength of the trend and can be easily combined with various trend-following strategies.