Ghost Protocol: Smart Money HUD [Ash_TheTrader]👻 GHOST PROTOCOL: The Institutional HUD
"Stop trading blind. Start seeing where the Smart Money is hiding."
Most indicators lag. They tell you what happened. Ghost Protocol tells you what is happening right now by combining two powerful concepts: Volume Absorption (Whale Defense) and Kinematic Physics (Price Velocity).
This is not just an indicator; it is a complete Heads-Up Display (HUD) for scalpers and day traders on NQ, ES, Gold, and Crypto.
🧠 The Concept: Why It Works
Retail traders lose money for two reasons:
Selling into a bottom (where Whales are absorbing orders).
Buying a fake breakout (where price lacks the energy to continue).
Ghost Protocol solves both by visualizing the invisible battle between aggressive orders (Retail) and passive limit orders (Institutions).
🛠️ The 3 Core Features
1. The "Ghost Walls" (Reversal Detector) 🛡️
What it is: Detects when massive volume hits the market but Price fails to progress. This is Absorption. A "Whale" is using a Limit Order Wall to absorb panic selling or FOMO buying.
The Visual:
🟢 Green Ghost Bubble + Beam: Buyers are absorbing sellers. (Bullish Wall).
🔴 Red Ghost Bubble + Beam: Sellers are absorbing buyers. (Bearish Wall).
Sticky Tech: The bubbles "stick" to the wicks perfectly, regardless of zoom level.
2. The "Velocity Terminal" (Breakout Validator) 🚀
What it is: A Physics Engine for price. It calculates Jerk (Change in Acceleration). Standard breakouts often fail, but a breakout with high "Jerk" (Surge) rarely comes back.
The Visual:
🟣 Plasma Purple Candle: Valid Breakout. Price is moving with high physical energy. Safe to follow.
⚪ Grey/Dull Candle: Fakeout. Price broke a level but lacks energy. The move is likely a trap.
3. The Smart Money Dashboard 💻
A sleek, "Classy" panel in the bottom right corner.
Monitors both engines simultaneously:
GHOST WALL: Scans for Reversals (Buy/Sell Walls).
VELOCITY: Scans for Momentum (Surge/Fakeout).
🎯 How to Trade This Script
Strategy A: The "Whale Reversal" (Scalping)
Step 1: Wait for price to push hard into a level.
Step 2 : A Ghost Wall (Ghost Icon 👻) appears.
Step 3 : A vertical Neon Beam lights up the background.
Action: Take the reversal immediately. Place stop loss just behind the bubble.
Strategy B: The "Physics Breakout" (Trend Following)
Step 1: Price breaks a key resistance or support level.
Step 2: Look at the candle color.
If it is Plasma Purple: ENTER. The physics engine confirms true momentum.
If it is Grey: WAIT. It is likely a fakeout designed to trap you.
⚙️ Settings & Customization
Bubble Distance: Adjust how close the Ghost bubbles sit to the candles.
Sensitivity: Tune the "Jerk Threshold" for the physics engine.
Visuals: Toggle the Background Beams, Dashboard size, and Neon colors to fit your dark/light mode setup.
Created by @Ash_TheTrader Trade with the Whales, not against them.
Orderblock
Order Blocks v2This is a short code script that shows you a REAL Order Blocks.
There is many indicators that show you random blocks on the screen, these are by definition Order Blocks. The code is simple and short.
You can use this indicator as an extra confluence or as a place to put your stop losses or to put your stop losses in profit.
I recommend always keeping the "Consider order block only with following FVG" on, as the best Order Blocks are found with that setting on.
I have a lot more code i can share, use this and let me know how it works for you!
THE SETTINGS I USE ARE:
(NO) Only show on on time levels 3,7,11,14
fractal bars 3
Order blocks on break of Fractal close or HL Close
(YES) Consider order block only with following FVG
Max distance of FVG following Order Blocks 2
Oder Block Height Body
Dotted 13 length and 3 width

Order Block Finder [MHA Finverse]Order Block Finder is a sophisticated Smart Money Concepts (SMC) tool designed to identify and visualize institutional order blocks on your charts. This indicator helps traders spot key areas where smart money has placed their orders, providing valuable insights for potential support and resistance zones.
What are Order Blocks?
Order blocks are price zones where institutional traders have placed significant orders. This indicator identifies these zones by detecting pivot points in price action and tracking structural breaks in both internal (short-term) and swing (long-term) timeframes.
Key Features:
• Dual Structure Analysis
- Internal Order Blocks: Fast-moving blocks based on 5-bar pivots for short-term trading
- Swing Order Blocks: Slower blocks based on 50-bar pivots for position trading
- Display up to 20 order blocks per type
• Volume Metrics
Each order block displays two important metrics:
- Volume value: The total volume of the candle that formed the order block
- Percentage: Relative volume compared to all visible order blocks (always totals 100%)
Higher percentages indicate stronger institutional activity and more significant zones
• Smart Filtering System
- ATR Filter: Filters out high-volatility candles (>2x ATR) to focus on genuine order blocks
- CMR Filter: Uses Cumulative Mean Range for adaptive filtering across different market conditions
• Flexible Mitigation Options
Choose how order blocks are considered broken:
- High/Low: Order block breaks when price touches its boundary
- Close: Order block breaks only when candle closes through it
• Visual Customization
- Colored or Monochrome themes
- Adjustable text size for volume metrics
- Customizable colors for bullish and bearish blocks
- Historical or Present mode for clean chart analysis
• Built-in Alert System
- Real-time alerts when order blocks are mitigated
- Individual toggles for each alert type
- Clear emoji indicators (🔵 Bullish, 🔴 Bearish)
- Compatible with TradingView's alert system
How It Works:
The indicator identifies order blocks by:
1. Detecting pivot highs and lows in price structure
2. Monitoring when price crosses these pivots (structure breaks)
3. Finding the highest/lowest volatility-filtered candle in the pivot zone
4. Marking this candle as an order block with its volume data
5. Removing blocks when the price mitigates them
Order blocks with higher volume percentages represent stronger institutional interest and are typically more reliable for trading decisions.
Best Practices:
- Use Internal OBs for day trading and scalping
- Use Swing OBs for swing trading and position entries
- Pay attention to blocks with higher volume percentages
- Combine with other SMC concepts for confirmation
Perfect for traders who follow Smart Money Concepts, ICT methodology, and institutional trading analysis.
Disclaimer:
This indicator is provided for educational and informational purposes only. It should not be considered as financial advice or a recommendation to buy or sell any financial instrument. Trading involves substantial risk of loss and is not suitable for all investors. Past performance does not guarantee future results. Always conduct your own research and consult with a qualified financial advisor before making any trading decisions. The creator of this indicator assumes no responsibility for any losses incurred from its use.

VCAI BOS-Zone PROVCAI BOS-Zone PRO is a structure-driven order-block mapper that tracks swing highs/lows, detects Break of Structure (BOS), and automatically draws clean bullish and bearish OB zones with midlines and directional flags.
It provides a clear, rules-based map of where structural shifts occurred and where price may react on future retests.
What it does:
Uses configurable swing pivots to define structure.
A bullish BOS is triggered when price closes above the last swing high;
a bearish BOS when price closes below the last swing low.
After each BOS, the script finds the last opposite candle (bearish before a bullish BOS, bullish before a bearish BOS) and builds an order-block zone from that candle’s high/low.
Each zone is projected a fixed number of bars into the future, keeping charts clean and preventing zones from extending into the price scale.
Only the latest N bullish and N bearish zones are kept, so the chart focuses on the most relevant active levels.
How to read it:
Yellow boxes + BULL flags = bullish demand zones.
Purple boxes + BEAR flags = bearish supply zones.
The edges of each zone act as potential support/resistance.
Reactions inside a yellow zone suggest buy-side interest;
rejection at a purple zone suggests sell-side pressure.
Optional midlines mark the 50% level of each zone, commonly used for refined entries, mitigations, and partial management.
How traders typically use it:
BOS-Zone PRO does not generate buy/sell alerts, but many traders use the zones as part of a broader decision process:
Bullish zones are often monitored for long setups when price returns and shows strength or continuation.
Bearish zones are often monitored for short setups when price retests and shows rejection or weakness.
Midlines provide refined entry levels with clearer invalidation points.
This tool is best used as structural context alongside your own entry model, risk settings, and trade management.
Notes & best practices:
BOS is directional, not predictive — treat zones as context, not guaranteed reversals.
Works on all symbols and timeframes.
Lower swing settings capture local structure; higher settings focus on major breaks and cleaner OB's.
Ideal as a structural map for discretionary traders or as a component inside automated systems.
Part of the VCAI toolset.
We develop a range of market-structure, volume, trend and liquidity tools designed to work together or stand alone.

QuantMotions - Smart Money BlocksSmart Money Blocks – Clean Edition is a minimalistic, high-precision Smart Money Concepts (SMC) tool designed for traders who want clean and reliable market structure signals without chart clutter.
This script detects and visualizes Order Blocks, Fair Value Gaps (FVGs), and Liquidity Levels using a strictly filtered, volume-based institutional logic.
Unlike many SMC indicators that overload the chart with noise, this version is built to stay fast, clean, and accurate — ideal for both scalpers and higher-timeframe traders.
🔍 Features
✔ Institutional Order Block Detection
• Identifies bullish and bearish order blocks
• Uses high-volume + price-displacement confirmation
• OBs extend forward and deactivate when broken
• Includes volume + tick range info-box
✔ Fair Value Gaps (FVG)
• Auto-detects bullish and bearish FVGs
• Marks imbalance zones until they are fully filled
• Clean, non-intrusive visualization
✔ Liquidity Levels
• Smart swing-high/swing-low liquidity detection
• Tracks touches to distinguish strong vs weak levels
• Marks support/resistance liquidity with labels only (no chart clutter)
⚙️ Clean & Minimal Design
This script is optimized for a clean workflow:
• No volume profile
• No BOS/CHOCH spam
• No unused SMC elements
• Only high-value SMC signals
• Clean color theme for dark charts
The goal is to provide only what matters, nothing more.
📈 Use Cases
• Smart Money / ICT style trading
• Scalping (1s – 1m)
• Intraday / London & New York session trading
• Swing trading
• Market structure analysis
• Liquidity and imbalance mapping
Whether you're identifying points of interest (POIs), building a bias, or mapping high-probability reaction zones — this tool helps you see structure clearly.
🔔 Alerts Included
• Order Block creation
• FVG creation
• Price touching an active Order Block
• Volume surge
• Institutional candle detection
• Structure break detection
Great for automation or bias confirmation.
🧠 Why This Script?
Many SMC indicators try to do everything — which often results in clutter, lag, and unreliable signals.
This edition focuses on precision, clarity, and real usability.
The logic is light, efficient, and suited for real-time execution on very fast charts.
📌 Note
This tool does not generate trade signals by itself.
It is designed as a market structure map for traders who already understand Smart Money principles such as:
• Displacement
• Imbalance
• Institutional candles
• OB mitigation
• Liquidity sweeps
Use it as part of your confluence system.

Smart Money Flow Index (SMFI) - Advanced SMC [PhenLabs]📊Smart Money Flow Index (SMFI)
Version: PineScript™v6
📌Description
The Smart Money Flow Index (SMFI) is an advanced Smart Money Concepts implementation that tracks institutional trading behavior through multi-dimensional analysis. This comprehensive indicator combines volume-validated Order Block detection, Fair Value Gap identification with auto-mitigation tracking, dynamic Liquidity Zone mapping, and Break of Structure/Change of Character detection into a unified system.
Unlike basic SMC indicators, SMFI employs a proprietary scoring algorithm that weighs five critical factors: Order Block strength (validated by volume), Fair Value Gap size and recency, proximity to Liquidity Zones, market structure alignment (BOS/CHoCH), and multi-timeframe confluence. This produces a Smart Money Score (0-100) where readings above 70 represent optimal institutional setup conditions.
🚀Points of Innovation
Volume-Validated Order Block Detection – Only displays Order Blocks when formation candle exceeds customizable volume multiplier (default 1.5x average), filtering weak zones and highlighting true institutional accumulation/distribution
Auto-Mitigation Tracking System – Fair Value Gaps and Order Blocks automatically update status when price mitigates them, with visual distinction between active and filled zones preventing trades on dead levels
Proprietary Smart Money Score Algorithm – Combines weighted factors (OB strength 25%, FVG proximity 20%, Liquidity 20%, Structure 20%, MTF 15%) into single 0-100 confidence rating updating in real-time
ATR-Based Adaptive Calculations – All distance measurements use 14-period Average True Range ensuring consistent function across any instrument, timeframe, or volatility regime without manual recalibration
Dynamic Age Filtering – Automatically removes liquidity levels and FVGs older than configurable thresholds preventing chart clutter while maintaining relevant levels
Multi-Timeframe Confluence Integration – Analyzes higher timeframe bias with customizable multipliers (2-10x) and incorporates HTF trend direction into Smart Money Score for institutional alignment
🔧Core Components
Order Block Engine – Detects institutional supply/demand zones using characteristic patterns (down-move-then-strong-up for bullish, up-move-then-strong-down for bearish) with minimum volume threshold validation, tracks mitigation when price closes through zones
Fair Value Gap Scanner – Identifies price imbalances where current candle's low/high leaves gap with two-candle-prior high/low, filters by minimum size percentage, monitors 50% fill for mitigation status
Liquidity Zone Mapper – Uses pivot high/low detection with configurable lookback to mark swing points where stop losses cluster, extends horizontal lines to visualize sweep targets, manages lifecycle through age-based removal
Market Structure Analyzer – Tracks pivot progression to identify trend through higher-highs/higher-lows (bullish) or lower-highs/lower-lows (bearish), detects Break of Structure and Change of Character for trend/reversal confirmation
Scoring Calculation Engine – Evaluates proximity to nearest Order Blocks using ATR-normalized distance, assesses FVG recency and distance, calculates liquidity proximity with age weighting, combines structure bias and MTF trend into smoothed final score
🔥Key Features
Customizable Display Limits – Control maximum Order Blocks (1-10), Liquidity Zones (1-10), and FVG age (10-200 bars) to maintain clean charts focused on most relevant institutional levels
Gradient Strength Visualization – All zones render with transparency-adjustable coloring where stronger/newer zones appear more solid and weaker/older zones fade progressively providing instant visual hierarchy
Educational Label System – Optional labels identify each zone type (Bullish OB, Bearish OB, Bullish FVG, Bearish FVG, BOS) with color-coded text helping traders learn SMC concepts through practical application
Real-Time Smart Money Score Dashboard – Top-right table displays current score (0-100) with color coding (green >70, yellow 30-70, red <30) plus trend arrow for at-a-glance confidence assessment
Comprehensive Alert Suite – Configurable notifications for Order Block formation, Fair Value Gap detection, Break of Structure events, Change of Character signals, and high Smart Money Score readings (>70)
Buy/Sell Signal Integration – Automatically plots triangle markers when Smart Money Score exceeds 70 with aligned market structure and fresh Order Block detection providing clear entry signals
🎨Visualization
Order Block Boxes – Shaded rectangles extend from formation bar spanning high-to-low of institutional candle, bullish zones in green, bearish in red, with customizable transparency (80-98%)
Fair Value Gap Zones – Rectangular areas marking imbalances, active FVGs display in bright colors with adjustable transparency, mitigated FVGs switch to gray preventing trades on filled zones
Liquidity Level Lines – Dashed horizontal lines extend from pivot creation points, swing highs in bearish color (short targets above), swing lows in bullish color (long targets below), opacity decreases with age
Structure Labels – "BOS" labels appear above/below price when Break of Structure confirmed, colored by direction (green bullish, red bearish), positioned at 1% beyond highs/lows for visibility
Educational Info Panel – Bottom-right table explains key terminology (OB, FVG, BOS, CHoCH) and score interpretation (>70 high probability) with semi-transparent background for readability
📖Usage Guidelines
General Settings
Show Order Blocks – Default: On, toggles visibility of institutional supply/demand zones, disable when focusing solely on FVGs or Liquidity
Show Fair Value Gaps – Default: On, controls FVG zone display including active and mitigated imbalances
Show Liquidity Zones – Default: On, manages liquidity line visibility, disable on lower timeframes to reduce clutter
Show Market Structure – Default: On, toggles BOS/CHoCH label display
Show Smart Money Score – Default: On, controls score dashboard visibility
Order Block Settings
OB Lookback Period – Default: 20, Range: 5-100, controls bars scanned for Order Block patterns, lower values detect recent activity, higher values find older blocks
Min Volume Multiplier – Default: 1.5, Range: 1.0-5.0, sets minimum volume threshold as multiple of 20-period average, higher values (2.0+) filter for strongest institutional candles
Max Order Blocks to Display – Default: 3, Range: 1-10, limits simultaneous Order Blocks shown, lower settings (1-3) maintain focus on most recent zones
Fair Value Gap Settings
Min FVG Size (%) – Default: 0.3, Range: 0.1-2.0, defines minimum gap size as percentage of close price, lower values detect micro-imbalances, higher values focus on significant gaps
Max FVG Age (bars) – Default: 50, Range: 10-200, removes FVGs older than specified bars, lower settings (10-30) for scalping, higher (100-200) for swing trading
Show FVG Mitigation – Default: On, displays filled FVGs in gray providing visual history, disable to show only active untouched imbalances
Liquidity Zone Settings
Liquidity Lookback – Default: 50, Range: 20-200, sets pivot detection period for swing highs/lows, lower values (20-50) mark shorter-term liquidity, higher (100-200) identify major swings
Max Liquidity Age (bars) – Default: 100, Range: 20-500, removes liquidity lines older than specified bars, adjust based on timeframe
Liquidity Sensitivity – Default: 0.5, Range: 0.1-1.0, controls pivot detection sensitivity, lower values mark only major swings, higher values identify minor swings
Max Liquidity Zones to Display – Default: 3, Range: 1-10, limits total liquidity levels shown maintaining chart clarity
Market Structure Settings
Pivot Length – Default: 5, Range: 3-15, defines bars to left/right for pivot validation, lower values (3-5) create sensitive structure breaks, higher (10-15) filter for major shifts
Min Structure Move (%) – Default: 1.0, Range: 0.1-5.0, sets minimum percentage move required between pivots to confirm structure change
Multi-Timeframe Settings
Enable MTF Analysis – Default: On, activates higher timeframe trend analysis incorporation into Smart Money Score
Higher Timeframe Multiplier – Default: 4, Range: 2-10, multiplies current timeframe to determine analysis timeframe (4x on 15min = 1hour)
Visual Settings
Bullish Color – Default: Green (#089981), sets color for bullish Order Blocks, FVGs, and structure elements
Bearish Color – Default: Red (#f23645), defines color for bearish elements
Neutral Color – Default: Gray (#787b86), controls color of mitigated zones and neutral elements
Show Educational Labels – Default: On, displays text labels on zones identifying type (OB, FVG, BOS), disable once familiar with patterns
Order Block Transparency – Default: 92, Range: 80-98, controls Order Block box transparency
FVG Transparency – Default: 92, Range: 80-98, sets Fair Value Gap zone transparency independently from Order Blocks
Alert Settings
Alert on Order Block Formation – Default: On, triggers notification when new volume-validated Order Block detected
Alert on FVG Formation – Default: On, sends alert when Fair Value Gap appears enabling quick response to imbalances
Alert on Break of Structure – Default: On, notifies when BOS or CHoCH confirmed
Alert on High Smart Money Score – Default: On, alerts when Smart Money Score crosses above 70 threshold indicating high-probability setup
✅Best Use Cases
Order Block Retest Entries – After Break of Structure, wait for price retrace into fresh bullish Order Block with Smart Money Score >70, enter long on zone reaction targeting next liquidity level
Fair Value Gap Retracement Trading – When price creates FVG during strong move then retraces, enter as price approaches unfilled gap expecting institutional orders to continue trend
Liquidity Sweep Reversals – Monitor price approaching swing high/low liquidity zones against prevailing Smart Money Score trend, after stop hunt sweep watch for rejection into premium Order Block/FVG
Multi-Timeframe Confluence Setups – Identify alignment when current timeframe Order Block coincides with higher timeframe FVG plus MTF analysis showing matching trend bias
Break of Structure Continuations – After BOS confirms trend direction, trade pullbacks to nearest Order Block or FVG in direction of structure break using Smart Money Score >70 as entry filter
Change of Character Reversal Plays – When CHoCH detected indicating potential reversal, look for Smart Money Score pivot with opposing Order Block formation then enter on structure confirmation
⚠️Limitations
Lagging Pivot Calculations – Pivot-based features (Liquidity Zones, Market Structure) require bars to right of pivot for confirmation, meaning these elements identify levels retrospectively with delay equal to lookback period
Whipsaw in Ranging Markets – During choppy conditions, Order Blocks fail frequently and structure breaks produce false signals as Smart Money Score fluctuates without clear institutional bias, best used in trending markets
Volume Data Dependency – Order Block volume validation requires accurate volume data which may be incomplete on Forex pairs or limited in crypto exchange feeds
Subjectivity in Scoring Weights – Proprietary 25-20-20-20-15 weighting reflects general institutional behavior but may not optimize for specific instruments or market regimes, user cannot adjust factor weights
Visual Complexity on Lower Timeframes – Sub-hour timeframes generate excessive zones creating cluttered charts, requires aggressive display limit reduction and higher minimum thresholds
No Fundamental Integration – Indicator analyzes purely technical price action and volume without incorporating economic events, news catalysts, or fundamental shifts that override technical levels
💡What Makes This Unique
Unified SMC Ecosystem – Unlike indicators displaying Order Blocks OR FVGs OR Liquidity separately, SMFI combines all three institutional concepts plus market structure into single cohesive system
Proprietary Confidence Scoring – Rather than manual setup assessment, automated Smart Money Score quantifies probability by weighting five institutional dimensions into actionable 0-100 rating
Volume-Filtered Quality – Eliminates weak Order Blocks forming without institutional volume confirmation, ensuring displayed zones represent genuine accumulation/distribution
Adaptive Lifecycle Management – Automatically updates mitigation status and removes aged zones preventing trades on dead levels through continuous validity and age monitoring
Educational Integration – Built-in tooltips, labeled zones, and reference panel make indicator functional for both learning Smart Money Concepts and executing strategies
🔬How It Works
Order Block Detection – Scans for patterns where strong directional move follows counter-move creating last down-candle before rally (bullish OB) or last up-candle before sell-off (bearish OB), validates formations only when candle exhibits volume exceeding configurable multiple (default 1.5x) of 20-bar average volume
Fair Value Gap Identification – Compares current candle’s high/low against two-candles-prior low/high to detect price imbalances, calculates gap size as percentage of close and filters micro-gaps below minimum threshold (default 0.3%), monitors whether subsequent price fills 50% triggering mitigation status
Liquidity Zone Mapping – Employs pivot detection using configurable lookback (default 50 bars) to identify swing highs/lows where retail stops cluster, extends horizontal reference lines from pivot creation and applies age-based filtering to remove stale zones
Market Structure Analysis – Tracks pivot progression using structure-specific lookback (default 5 bars) to determine trend, confirms uptrend when new pivot high exceeds previous by minimum move percentage, detects Break of Structure when price breaks recent pivot level, flags Change of Character for potential reversals
Multi-Timeframe Confluence – When enabled, requests security data from higher timeframe (current TF × HTF multiplier, default 4x), compares HTF close against HTF 20-period MA to determine bias, contributes ±50 points to score ensuring alignment with institutional positioning on superior timeframe
Smart Money Score Calculation – Evaluates Order Block component via ATR-normalized distance producing max 100-point contribution weighted at 25%, assesses FVG factor through age penalty and distance at 20% weight, calculates Liquidity proximity at 20%, incorporates structure bias (±50-100 points) at 20%, adds MTF component at 15%, applies 3-period smoothing to reduce volatility
Visual Rendering and Lifecycle – Draws Order Block boxes, Fair Value Gap rectangles with color coding (green/red active, gray mitigated), extends liquidity dashed lines with fade-by-age opacity, plots BOS labels, displays Smart Money Score dashboard, continuously updates checking mitigation conditions and removing elements exceeding age/display limits
💡Note:
The Smart Money Flow Index combines multiple Smart Money Concepts into unified institutional order flow analysis. For optimal results, use the Smart Money Score as confluence filter rather than standalone entry signal – scores above 70 indicate high-probability setups but should be combined with risk management, higher timeframe bias, and market regime understanding.

Volume Order Block Scanner [BOSWaves]Volume Order Block Scanner - Dynamic Detection of High-Volume Supply and Demand Zones
Overview
The Volume Order Block Scanner introduces a refined approach to institutional zone mapping, combining volume-weighted order flow, structural displacement, and ATR-based proportionality to identify regions of aggressive participation from large entities.
Unlike static zone mapping or simplistic body-size filters, this framework dynamically evaluates each candle through a multi-layer model of relative volume, candle structure, and volatility context to isolate genuine order block formations while filtering out market noise.
Each identified zone represents a potential institutional footprint, defined by significant volume surges and efficient body-to-ATR relationships that indicate purposeful positioning. Once mapped, each order block is dynamically adjusted for volatility and tracked throughout its lifecycle - from creation to mitigation to potential invalidation - producing an evolving liquidity map that adapts with price.
This adaptive behavior allows traders to visualize where liquidity was absorbed and where it remains unfilled, revealing the structural foundation of institutional intent across timeframes.
Theoretical Foundation
At its core, the Volume Order Block Scanner is built on the interaction between volume displacement and structural imbalance. Traditional order block systems often rely on fixed candle formations or simple engulfing logic, neglecting the fundamental driver of institutional activity: volume concentration relative to volatility.
This framework redefines that approach. Each candle is filtered through two comparative ratios:
Relative Volume Ratio (RVR) - the candle’s volume compared to its rolling average, confirming genuine transactional surges.
Body-ATR Ratio (BAR) - a measure of displacement efficiency relative to recent volatility, ensuring structural strength.
Only when both conditions align is an order block validated, marking a displacement event significant enough to create a lasting imbalance.
By embedding this logic within a volatility-adjusted environment, the system maintains scalability across asset classes and volatility regimes - equally effective in crypto, forex, or index markets.
How It Works
The Volume Order Block Scanner operates through a structured multi-stage process:
Displacement Detection - Identifies candles whose body and volume exceed dynamic thresholds derived from ATR and rolling volume averages. These represent the origin points of institutional aggression.
Zone Construction - Each qualified candle generates an order block with ATR-proportional dimensions to ensure consistency across instruments and timeframes. The zone includes two regions: Body Zone (the precise initiation point of displacement) and Wick Imbalance (the residual inefficiency representing unfilled liquidity).
Lifecycle Tracking - Each zone is continuously monitored for market interaction. Reactions within a defined window are classified as respected, mitigated, or invalidated, giving traders a data-driven sense of ongoing institutional relevance.
Volume Confirmation Layer - Reinforces signal integrity by ensuring that all detected blocks correspond with meaningful increases in transactional activity.
Temporal Decay Control - Zones that remain untested beyond a set period gradually lose visual and analytical weight, maintaining chart clarity and contextual precision.
Interpretation
The Volume Order Block Scanner visualizes how institutional participants interact with the market through zones of accumulation and distribution.
Bullish order blocks denote demand imbalances where price displaced upward under high volume; bearish order blocks signify supply regions formed by concentrated selling pressure.
Price revisiting these areas often reflects institutional re-entry or liquidity rebalancing, offering actionable insights for both continuation and reversal scenarios.
By continuously monitoring interaction and expiry, the framework enables traders to distinguish between active institutional footprints and historical liquidity artifacts.
Strategy Integration
The Volume Order Block Scanner integrates naturally into advanced structural and order-flow methodologies:
Liquidity Mapping : Identify high-volume regions that are likely to influence future price reactions.
Break-of-Structure Confirmation : Validate BOS and CHOCH signals through aligned order block behavior.
Volume Confluence : Combine with BOSWaves volume or momentum indicators to confirm real institutional intent.
Smart-Money Frameworks : Utilize order block retests as precision entry zones within SMC-based setups.
Trend Continuation : Filter zones in line with higher-timeframe bias to maintain directional integrity.
Technical Implementation Details
Core Engine : Dual-filter mechanism using Relative Volume Ratio (RVR) and Body-ATR Ratio (BAR).
Volatility Framework : ATR-based scaling for cross-asset proportionality.
Zone Composition : Body and wick regions plotted independently for visual clarity of imbalance.
Lifecycle Logic : Real-time monitoring of reaction, mitigation, and invalidation states.
Directional Coloring : Distinct bullish and bearish shading with adjustable transparency.
Computation Efficiency : Lightweight structure suitable for multi-timeframe or multi-asset environments.
Optimal Application Parameters
Timeframe Guidance:
5m - 15m : Reactive intraday zones for short-term liquidity engagement.
1H - 4H : Medium-term structures for swing or intraday trend mapping.
Daily - Weekly : Macro accumulation and distribution footprints.
Suggested Configuration:
Relative Volume Threshold : 1.5× - 2.0× average volume.
Body-ATR Threshold : 0.8× - 1.2× for valid displacement.
Zone Expiry : 5 - 10 bars for intraday use, 15 - 30 for swing/macro contexts.
Parameter optimization should be asset-specific, tuned to volatility conditions and liquidity depth.
Performance Characteristics
High Effectiveness:
Markets exhibiting clear displacement and directional flow.
Environments with consistent volume expansion and liquidity inefficiencies.
Reduced Effectiveness:
Range-bound markets with frequent false impulses.
Low-volume sessions lacking institutional participation.
Integration Guidelines
Confluence Framework : Pair with structure-based BOS or liquidity tools for validation.
Risk Management : Treat active order blocks as contextual areas of interest, not guaranteed reversal points.
Multi-Timeframe Logic : Derive bias from higher-timeframe blocks and execute from refined lower-timeframe structures.
Volume Verification : Confirm each reaction with concurrent volume acceleration to avoid false liquidity cues.
Disclaimer
The Volume Order Block Scanner is a quantitative mapping framework designed for professional traders and analysts. It is not a predictive or guaranteed system of profit.
Performance depends on correct configuration, market conditions, and disciplined risk management. BOSWaves recommends using this indicator as part of a comprehensive analytical process - integrating structural, volume, and liquidity context for accurate interpretation.

ICT SMART MONEY__Advanced Multi-Timeframe Target TREND indicator with comprehensive ICT (Inner Circle Trader) concepts, session analysis, and smart money concepts for professional forex and crypto trading.__
---
### __🔥 Core Features:__
#### __📈 Multi-Timeframe Analysis__
- __7 Timeframe Table__: 1min, 5min, 15min, 30min, 1hour, 4hour, Daily analysis
- __Target System__: Stop Loss, Entry, TP1, TP2, TP3 calculations for each timeframe
- __Trend Direction__: Visual arrows showing bullish/bearish bias across all timeframes
#### __⚡ ICT Killzone Sessions__
- __4 Major Sessions__: Asia KZ, London KZ, NY AM, NY PM with colored session boxes
- __Pivot Lines__: Automatic high/low detection with full format labels ("ASIA High", "LONDON Low")
- __Global Label Alignment__: All session labels perfectly aligned for professional appearance
- __Range Analytics__: Real-time pip calculations with historical averages and Turkish volatility analysis
#### __🌍 Trading Session Management__
- __Individual Controls__: Asia/London sessions auto-enabled, NY sessions optional
- __Horizontal Lines__: Clean session high/low tracking without clutter
- __NY Lunch Session__: Additional 11:30-13:30 session for advanced analysis
- __Session Transparency__: Adjustable transparency levels for optimal chart visibility
#### __📍 Professional Key Levels__
- __Monday High/Low__: Weekly opening reference levels
- __Previous Day High/Low__: Daily support/resistance zones
- __Previous Week High/Low__: Major weekly levels
- __Full Format Labels__: "Previous Day High" instead of "PDH" for crystal clarity
- __160 Bar Distance__: Optimized label positioning for clean charts
#### __🔗 Liquidity Trendlines__
- __Automatic Detection__: 8-bar lookback pivot detection system
- __Breakout Signals__: Visual alerts when trendlines are broken
- __Dynamic Padding__: 4.0 ATR-based trendline spacing
- __Bullish/Bearish Colors__: Clear color coding for trend direction
#### __💎 Smart Money Concepts (SMC)__
- __Fair Value Gaps (FVG)__: Automatic gap detection with mitigation tracking
- __Structure Analysis__: BOS (Break of Structure) and CHoCH (Change of Character) detection
- __Structure Fibonacci__: 5-level fibonacci retracements (78.6%, 70.5%, 61.8%, 50%, 38.2%)
- __Lifecycle Management__: Complete FVG and structure history tracking
#### __📊 Range Analytics Table__
- __Session Volatility__: Current pip movement vs historical averages
- __Turkish Analysis__: "Güçlü Momentum", "Yüksek Aktivite", "Normal Aktivite", "Düşük Hareket", "Zayıf Session"
- __Integrated Display__: Seamlessly positioned below multi-timeframe table
- __Professional Formatting__: Color-coded session identification with status analysis

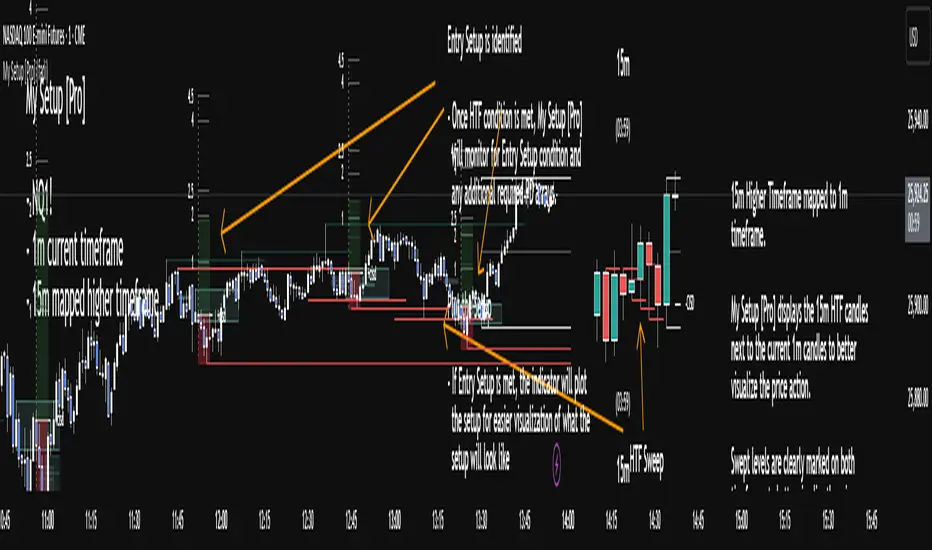
My setup [Pro] (fadi)My Setup is a powerful TradingView indicator that visualizes your trading strategy, helping you find high-probability setups with precision and discipline. It combines Higher Timeframe (HTF) context with Lower Timeframe (LTF) entries on a single chart, streamlining your trading process.
What It Does
Tracks your chosen timeframe and its paired higher timeframe for custom trade setups, so you don’t have to stay glued to the screen.
Plots clear Entry, Stop Loss, and Take Profit levels when your conditions align.
Customizes to your strategy with HTF triggers (e.g., sweeps, liquidity grabs) and LTF entries (e.g., Order Blocks, FVGs, Breakers).
Ensures discipline by only showing setups that meet all your rules, eliminating emotional trading and FOMO.
Backtest your edge by visualizing past setups to refine entries, stops, and confluences.
How It Works
Set Your HTF Trigger: Choose a market event like a sweep of a high/low, pivot point, or liquidity grab on the paired higher timeframe (e.g., 1H for a 5m chart).
Define Your LTF Entry: Select your entry model from a range of institutional concepts, such as Order Block, Fair Value Gap (FVG), Inverted FVG (iFVG), Breaker Block, Unicorn Model, and more, on the chart’s timeframe.
Add Confluence Filters: Stack conditions like requiring an FVG + Breaker for higher-probability setups.
See It on Your Chart: When a setup forms, it’s instantly plotted with Entry, Stop Loss, and Take Profit levels based on your Risk-to-Reward ratio.
Key Features
Multi-Timeframe Sync: Pair your chart’s timeframe (e.g., 5m) with a higher timeframe (e.g., 1H) for seamless analysis.
Institutional Tools: Supports a comprehensive suite of ICT concepts, including Order Blocks, FVGs, iFVGs, Breakers, Unicorn Model, and additional entry models.
Custom Risk Management: Set your Stop Loss and Take Profit levels with fixed R:R or measured moves using large range of entry and stop levels.
Session Filtering: Limit setups to specific trading sessions (e.g., London, New York) with timezone support.
Visual Clarity: Displays HTF candles and key levels on your chart for context, with customizable colors and styles.
Alerts: Get notified the moment a valid setup appears, even on live candles.
Who It’s For
Traders who want to systematize their ICT-based strategy on a single chart.
Those seeking to trade with discipline and avoid impulsive decisions.
Anyone looking to backtest and optimize their setups with clear, visual feedback.
Busy traders who need a tool to track their chart while they focus on life.
Why Choose My Setup ?
Save Time: Let the indicator track your chart and its paired timeframe.
Trade Confidently: Only take A+ setups that match your exact rules.
Learn and Improve: Analyze historical setups to refine your strategy.
Disclaimer of Warranties and Limitation of Liability for [My Setup ]
Please read this disclaimer carefully before using the [My Setup ] indicator (hereafter referred to as "the Software").
1. No Financial Advice
The Software is provided for educational and informational purposes only. The data, calculations, and signals generated by the Software are not, and should not be interpreted as, financial advice, investment advice, trading advice, or a recommendation or solicitation to buy, sell, or hold any security or financial instrument.
2. Assumption of Risk You acknowledge that trading and investing are inherently risky activities that carry a high potential for significant financial loss. All actions you take in the market, including but not limited to trade execution and risk management, are your sole responsibility. You agree to use the Software at your own sole risk. The creator shall not be held responsible or liable for any financial losses or damages you may incur as a result of using the Software.
3. No Warranty; "AS IS" Provision
The Software is provided "AS IS" and "AS AVAILABLE", without any warranties of any kind, either express or implied. The creator disclaims all warranties, including, but not limited to, implied warranties of merchantability, fitness for a particular purpose, accuracy, timeliness, completeness, and non-infringement.
The creator does not warrant that the Software will be error-free, uninterrupted, secure, or free of bugs, viruses, or other harmful components. You acknowledge that software is never wholly free from defects, and you are responsible for implementing your own procedures for data accuracy and security.
4. Limitation of Liability
TO THE MAXIMUM EXTENT PERMITTED BY APPLICABLE LAW, IN NO EVENT SHALL THE CREATOR, FADI ZEIDAN, BE LIABLE FOR ANY CLAIM, DAMAGES, OR OTHER LIABILITY, WHETHER IN AN ACTION OF CONTRACT, TORT, OR OTHERWISE, ARISING FROM, OUT OF, OR IN CONNECTION WITH THE SOFTWARE OR THE USE OR OTHER DEALINGS IN THE SOFTWARE.
This limitation of liability applies to any and all damages, including but not limited to:
Direct, indirect, incidental, special, consequential, or exemplary damages.
Loss of profits, revenue, data, or use.
Financial losses resulting from trading decisions made based on the Software.
Damages arising from software defects, interruptions, or inaccuracies.
5. Indemnification
You agree to indemnify, defend, and hold harmless the creator, Fadi Zeidan, from and against any and all claims, liabilities, damages, losses, or expenses, including reasonable attorneys' fees and costs, arising out of or in any way connected with your access to or use of the Software.
6. Acknowledgment and Agreement
By accessing, installing, or using the [My Setup ] indicator, you acknowledge that you have read, understood, and agree to be bound by the terms of this disclaimer. If you do not agree with these terms, you must not use the Software.
ICT Turtle SoupICT Turtle Soup identifies classic “failed breakout” reversals after liquidity sweeps of recent highs/lows, then augments the setup with volume validation, market structure context, Kill Zone (session) filters, Order Blocks (OB), Fair Value Gaps (FVG), OTE (61.8–78.6%) zones, and optional risk targets (SL/TP 1:1, 1:2, 1:3). A compact dashboard summarizes current context (recent high/low, lookbacks, active session, structure state, mitigation counts).
What the Script Does
⦁ Detects Turtle Soup events: Price breaks a prior swing extreme and then quickly reverses back inside the range.
⦁ Grades signal quality: Factors include reversal speed, volume confirmation, breakout magnitude, and consecutive patterns.
⦁ Overlays market context: Trend/range classification (ADX / MA / ATR Bands / Combined), Kill Zones (Asian/London/NY), and time-of-day filters.
⦁ Marks IMB / mitigation zones: Draws Order Blocks and Fair Value Gaps, with optional live mitigation tracking and fading/removal on mitigation.
⦁ Shows OTE zones (61.8–78.6%) after confirmed reversals to highlight potential pullback entries.
⦁ Plots risk management guides: Optional SL buffer below/above reversal wick and TP bands at 1:1, 1:2, 1:3 R multiples.
⦁ Emits alerts on bullish/bearish Turtle Soup confirmations.
How It Works (Conceptual)
1. Liquidity Sweep & Breakout Check
⦁ Looks back over user-defined windows (single or multiple lookbacks: short/medium/long) to find the most recent swing high/low.
⦁ Flags a breakout when price pierces that swing (above for bearish, below for bullish).
⦁ Optional breakout bar volume check requires volume > avg(volume, N) × multiplier.
⦁ Optional swing age check requires the broken swing to be at least X bars old.
2. Reversal Confirmation
⦁ Within N bars after the sweep, validates a mean-reversion close back inside the prior range with a minimum wick/body ratio to confirm rejection.
⦁ Quality Score adds points for:
⦁ Speed: reversal within fast_reversal_bars;
⦁ Volume: breakout and/or reversal volume spike;
⦁ Series: previous consecutive signals;
⦁ Magnitude: sufficient sweep distance.
⦁ Optional high-quality filter only shows signals meeting a minimum score.
3. Context Filters (Optional)
⦁ Sessions/Kill Zones: Only allow signals in selected sessions (Asian/London/NY) with fully custom HHMM inputs.
⦁ Time Window: Restrict to specific hours (e.g., 08–12).
⦁ Market Structure: Classify Trending vs. Ranging (via ADX, MA separation/slope, ATR bands, or Combined). You can allow signals in trends, ranges, or both.
4. Smart Confluence Layers
⦁ Order Blocks: Finds likely OBs with structural validation (e.g., bearish up-candle prior to down move), imbalance score (body/range × volume factor), and extend-until-touched with mitigation % tracking.
⦁ Fair Value Gaps: Detects valid 3-bar gaps (bull/bear) with size threshold, supports touch / 50% / full mitigation logic, and can fade or remove after mitigation.
⦁ OTE Zones: After a reversal, projects the 61.8–78.6% retracement box from the actual swing range; offset scales to timeframe to avoid clutter.
5. Risk & Display
⦁ SL/TP guides: Optional wick-buffered SL and 1:1/1:2/1:3 TPs.
⦁ Dashboard: Recent high/low, active lookbacks, current session, structure label, and live counts of mitigated OBs/FVGs.
Signals & Visuals
⦁ Bullish Turtle Soup: Triangle up + label (🐢S/M/L/D + star rating).
⦁ Bearish Turtle Soup: Triangle down + label (🐢S/M/L/D + star rating).
⦁ Labels can show: quality stars, FAST/SLOW reversal, reversal & breakout volume tags, previous consecutive count, and last move %.
⦁ Lines/Boxes: OBs, FVGs, OTE zones, SL/TP bands, and optional breakout magnitude line.
Inputs (Key Groups)
⦁ Turtle Soup: Lookbacks (single or S/M/L), reversal bars, wick ratio, magnitude line, reversal speed, volume confirmation (multiplier/length), consecutive tracking.
⦁ Order Blocks: Show/validate structure, lookback, extend-until-touched, mitigation % threshold, colors.
⦁ Fair Value Gaps: Show, min size %, colors, mitigation mode (Touch/50%/Full), optional remove-on-mitigation.
⦁ Kill Zones/Sessions: Enable Asian/London/NY with custom HHMM, colors.
⦁ OTE: Show OTE (61.8–78.6%), color, timeframe-adaptive offsets.
⦁ Signal Filters: Filter by session, time window, market structure method (ADX/MA/ATR/Combined), thresholds (ADX, MA periods, ATR multiplier), trending/ranging allowances, structure label & offset.
⦁ SL/TP: SL buffer %, TP 1:1/1:2/1:3 toggles & colors.
⦁ Breakout Validation: Require breakout-bar volume, min swing age, volume label toggles.
⦁ Alerts: Enable/disable.
⦁ Dashboard: Position, text size, colors, border.
How to Use
1. Markets & Timeframes: Works on FX, crypto, indices, and futures. Start with M5–H1 for intraday and H1–H4 for swing; refine lookbacks per instrument volatility.
2. Core Flow:
⦁ Enable multiple lookbacks for robustness on mixed volatility.
⦁ Turn on validate_swing_significance to avoid micro sweeps.
⦁ Use validate_breakout_volume + use_volume_confirmation to filter weak pokes.
3. Context Choice:
⦁ In ranging environments, allow both sides; in trends, consider counter-trend only at HTF OB/FVG/OTE confluence.
⦁ Narrow to London/NY for higher activity if desired.
4. Entries/Stops/Targets:
⦁ Entry on confirmed label close or at OTE pullback post-signal.
⦁ SL: below/above reversal wick + sl_buffer%.
⦁ TP: scale at 1:1/1:2/1:3 or manage via OB/FVG/structure breaks.
5. Confluence: Prefer Turtle Soup that aligns with OB/FVG zones and Combined structure method for added reliability.
Alerts
⦁ “Bullish Turtle Soup detected” and “Bearish Turtle Soup detected” fire on confirmation.
⦁ Set to Once Per Bar (as coded) or adjust in the alert dialog per your workflow.
Notes & Tips
⦁ Multiple lookbacks (S/M/L) help capture both shallow and deep liquidity sweeps.
⦁ Use market structure label with offset to keep it readable on the right of price.
⦁ Mitigation tracking visually communicates when OB/FVG confluence is no longer valid.
⦁ Dashboard = fast situational awareness; keep it on during live trading.
Limitations & Disclaimer
⦁ This tool is educational and not financial advice. No profitability or win-rate is implied. Markets carry risk; manage position size and test thoroughly.
⦁ Signal quality depends on market regime, spreads, news, and data quality. Backtests/forward-tests may differ.
⦁ Visual objects are capped for performance; old items may auto-clean to keep charts responsive.

OrderBlocks by exp3rts (Non-Repainting)The OrderBlocks by exp3rts indicator automatically identifies and visualizes bullish and bearish order blocks using confirmed, non-repainting fractals combined with Fair Value Gap (FVG) validation for enhanced accuracy.
This tool is designed to help traders spot high-probability institutional price zones — areas where large buy or sell orders previously caused significant moves — allowing you to anticipate potential reversal, continuation, or mitigation levels with precision.
Core Features
✅ Non-Repainting Logic: Uses confirmed 3- or 5-bar fractals only after full pattern completion.
📈 Dynamic Order Block Detection: Marks both bullish and bearish OBs automatically.
⚖️ FVG Filter (Optional): Optionally require a Fair Value Gap within a user-defined distance to confirm valid OBs.
🎯 Customizable OB Lines: Adjust color, style (solid, dashed, dotted), width, and body/wick placement.
🧹 Auto-Cleanup: Option to remove order block lines once price has been mitigated (touched/filled).
🔺🔻 Fractal Display: Toggle fractal highs/lows on or off for extra structure clarity.
⚡ Optimized for Performance: Uses efficient array management to run smoothly within TradingView’s bar processing limits.
How to Use
Add the indicator to your chart.
Adjust settings such as Fractal Filter (3/5), FVG distance, and Line Style to match your trading preference.
Watch for bullish OBs (green lines) near potential demand zones and bearish OBs (red lines) near supply zones.
Use in confluence with market structure and liquidity concepts for best results.
Settings Overview
Fractal Filter: Choose between 3-bar or 5-bar swing fractals.
Order Block Type: Detect OBs based on Close or High/Low break structure.
FVG Filter: Optionally require nearby Fair Value Gaps.
Delete After Fill: Automatically remove mitigated OBs.
Visuals: Customize line color, thickness, and style for clear chart integration.
Made for any timeframe & any market.
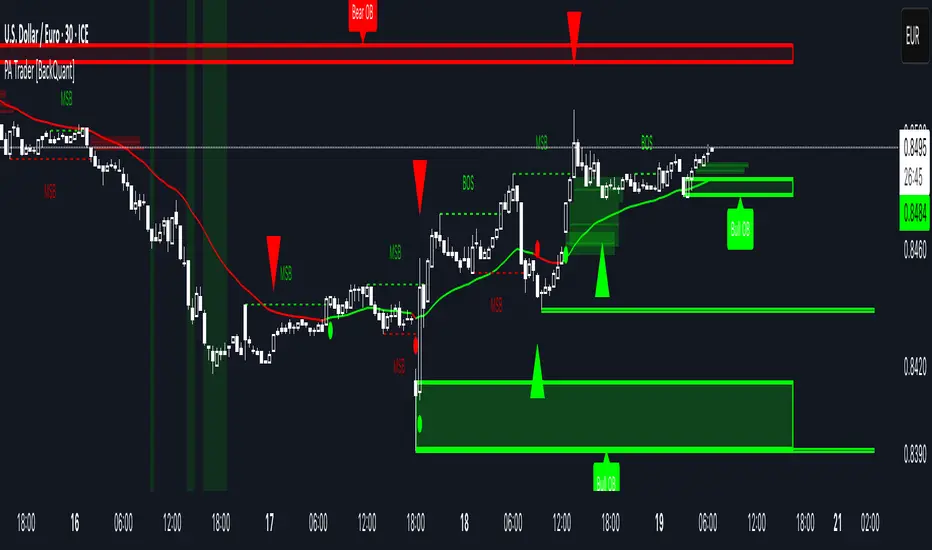
Price Action Trader [BackQuant]Price Action Trader
Introduction
Price Action Trader is an all-in-one, chart-side workflow for reading trend, timing impulses, and mapping high-probability zones the way discretionary traders actually trade. It blends an ensemble trend engine with clean price-action building blocks—Market Structure (BOS/MSB), Fair Value Gaps, Order Blocks, and Volumetric Support/Resistance—so you can form a bias, find confluence, and execute with context.
What is it
A modular “price-action stack” that:
Paints trend bias and impulse shifts on the chart (optional candle coloring).
Auto-annotates internal & swing structure (BOS / MSB).
Finds FVGs on your chosen timeframe and draws them cleanly.
Detects Order Blocks (with optional FVG confirmation).
Builds volumetric S/R levels that adapt to liquidity.
Emits alerts for key events (new levels, touches, breaks, OB creation/touch).
Everything is configurable—keep it minimal (trend + a few zones) or run the full toolkit.
What’s it used for
Bias first, trade second: establish direction/conviction, then execute where structure, gaps, blocks, and volume agree.
Timing: impulse flips and level touches provide actionable triggers.
Risk placement: OB edges, FVG midlines, and volumetric bands give logical stop/target references.
Review & journaling: optional session shading and labeled structures make post-trade notes simple.
Composite Trend Model
A lightweight signal line (default: 30-period) that turns green when the composite regime is bullish and red when bearish. Under the hood, multiple cues (adaptive momentum, de-noised oscillation, volatility-aware filters) are blended into a single directional score; when thresholds flip, the line recolors and optional Long/Short dots appear.
How to use
Treat the line as your bias rail : favor longs while green, shorts while red.
Flat/rapid flips = stand down or reduce size.
Prefer clean charts? Keep only the line and (optionally) trend-painted candles.
Inputs to know
Show Trend Signal Line / Width.
Paint Candles by Trend.
Long/Bearish color controls.
Impulse Model
Highlights short-term pressure shifts with optional impulse candle coloring and ▲/▼ markers. Great for entries in the prevailing trend and for early warnings when impulses fire against bias.
How to use
Up-bias: look for the next impulse-up near structure/FVG/OB or volumetric support.
Down-bias: mirror the logic.
Frequent counter-impulses → expect chop or regime change.
Inputs to know
Show Impulse Signals.
Paint Impulse Candles.
Market Structure
Automatic Internal (tight lookback) and Swing (wider lookback) structure with BOS and MSB (CHoCH) labels. You decide what to show—All, BOS only, MSB only—independently for internal vs swing.
How to use
Use Swing labels for the primary map; Internal for entry refinement.
After a bullish MSB , seek the first HL back into support/FVG/OB.
After a bearish BOS , favor LH fades into resistance/FVG/OB.
Inputs to know
Swing Lookback / Internal Lookback.
Swing/Internal Structure: All | BOS | MSB | None .
Separate bull/bear color controls for both layers.
Fair Value Gaps
Detects bullish/bearish FVGs on the current or higher TF, draws boxes, and can extend them forward. Midlines provide quick visual targeting.
How to use
In-trend fills: in an up-bias, tags of bullish FVGs often offer high-quality continuation entries, especially with structure/OB confluence.
Failed fills: rejections at the midline can signal emerging strength/weakness.
Inputs to know
Show FVG / Show Last N / Extend.
Timeframe (blank = chart TF; set higher TF for macro FVGs).
Bull/Bear colors (tune opacity to taste).
Volumetric Support and Resistance
Builds adaptive S/R from price interaction + relative volume over a rolling lookback. Levels store touch counts; you can show volume stats on labels or inside boxes. Transparency and border thickness can scale with volume so stronger levels are visually louder. Broken levels can auto-remove.
How to use
Use as confluence with structure, OBs, and FVGs. A long at volumetric support + Bull OB + FVG midline is qualitatively different from a naked level.
If a level breaks on strong volume, stop fading—flip expectations or wait for a clean retest.
Inputs to know
Detection Sensitivity / Volume Multiplier.
Analysis Period / Max Levels / Min Distance (%).
Remove Broken / Extend Right / Show Volume Info / Text Inside.
Support/Resistance colors (+ high-vol variants).
Alerts
New Support/Resistance Level Created.
Level Touch.
Level Break.
Order Blocks
Detects bullish/bearish OBs using configurable fractals (3- or 5-bar) with a break confirmation (by Close or High/Low). Optional FVG proximity filter, right-extension, and auto-delete when filled.
How to use
Bullish bias: stalk pullbacks into fresh Bull OBs aligned with a bullish FVG or volumetric support.
If price fills an opposing OB and fails to continue, reassess bias—context may be shifting.
Inputs to know
Fractal Type & Break Method (Close / HL).
Filter with FVG + Max FVG Distance.
Extend Blocks / Delete When Filled / Show Labels.
Alerts
New Order Block Created.
Order Block Touch.
Final Notes
Suggested workflow
Start with Composite Trend (bias).
Mark Swing structure in that direction.
Wait for an Impulse in-direction near an OB / FVG / Volumetric level.
Risk = nearest opposite level or OB edge; targets = FVG midlines / next S/R.
Timeframes & assets
Defaults suit liquid intraday and 1–4H swing.
Slower markets → lengthen lookbacks, lower sensitivity.
Very noisy crypto → keep trend visible, trim drawings (e.g., MSB only, last 3–5 FVGs, 8–12 volume levels).
Keep it readable
Turn off modules you don’t need today—fewer, higher-quality signals beat clutter.
About this release
Internal scoring, smoothing, and detection logic are proprietary. Behavior is controlled via inputs described above.
Trade with a plan, test your settings, and let confluence do the heavy lifting.
Multi TF - HTF→LTF OrderblocksMulti TF — HTF→LTF Orderblocks
Identify higher-timeframe (HTF) order blocks and project them onto your lower-timeframe (LTF) chart—clean, fast, and publication-ready.
The script automatically detects swing breaks on your chosen HTF, builds the originating order block, and renders that zone on your current chart so you can execute on lower timeframes with higher-timeframe context.
--------------------
How it works
HTF swing structure is tracked via pivot highs/lows and a user-selected break confirmation (Close or Wick).
On a valid break, the script backtracks to the last opposite candle and creates the HTF order block (wick-to-wick or body-only depending on your setting).
The OB is projected to the LTF and extended bar-by-bar until:
Mitigation: price penetrates at least 50% of the zone → the box is marked “old” (dimmed) or optionally auto-deleted.
Close-break: price closes beyond the far edge → zone is optionally removed immediately.
Each zone includes a centerline and an inside label showing the original HTF (e.g., “M15”, “H1”).
Key features
True HTF→LTF overlay: trade M1/M5 with M15/H1/H4 context.
Mitigation logic (≥50%): first meaningful touch turns the zone “old” or deletes it (your choice).
Close-break handling: auto-remove zones broken by close, to keep charts clean.
Overlap control: choose how to handle overlapping zones on the same side:
Keep Latest, Union (merge), or Intersection (refine).
Wicks vs. Bodies: build zones from full candle range or just the body.
Lightweight UI: only the relevant inputs in the panel; sensible defaults.
Alert included: fires on the first 50% mitigation of any fresh zone.
Performance-friendly limits: cap the number of active zones to fit Pine limits.
Inputs (quick overview)
HTF for Order Blocks: timeframe to scan (e.g., 15, 60, 240, D).
Swing Length (Pivot L/R): pivot sensitivity for structure.
Break Confirmation: Close (recommended) or Wick.
Zones use Wicks: on/off for wick-to-wick zones.
OB Lookback before Break: how far to search for the opposite candle.
Max Active Zones: hard cap for chart cleanliness & performance.
Delete on Close-Break: remove zones that are invalidated by a close.
Delete after Mitigation: remove once a 50% touch occurs.
Handle Overlap: None, Keep Latest, Union (merge), Intersection (refine).
Colors & Border: fresh/old zone colors (default ~35% opacity) and optional borders.
Default profile (as shipped):
Break by Close, zones use wicks, Union overlap handling, 250 lookback, 250 max zones, borders off, and HTF label printed inside each zone.
How to use (suggested workflow)
Pick an HTF (e.g., H1 for intraday) and drop to your execution TF (e.g., M5/M1).
Wait for price to tap ≥50% of a fresh OB → look for your LTF trigger (CHOCH, iFVG, PA).
Place SL beyond the zone (or beyond the LTF swing) and manage to your targets (e.g., 2R–3R or to the next HTF OB).
Keep charts clean by enabling Delete on Close-Break and (optionally) Delete after Mitigation.
Alerts
“OB: Zone berührt (Erstkontakt)” — triggers on the first ≥50% mitigation of any fresh zone.
Create additional TradingView alerts with this condition to get notified in real time.
Notes & limitations
Built with request.security(..., lookahead_off) to avoid future-bar peeking; zones only form after a confirmed HTF break.
As with all pattern-based tools, use alongside your risk management and a defined entry model.
Pine has strict limits on drawings; use Max Active Zones to balance coverage and performance.
Credits
Designed for traders who want HTF precision with LTF execution—a clean, opinionated OB overlay that focuses on what matters: fresh zones, first touch, and invalidation.
Order Blocks & FVG (Kostya)the indicator is the attempt to visualize the trading opportunities - price magnets and potential reversal zones for intraday and swing trading.

SMC ToolBox [WinWorld]👋 INTRODUCTION
SMC ToolBox indicator is not just a simple indicator, but rather a collection of SMC-related algorithms, that our teams has found to make the most profound impact on determination process of the most high-quality liquidity zones and points of interests ( further – POIs ), hence the name of the indicator – Tool Box (and it also sounds cool :) .
From candle patterns to complex orderflow detection algorithm, ToolBox indicator will help any trader with search for useful tools, solving the needs from confirming position entry levels to trend-following and mean reversion opportunities.
❓ WHY DID WE BUILD THIS?
This indicator was initially built for our team's internal use for the sole purpose of gathering all actively used non-structure-related algorithms* in one place, so we could have only the tools that are truly needed at hand at any point of time. After we showed this tool to our trading partners, they were surprised about how light, fast and useful ToolBox was and they advised us on sharing this with our community and, after giving it a proper thought, we decided to follow their advice.
Funnily enough , after researching TradingView's open-source script library, we haven't found even one instance of even remotely alike indicators, so it fair to say that we are one of the first people to release this kind of SMC-related indicator bundles on the market and we strongly that TradingView's community will find this tool of use.
🤷♂️ WHY SHOULD YOU CARE AT ALL?
Frankly speaking, we are not the first people to build our own algorithms of such popular indicators like Equal Highs and Lows (EQHL), Previous Day High Low (PDHL), Orderflow (OF) and etc., but we are definitely one of the first teams to implement these indicators with the help of algorithms, that are actually used by the most professional traders on YouTube and other social media trading influencers. Simply taking trades from our SCOBs, OFs, EQHLs and etc. won't print you millions overnight, but what these algos will do is help you with being aware of is potentially laying ahead of you with a very clean probability.
Why does it matter? It simple: better market awareness gives you an edge over other trades, which use old algorithms, which are clearly outdated, so beating such traders in the long run is just a game of time for you, so good algorithms do matter. Each indicator inside ToolBox is there to help you develop this market awareness and forge your edge bit by bit.
Now let's talk about what is inside the ToolBox.
🔍 OVERVIEW
At the moment of publishing ToolBox contains 8 indicators, so say "Hello" to:
Price Border Bands (further – PBB) ;
Ordeflow (further – OF) ;
Equal Highs & Lows (further – EQHL) ;
Previous Day High & Low ( further – PDHL) ;
Single Candle Order Block (further – SCOB) ;
Institutional Funding Candle (further – IFC) ;
Engulfing Candle (further – EC) ;
Inside Bars (further – IB) .
Some of them you may know, some of them you may not, so let's review each of them one by one.
📍 INDICATOR: Price Border Bands (PBB)
Price Border Bands indicator is a simple yet useful algorithm, based on Triangular Moving Average (TMA), which helps determine extreme price spikes, which on average act as meaningful mean reversion opportunities. It also is a good an effective "verifier" of POIs and zones of interest (further – ZOI) .
We advise on using this indicator this way:
Look for price going beyond upper or lower band of PBB;
Look for price reaching POI or ZOI;
Start searching for your entry point.
The most common sign of potential price reversal, which PBB searches for, is intense price spike, which signals about "liquidity clearing" or, in simple terms, manipulation .
Manipulation of the price inside the POI or price being "stopped" by POI is a screaming sign of the potentional following reversal. See the example of such situation on the screenshot below:
Additionally we need to talk about trend filter inside PBB, which colours the bars on the chart under certain conditions. If bars on the chart are being coloured in gray – this is your sign to stop trading on this asset? because there is risk to catch an uncomfortably big price spike, which might turn the '+' of your position's PnL in to '-'. See the example of PBB highlighting bar's of risky price zone in gray colour on the screenshot below:
In order to continue trading you need to wait for bars to stop being coloured in gray OR confirm the fact that price made Change of Character (ChoCh) in reverse to the previous direction of price, which was marked as risky by PBB.
And last but not least: if you see POI being reach by price inside the bands of PBB, then consider this POI weak and avoid trading it. See the example of weak POI inside PBB bands on the screenshot below:
📍 INDICATOR: Orderflow (OF)
Orderflow indicator is an algorithm, which detects Sell-to-Buy (furthert – STB) or Buy-to-Sell (further – BTS) manipulations, using the algorithm of impulse & correction price movement detection, taken from one of our previously built indicators – Impulse Correction SCOB Mapper (ICSM) .
Let's explain the terms from above:
Impulse – series of bars, each bar of which consecutively updated previous bar's high and then last candle broke previous bar's low ;
Correction – series of bars, each bar of which consecutively updated previous bar's low and then last candle broke previous bar's high ;
STB – a type of price manipulation, which can be described as a correction of price inside global upward movemnt;
BTS – a type of price manipulation, which can be describd as a impulse of price inside global downward movement.
Unlike traditional order blocks, which are often narrower and more selective, Orderflow zones cover a wider price range and present a higher probability of mitigation. This makes them more reliable for entries in ovaerage in comparison to classic orderblocks.
Let's review examples of bullish and bearish orderflows on the screenshots below:
Bullish orderflows (STBs) (blue boxes with "OF" text inside)
Bearish orderflows (BTSs) (orange boxes with "OF" text inside)
The usage of ZOIs, detected by OF algorithm, is pretty straightforward: take trades against the ordeflow block, that price has reached. Even though we don't recommend relying on Orderflow blocks as sole producers of signals, you can use them as such in way, that can be described like this:
Place stop-loss (SL) beyond the furthest border of OF block (bottom of the bullish OF or top of the bearish OF), that price has reached;
Aim for >2:1 RR ratio and place your take-profit (TP) accordingly.
You can see the example setups of OF blocks as signal producers on the screenshots below:
Examples of LONG trades, taken from price reaching bullish OF block.
Examples of SHORT trades, taken from price reaching bearish OF block.
Summarising, Orderflow can be described as a tool that helps determine the STB and BTS price manipulations, which are great price ZOIs and can be used both as confirmation tools for your exisiting signals and sole signal producers, in which case such they needed to be handled extra mindfully and preferrably bonded with other tools for additional confirmation. We personally recommend using Ordeflow as confirmation tool, because ZOIs, detected by Orderflow, are usually the price ranges, around which traders tend to place their stop-losses, which only gives more strength to these zones for supporting the price and helps traders with "trading from support/resistance" strategies gain additional edge.
📍 INDICATOR: Equal Highs & Lows (EQHL)
EQHL indicator is an algorithm, which scans the extremums of impulse and correction movements, detected by our ICSM indicator , and marks ones which are roughly or equaly placed on the same price levels. Equal highs (further – EQH) and equal lows (further – EQL) are local liquidity pools, where stop orders and resting orders cluster; price often gravitates to these zones for liquidity “top-ups,” after which a reaction or continuation to the next liquidity source may occur. Basically, EQHL algorithm highlights clusters of equal extremes as navigational anchors for “collect → react → confirm” scenarios.
Talking about usage, we advise to not take swept or reached EQHLs as entries by themselves. Evaluate them alongside HTF structure, Inducement (IDM), orderblocks (OB), orderflow (OF), candle pattern context (e.g., IFC/EC) on the LTF and etc. Intended usage scenario of this algorithm is something like this:
Price reaches EQH/EQL;
Price hangs around the reached EQH/EQL;
Another tool (for example, OF or OB) signals about price reversals from the level of reached EQH/EQL;
Trader starts looking for an entry.
See the examples of EQHLs, which algorithms maps on the chart, on the screenshots below:
Equal Lows (EQLs)
Equal Highs (EQHs)
📍 INDICATOR: Previous Day High & Low (PDHL)
PDHL indicator is an algorithm, princples of work of which can be derived from its name: algorithm tracks previous day's high and low and displays it on the chart.
Previous day's high and low are fundamental POIs in any financial market, which are traded not only by SMC traders, but by many other traders, especially by traders, which consider these POIs are one of the most crucial, because they usually highly liquidity-rich and can signal about wondeful reversal opportunities.
We expect traders to use PDHL algorithm as confirmation tool when trading by mean reversion strategies. Usage of PDHL as signal source is advised against, but traders are free to experiment nevertheless.
PDHL algorithm shows two types of PDHLs on the chart: active PDHL (solid line) and swept PDHL (dashed line) . You can the examples of PDHLs, detected by our algorithm, on the screenshot below:
📍 INDICATOR: Single Candle Order Block (SCOB)
SCOB indicator is an algorithm, which marks a very specific POIS, which are based on of the most simple yet highly profound SMC and candle pattern principles and are usually a good alternative for classic orderblocks.
Principles of SCOB detection are very simple:
Price sweeps previous candle's extremum (high/low). So called "liquidity sweep" ;
Immediately after step 1 price forms a fair value gap (FVG).
You can see basic examples of bearish and bullish SCOBs on the screenshot below:
As a matter of fact, SCOB can be used both as a confirmation tool and source of signals. However! To be a source of signals, SCOB is most suitable to be used while trading on lower timeframe (LTF), while trading on a higher timeframe (HTF) on average requires to look at SCOB as a POI rather than as independent source of signals. That being said, we would like additionally to point out, that due to the nature of SCOB being an orderblock, this tool by its nature is best suitable as confirmation tool and we expect traders to use it as such, but either way this indicator is quite multifunctional and can be used by each trader for a more specific purposes.
SCOBs, which are detected by our algorithm, are painted on the chart either as coloured candles (SCOBs without inside bars) or coloured boxes (SCOBs with inside bars) . You can see examples of SCOBs, which were detected by our SCOB algorithm, on the screenshot below:
📍 INDICATOR: Institutional Funding Candle (IFC)
IFC is a candle, which is a more strict version of SCOB. Our algorithms detects an IFC, if SCOB satisfies these conditions:
SCOB candle has large shadow (more than 50% of candle's body);
SCOB candle has large range ( | high - low | is more than a certain value, which is base on ATR).
That's basically it! Being simple as that, IFC represents itself as a high-trust SCOB, which on average has larger chance of reversing price when IFC candle is reached by it and our practice shows that it is indeed the case. IFC candles are usually go hand in hand with large price and volume spikes, which are believed to be caused by large institutional players, who trading eager to catch retail trader's stop orders, which they usually place around POIs like IFC and SCOB.
We expect traders to use IFC as a tool for entry confirmation bias, especially when considering IFC from HTF.
You can see IFC, which our algoritms detects on the chart, on the screenshot below:
📍 INDICATOR: Engulfing Candle (EC)
An Engulfing Candle is a candle, which occurs when the current candle’s body engulfs the prior candle’s body, showing a short-term shift in demand/supply balance. In SMC context, it is most useful around POIs/liquidity as a contextual confirmation element. The indicator marks bullish and bearish EC without implying a “must reverse” outcome – it’s a focus cue, not a promise.
As with any other alike tool, this algorithm should not be used as sole source of signals, but rather as a confirmation tool. ECs near support/resistance zones or POIs are typically more impactufl than those inside choppy consolidations. Structural and LTF price impulse confirmation usually enhances existing position bias in a positive way.
You can see examples of engulfing candles on the screenshots below:
Bullish engulfing candles
Bearish engulfing candles
📍 INDICATOR: Inside Bars (IB)
Inside Bars are bars, which are contained inside the range of high and low prices of the bars preceding them. This algorithm was designed to showcase periods of potential price consolidation/volatylity compression and quite often precedes price movement towards closest liquidity POIs and ZOIs. When price finally breaks out of its previous range, it usually provides good opportunities for entering trades using breakout strategies (especially ones, that are based on SMC principles) .
You can see examples of IBs, which are detected by our algorithm on the chart, on the screenshot below:
That was a long list of features, now let's talk about settings now.
🔔 WHAT ABOUT ALERTS?
At the moment of publishing this indicator includes alerts for all algorithms, which are included inside, except for Inside Bars (IB) algorithm .
⚙️ SETTINGS
At the moment of publishing most of the settings in this indicator are about styling for indicator's visuals, because by design most of the included algorithms (excluding PBB) don't rely on inputs of any technical kind. Let's review them.
ToolBox | General Styling
Text Size – (Tiny, Small, Normal, Large) – defines text size of indicator's visuals, which use text-based visuals.
Price Border Bands | Main Settings
Show Price Border Bands – toggles on/off the display of PBB;
Half Length – defines amount of bars, used for calculation of the PBB's TMA;
Price Source – defines price source for PBB's TMA;
ATR Multiplier – affects the width of PBB's bands;
ATR Period – affects the amount of bars for ATR calculation.
Orderflow (OF) | Settings
Bullish OF – toggles on/off the display & colour of bullish OF;
Bearish OF – toggles on/off the display & colour of bearish OF;
Show border – toggles on/off the display of OF blocks' border.
Single Candle Order Block (SCOB) | Settings
Show SCOB – toggles on/off the display of SCOB;
Bullish – toggles on/off the colour of bullish SCOB;
Bearish – toggles on/off the colour of bearish SCOB.
Equal High/Lows (EQHL) | Settings
Show EQH/EQL – toggles on/off the display of PDH/PDL;
EQH – toggles on/off the colour of EQH;
EQL – toggles on/off the colour of EQL.
Institutional Funding Candle (IFC) | Settings
Show IFC – toggles on/off the display of IFC;
Bullish – toggles on/off the colour of bullish IFC;
Bearish – toggles on/off the colour of bearish IFC.
Previous Day High & Low (PDHL) | Settings
Show PDH/PDL – toggles on/off the display of PDH/PDL;
Show PDH/PDL – toggles on/off the display of the past history of swept PDH/PDL;
Show previous day divider – toggles on/off the display of dashed gray line, which separates new day from previous one;
Bullish – toggles on/off the colour of bullish IFC;
Bearish – toggles on/off the colour of bearish IFC.
Engulfing Candle (EC) | Settings
Show engulfing candles – toggles on/off the display of EC;
Bullish – toggles on/off the colour of bullish EC;
Bearish – toggles on/off the colour of bearish EC.
Inside Bars (IB) | Settings
Show inside bars – toggles on/off the display of IB;
Bullish – toggles on/off the colour of bullish IB;
Bearish – toggles on/off the colour of bearish IB.
Alerts | POI
Alert Frequency – (Once Per Bar, Once Per Bar Close) – defines alert frequency of the indicator's alert for all POIs;
* all other buttons from this group of settings toggle alerts on/off.
PBB;
OF;
SCOB;
EQH;
EQL;
IFC;
PDH;
PDL;
EC.
🏁 AFTERWORD
SMC ToolBox indicator is designed to be the ultimate swiss knife, which might bring you quantifiable results when trying to crack the market's secret of where the liquidity is placed. This indicator doesn't produce any particular signals not it gives any financial advice, but it helps you deepen understanding about potential existing liquidity zones and price points by employing principles of SMC algorithms, which are most commonly used by retail traders on a daily basis.
You can view this indicator as a Christmas candy box: you pick only the candles (indicators) you need and want. We expect any trader to use this indicator by exactly same way: you should take onlt the things you need to enhance your strategy, not worrying about what to do with other indicators, fi they don't suit you.
Lastly, we would like to share our team's recommendations (they are optional, of course) on how to use certain POIs from ToolBox:
Use PBB as a filter for validating POis. Pay close attention to the rule "don't trade POIs, which are located inside the bands of PBB" (described above in "INDICATOR: PBB") ;
Use Orderflow to find short-term and mid-term trading opportunitions for trend-following strategies, using OF blocks as resistance in bearish trend and support in bullish trend;
Use EQHL and PDHL indicators when trading by mean-reversion strategies on intraday timeframes. These indicators will be especially of use to forex, stock and crypto traders;
Use SCOB and IFC indicators when trading by mean-reversion strategy to find short-term reversal opportunities;
Use ECs and IBs as confirmation/denial tools for your entry ideas. We recommend avoiding trading If price is currently going inside HTF's IB range.
We have no doubts that SMC ToolBox indicator will be of use to any trader, who employs and desire to employ SMC principles in his strategy. We will be waiting for your feedback, meanwhile you can ask your questions in the comments :)
Sincerely,
WinWorld team.

True Order Block (OB) True Order Block (OB)
This script automatically detects and plots Order Blocks (OBs) based on the presence of Fair Value Gaps (FVGs).
Only Order Blocks are displayed on the chart.
🔎 How it works
The script looks for Fair Value Gaps (FVGs) according to a relaxed 3-candle definition.
Once an FVG is detected:
For a Bullish FVG → the last bearish candle before the gap is marked as the Bullish Order Block.
For a Bearish FVG → the last bullish candle before the gap is marked as the Bearish Order Block.
OBs are extended into the future until price either:
mitigates the zone (optional auto-removal), or
the number of live OBs exceeds the user’s maximum (FIFO cleanup).
⚙️ User settings
Draw Order Blocks (enable/disable plotting)
Minimum OB length (how far each zone extends initially)
Remove OB after violation (auto delete invalidated zones)
Max active OBs (limit on displayed zones for clarity)
Bullish/Bearish OB colors
✅ Key features
Fully automated OB detection
No clutter – only OBs are plotted (FVG logic hidden in the background)
Smart cleanup: mitigated zones are removed automatically
Customizable colors & limits
⚠️ Notes
This tool is designed for educational and analytical purposes only.
It does not generate trade signals.
Always combine with your own strategy, market context, and risk management.

Svl - Trading SystemPrice can tell lies but volume cannot, so keeping this in mind I have created this indicator in which you see sell order block and buy order block on the basis of price action + volume through which we execute our trade
First of all, let us know its core concepts and logic, which will help you in taking the right decisions in it.
core concept of the " Svl - Trading System " TradingView indicator is based on professional price action, volume, and swing structure. This indicator smartly gives real-time insights of important price turning points, reversal zones, and trend continuation. Its deep explanation is given below.
Edit - default swing length -5 , change according your nature , tested With 7 For 5 minute timeframe
Core Concept:
1. Swing Structure Detection
The indicator automatically detects swing highs (HH/LH) and swing lows (HL/LL) on the chart.
HH: Higher High
HL: Higher Low
LH: Lower High
LL: Lower Low
These swings are the backbone of price action – signaling a change in trend, a bounce, reversal or trend continuation.
2. Order Block (OB) Mapping
Buy Order Block (Buy OB): When the indicator detects the HL/LL swing, we declare Buy OB, the lowest point of the swing.
Sell Order Block (Sell OB): On HH/LH swing, the highest point of our swing is called Sell OB.
Order Blocks are those important zones of price where historically price has reacted strongly – where major clusters of buyers/sellers are located in the market.
3. Volume Analysis (Optional Dashboard/Barcolor)
The candle color depends on the volume ranking on the chart (most high/low, normal, pressure blue shade).
Highest/lowest volume candles are a special highlight, which helps to spot liquidity spikes, exhaustion, or big orders.
4. Live Dashboard
There is an automated dashboard in the top-right of the chart, which shows this in real-time:
Last swing type (HH/HL/LH/LL)
Reversal price (last swing level)
Swing direction (Bull/Bear/Neutral)
Volume, Buy OB, Sell OB, etc.
This helps the trader understand the market situation at a glance.
5. Smart Plotting/Labels
Buy/Sell are plotted as distinct lines on the OB chart.
The Labels option gives clear visual swing points.
All calculations are fast and automated – the user does not need to mark manually.
This indicator is an advanced, fully-automated price action tool that combines
trend, reversal, volume, liquidity and zone detection in one smart system,
makes entry/exit decisions objective and error-free,
and provides complete trading confidence with a live monitor/dashboard.
All of its functions/properties such as: swing detect, OB plot, volume color, dashboard follow best practice for professional chart analysis!

Apex Edge – Liquidity RaiderApex Edge – Liquidity Raider
The Predator That Hunts Where Retail Never Looks
The Liquidity Raider is not your average liquidity line plotter.
This is an institutional-grade hunting system that tracks the pools of liquidity Smart Money algos stalk — and tells you exactly when price is circling in for the strike.
Where most retail tools simply mark lines, this one acts like a predator:
Scans the chart dynamically to detect clustered highs & lows (pivot-based liquidity zones).
Filters noise with sensitivity & price rounding so you only get real liquidity levels — not every random swing.
Plots live BSL (Buy-Side Liquidity) & SSL (Sell-Side Liquidity) lines in clean dotted format.
Auto-deletes levels when swept, so your chart stays clean and focused.
Triggers directional arrows when price comes within your specified % distance to the target liquidity pool — before the market moves.
EMA confluence layer lets you align with institutional flow (customizable Fast & Slow EMAs).
Core Power
Cluster Logic – Finds high-probability liquidity zones using repeated pivot levels.
Sweep Awareness – Lines vanish the moment liquidity is taken, keeping focus on the next pool.
Proximity Strike Detection – Arrow signals only when price is within striking range.
Directional Clarity – Red arrows = targeting BSL, Green arrows = targeting SSL.
Scalable Across Timeframes – Adapts to your chart’s timeframe with dynamic lookback scaling.
Institutional Flow Filter – Optional EMA confirmation keeps you aligned with the real trend.
How to Use
Identify liquidity pools – Dotted green = buy-side, dotted red = sell-side.
Watch proximity arrows – These mean price is in range and hunting that pool.
Align with EMA bias – Enter only in the direction of institutional momentum.
Target the sweep – Your take profit is where the liquidity is resting.
Why Liquidity Raider Wins
This is not a lagging signal system.
It’s a real-time, clean, predictive tool designed to mimic the targeting logic of high-frequency algos.
By removing swept levels and focusing only on the next available pools, Liquidity Raider keeps you one step ahead of the crowd — and perfectly positioned for the kill shot.

Leola Lens Pro📌 Leola Lens Pro — Expansion, Trap & Structure Map (Invite-Only)
This invite-only overlay is designed to give traders enhanced clarity around liquidity shifts, trap zones, and expansion/reversion mechanics — across all timeframes and market types.
Built as an evolution of Leola Lens Standard, the Pro version integrates a more refined structural engine to highlight real-time reaction zones with greater context sensitivity.
________________________________________
🔍 What It Displays
• Dynamic support/resistance zones that evolve with price
• Expansion & reversion levels — visualize where moves may exhaust or reverse
• Liquidity sweep detection to catch trap-based market setups
• Cluster zones that signal areas prone to breakouts or failed entries
________________________________________
🟡 Visual Markers
• 🟡 Yellow Line → Psychological pivot zone
• 🩷 Pink Lines → Pullback or reversal zones (support/resistance traps)
• Adaptive zone shading and slope-based logic enhances readability
________________________________________
📊 Best Suited For:
• Traders identifying value breaks, imbalance zones, or liquidity voids
• Scalpers catching early trap setups before momentum expands
• Swing traders aiming to enter mean reversion trades post-expansion
________________________________________
🔧 Technical Approach & Originality
Leola Lens Pro is powered by original proprietary logic — it does not rely on public Pine scripts, built-in indicators, or volume-based techniques.
• No use of RSI, MACD, MAs, Bollinger Bands, or volatility indicators
• Not a predictive tool — it responds to confirmed structure, slope, and price reaction
• Designed for clarity in both trending and ranging conditions
• Visual performance optimized for 15-minute charts but remains timeframe-agnostic
This implementation provides a novel overlay experience focused on structural adaptability and trap awareness, not traditional indicator signals.
________________________________________
⚠️ Disclaimer
This script is provided for educational and analytical purposes only. It does not constitute financial advice or trade recommendations. Always validate tools through personal testing and risk frameworks.
________________________________________

Breakout Indicator + OB & FVG📈 Breakout Indicator + OB & FVG
This script is designed to assist with identifying potential breakout zones following periods of low volatility or price consolidation. It integrates price structure analysis with optional lunar phase filtering for enhanced visual insights.
🔍 Key Features
Consolidation Detection: Automatically identifies price ranges with low volatility over a user-defined lookback period.
Breakout Signals: Highlights potential breakout zones when price moves beyond consolidation range highs or lows.
Take-Profit & Stop-Loss Levels: Automatically calculates three TP levels and one SL level based on user-defined multipliers.
Lunar Filter (Optional): Applies a visual overlay during full moon phases as a unique experimental timing filter.
Visual Elements:
Entry/TP/SL levels shown on chart with colored lines and labels.
Consolidation zones shaded with customizable colors.
Dynamic panel with volatility metrics and last signal info.
⚙️ Inputs & Customization
Adjustable lookback period, volatility threshold, and risk multipliers.
Optional lunar phase aggression multiplier.
Full customization of zone colors, label visibility, and transparency.
📌 Disclaimer
This indicator is a visual tool for analysis and does not provide financial advice or guaranteed outcomes. Its purpose is to support discretionary decision-making, not replace it. Past signals do not guarantee future performance. Always test tools thoroughly and use appropriate risk management.
🧠 Developer Notes
Based on simple volatility and price action mechanics.
The lunar filter is symbolic and not based on real astronomical data.
No repainting or future leaks; signals are generated based on confirmed candle closes.

ICT HTF Candles [Pro] (fadi)The ICT HTF Candles shows you multi-timeframe price action by plotting up to six higher timeframe candles on your chart, scaled to real price levels. Set candle counts per timeframe or toggle them off for a clean view, saving you time switching between charts. This helps you spot trends and reversals quickly, align trades with the market’s direction, and time setups like sweeps or bounces better. From scalping on the 1m to swinging on the 4H, it simplifies ICT and Smart Money Concepts (SMC), revealing trend shifts and institutional moves clearly. Once you use it, trading without this clarity just won’t feel right.
Key Features:
In-Depth Price Action Levels
These levels track ICT PD arrays and confluences across timeframes, making it easy to see how price action flows from higher timeframes and what your setup faces. Is your 5m trade about to run into a 1H bearish order block? Did it bounce off a higher timeframe FVG and create an SMT with a correlated asset? They make your chart a clear roadmap to market structure, helping you find strong setups, save time, and align with institutional moves:
Change in State of Delivery (CISD): In ICT trading, CISD marks potential reversal levels on each timeframe by showing the open of the highest series of up (green) candles for a bullish shift or the open of the lowest series of down (red) candles for a bearish shift. These levels are set at the opening price of the first candle in those runs, highlighting where the market turns. The indicator makes these levels easy to spot across timeframes, so you can track reversal points clearly. You can set your own confirmation criteria—a close or wick above/below the CISD line (bearish/bullish) or a close or wick above/below the high/low—to verify the CISD level cross. When confirmed, there is a high probability that we have a change in trend, and a reversal order block forms. CISD helps you track these reversal levels and confirm market shifts, making multi-timeframe analysis straightforward.
Order Blocks: When a CISD level cross is confirmed, the price is now below a series of up (green) candles or above a series of down (red) candles, marking these candles as order blocks that usually support the new trend direction. The indicator shows these levels clearly across timeframes, making it easy to spot high-probability reversal or consolidation areas. Keep in mind that price may sometimes move to mitigate an imbalance, so use your best judgment based on your multi-timeframe analysis to confirm they meet your trading criteria.
Trend Bias: Traders often struggle figuring out market bias—guessing the trend wrong, losing on trades against the flow, or missing how lower and higher timeframes line up. The Trend Bias feature tracks order blocks and change in state of delivery, displaying bullish or bearish trends for each timeframe to help you choose trades that go with the market’s direction. The indicator shows these trends clearly across timeframes, so you can quickly see if the 5m matches the 1H or if you’re going against the bigger trend. This makes it easier to avoid bad trades and make decisions faster, keeping you on track with setups that follow the main trend.
Immediate Rebalance: When looking at price action, you’ll see the market doesn’t usually leave behind many Fair Value Gaps (FVGs). That’s because the market is efficient and always rebalancing any inefficiencies. When the market starts a strong move, the last candle will usually close above the previous candle high (for up moves) or below the low (for down moves). At this point, the market will do one of two things: immediately rebalance by retracing first, or have a small retracement but leave behind an FVG. The Immediate Rebalance feature tracks rebalance levels across multiple timeframes, clearly showing where price rebalances. This helps traders have a better expectation of how the market may need to retrace and anticipate Power of Three (PO3) setups by being ready for a Judas swing to rebalance the imbalance.
Fair Value Gaps and Volume Imbalances: If the market fails to immediately rebalance, it will usually attempt to come back and rebalance it at a later time. FVGs and VIs give you a clear area where the price might be heading if it starts breaking structure on lower timeframes. These inefficiencies—price gaps (FVGs) or aggressive moves (VIs)—show where the market’s working to fix imbalances. The Fair Value Gaps and Volume Imbalances feature tracks these levels across timeframes.
Previous Candle Levels: The Previous Candle Levels feature marks the high, low, and middle of the prior candle on each timeframe, helping you identify key price levels for sweeps, bounces, or breakouts. It tracks the candle’s high and low as its extremes and the middle as the 50% mark, which you can set to calculate using the high-to-low range or the open-to-close range. These levels can provide tradable setups on lower timeframes.
Smart Money Techniques (SMT): What’s an ICT indicator without an SMT feature to track cracks in correlated assets? The ICT HTF Candles monitors your chosen correlated assets, like EUR/USD and GBP/USD or SQ and NQ, for signs of strength or weakness to use as confluence with other features and build the case for A+ setups. The SMT feature spots divergences when one asset makes a higher high or lower low while the other doesn’t follow, hinting at potential reversals or market shifts. It tests SMT using two immediate candles, since higher timeframes (HTFs) create larger gaps on lower timeframes. Traders can easily see these divergence levels, like a 15m SMT lining up with a 1H order block or CISD, helping you confirm high-probability setups and strengthen trade entries with multi-timeframe confluence.

Multitimeframe Order Block Finder (Zeiierman)█ Overview
The Multitimeframe Order Block Finder (Zeiierman) is a powerful tool designed to identify potential institutional zones of interest — Order Blocks — across any timeframe, regardless of what chart you're viewing.
Order Blocks are critical supply and demand zones formed by the last opposing candle before an impulsive move. These areas often act as magnets for price and serve as smart-money footprints — ideal for anticipating reversals, retests, or breakouts.
This indicator not only detects such zones in real-time, but also visualizes their mitigation, bull/bear volume pressure, and a smoothed directional trendline based on Order Block behavior.
█ How It Works
The script fetches OHLCV data from your chosen timeframe using request.security() and processes it using strict pattern logic and volume-derived strength conditions. It detects Order Blocks only when the structure aligns with dominant pressure and visually extends valid zones forward for as long as they remain unmitigated.
⚪ Bull/Bear Volume Power Visualization
Each OB includes proportional bars representing estimated buy/sell effort:
Buy Power: % of volume attributed to buyers
Sell Power: % of volume attributed to sellers
This adds a visual, intuitive layer of intent — showing who controlled the price before the OB formed.
⚪ Order Block Trendline (Butterworth Filtered)
A smoothed trendline is derived from the average OB value over time using a two-pole Butterworth low-pass filter. This helps you understand the broader directional pressure:
Trendline up → favor bullish OBs
Trendline down → favor bearish OBs
█ How to Use
⚪ Trade From Order Blocks Like Institutions
Use this tool to find institutional footprints and reaction zones:
Enter at unmitigated OBs
⚪ Volume Power
Volume Pressure Bars inside each OB help you:
Confirm strong buyer/seller dominance
Detect possible traps or exhaustion
Understand how each zone formed
⚪ Find Trend & Pullbacks
The trendline not only helps traders detect the current trend direction, but the built-in trend coloring also highlights potential pullback areas within these trends.
█ Settings
Timeframe – Selects which timeframe to scan for Order Blocks.
Lookback Period – Defines how many bars back are used to detect bullish or bearish momentum shifts.
Sensitivity – When enabled, the indicator uses smoothed price (RMA) with rising/falling logic instead of raw candle closes. This allows more flexible detection of trend shifts and results in more Order Blocks being identified.
Minimum Percent Move – Filters out weak moves. Higher = only strong price shifts.
Mitigated on Mid – OB is removed when price touches its midpoint.
Show OB Table – Displays a panel listing all active (unmitigated) Order Blocks.
Extend Boxes – Controls how far OB boxes stretch into the future.
Show OB Trend – Toggles the trendline derived from Order Block strength.
Passband Ripple (dB) – Controls trendline reactivity. Higher = more sensitive.
Cutoff Frequency – Controls smoothness of trendline (0–0.5). Lower = smoother.
-----------------
Disclaimer
The content provided in my scripts, indicators, ideas, algorithms, and systems is for educational and informational purposes only. It does not constitute financial advice, investment recommendations, or a solicitation to buy or sell any financial instruments. I will not accept liability for any loss or damage, including without limitation any loss of profit, which may arise directly or indirectly from the use of or reliance on such information.
All investments involve risk, and the past performance of a security, industry, sector, market, financial product, trading strategy, backtest, or individual's trading does not guarantee future results or returns. Investors are fully responsible for any investment decisions they make. Such decisions should be based solely on an evaluation of their financial circumstances, investment objectives, risk tolerance, and liquidity needs.

Order Blocks [TakingProphets]The Order Blocks indicator automatically finds and highlights institutional Order Blocks (OBs) on your chart — powerful price zones where smart money has previously entered the market with large orders. These areas often act as strong support or resistance, and they’re key tools for traders using ICT (Inner Circle Trader) and Smart Money Concepts (SMC) strategies.
📘 What’s an Order Block?
An Order Block is usually the last bullish or bearish candle before a big move or shift in market structure. It represents where banks, funds, or institutions placed large buy or sell orders. Retail traders often miss these zones, but smart money traders use them to anticipate where price may return, stall, or even reverse.
This indicator identifies these zones for you — both bullish and bearish — so you don’t have to manually mark them.
🔍 How the Indicator Works
It waits for a market structure shift — when price breaks out of a recent high or low range.
Then it looks back to find the last opposite candle before that breakout — that candle becomes the OB.
It draws a box from the open of that candle to the high/low (depending on type) and keeps updating the box forward.
You can choose how strict the OBs need to be (Small, Medium, or Large) using ATR-based size filtering.
🔄 Breaker Blocks (Optional Feature)
If price closes through an Order Block in the opposite direction, that OB is considered invalid. But instead of deleting it, the indicator can automatically draw a Breaker Block. Breakers are important because they often become new support or resistance zones — a sign the market has flipped direction and is now respecting that level in a new way.
🎛 Custom Settings
Choose OB detection sensitivity: High (shows smaller moves), Medium, or Low (only the biggest institutional moves).
Customize colors and whether you want to show borders on each block.
Turn Breaker Blocks on or off based on your strategy.
Everything is dynamic and updates live as price evolves.
💡 Why Use It?
Knowing where smart money entered the market gives you a huge edge. Price often returns to these Order Blocks to "rebalance" or fill unfilled orders. With this indicator, you’ll:
Spend less time marking charts.
Spot high-probability entry zones faster.
Avoid common retail traps and trade with the algorithm.
