I4I Inside Vortex Strike RateThis indicator identifies what I call an "Inside Vortex": It's similar to a Doji but more strict in having to be inside a keltner and also have a lower ATR than a blended average.
The bar itself is not that special. But it indicates that a potential big move might come in the next 2 periods.
After the patter: It then looks at what I call the Market Maker High and Low: A % of a blended ATR. It then looks back 100-200 or more bars and calculates the overall strike % in history for the High and low after the pattern happens.
This allows us to know how often these levels are hit within the next 2 periods to find if we have any edge on spread, call or put prices or use them as targets.
So its:
Pattern:
Levels
Strike Rate.
Very unique and EXTREME useful. Especially for options traders.
Option

Day Trading Astra by Pooja📌 Day Trading Astra by Pooja
Day Trading Astra by Pooja is specily designed for F&O Traders, a clean and fast momentum-shift indicator designed to support day traders with clear entry signals and structured filtering.
It uses a refined RSI–MA crossover engine, allowing traders to visualize momentum transitions directly on the price chart with minimal clutter.
✨ Key Features
🔶 1. RSI–MA Crossover Engine
Identifies potential momentum shifts using a fast RSI and smoothed RSI-MA baseline.
🔶 2. Clean BUY/SELL Chart Signals
Markers appear directly on the candle chart—easy to read, no extra panes.
🔶 3. Smart Filtering System (Optional)
To help reduce low-quality signals in uncertain conditions:
ADX trend-strength filter
ATR volatility check
Slope validation
Minimum bars between two signals
🔶 4. Alert + Webhook Ready
Supports TradingView alerts and webhook integration for automation tools.
Each alert includes symbol, direction, price, timestamp, unique ID, and an optional secret key for secure execution.
🔶 5. Multi-Timeframe Flexible
Works across all timeframes; users can apply it according to their day-trading style.
📝 How to Use
Add indicator to chart.
Select your preferred filters or use default settings.
Enable alerts if automated notifications are needed.
Combine with your own risk management and trading framework.
This tool is meant to support analysis, not replace personal judgment.
⚠️ Disclaimer
This script is a technical analysis tool and not financial advice.
Results vary depending on market conditions and user settings.
No indicator can guarantee profits or eliminate risk.
Always test settings before applying them in live markets.
The user is fully responsible for all trading decisions.
⭐ Summary
A clean, fast, and structured momentum-entry tool designed to help day traders identify potential intraday shifts with clarity and alert support.

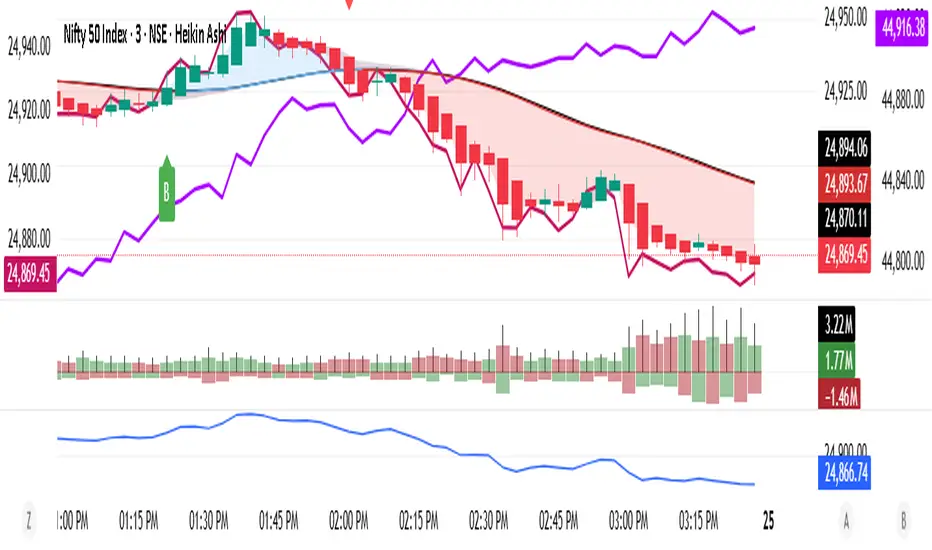
ATM Pulse (Arjo)ATM Pulse (Arjo) — Real-Time ATM Options Sentiment & Trend Strength Indicator
Overview
ATM Pulse (Arjo) is an options analytics and trend overlay tool that automatically detects the At-The-Money (ATM) strike for NIFTY, BANKNIFTY , or any selected stock.
It merges Call–Put Volume Ratio (CPVR) sentiment analysis with a Chandelier Exit trend overlay to help traders visualize both market bias and trend direction in a single chart.
Concepts & Logic
ATM Auto Detection
The script calculates the current ATM strike by rounding the underlying’s price to the nearest strike interval (e.g., 50 for NIFTY, 100 for BANKNIFTY). It then requests live option-chain data for that strike.
Call–Put Volume Ratio (CPVR)
The Call-Put Volume Ratio (CPVR) is calculated as the call volume divided by the put volume.
CPVR > 1.25 → Bullish dominance (Calls stronger)
CPVR < 0.75 → Bearish dominance (Puts stronger)
0.75–1.25 → Neutral sentiment
This ratio helps interpret real-time option-market positioning.
Chandelier Exit Trend Overlay
Using Average True Range (ATR) , the overlay plots dynamic trailing stops and visual trend zones:
🟢 Green: Uptrend continuation zone
🔴 Red: Downtrend continuation zone
A color change signals possible momentum reversal.
Combination of CPVR and Chandelier Exit
CPVR gauges option-market sentiment
Chandelier Exit confirms price-action direction
When both align (e.g., bullish CPVR + green Chandelier zone), it strengthens directional conviction. Divergent readings may signal indecision or early reversals.
How to Use
Open any NIFTY, BANKNIFTY , or stocks chart.
Add ATM Pulse (Arjo) to the chart.
Select your expiry date — the script auto-detects the ATM strike and displays:
C: Call LTP
P: Put LTP
CPVR: Call/Put Volume Ratio label
Watch the Chandelier Exit colors:
🟢 Green = Bullish trend
🔴 Red = Bearish trend
Combine CPVR bias + trend color for confirmation.
If CPVR is above 1.25 and trend color green → More bullish activity (Calls stronger).
If CPVR is below 0.75, and trend color red→ More bearish activity (Puts stronger).
If CPVR is between 0.75 and 1.25 and the trend color is gray/mixed → Neutral
Practical Use Case
The script continuously updates the ATM strike, CPVR , and trend overlay in real time.
It provides a clear visual snapshot of how option volumes align with price momentum , ideal for intraday or short-term directional traders.
Disclaimer
This tool is for educational and analytical purposes only.
It does not provide financial advice or guaranteed trading signals.
Happy Trading. ARJO

Binary Options Fast Scalping [TradingFinder] M1 & M5 Signals🔵 Introduction
In the structure of financial markets, spiky moments and sudden price movements play a key role in Liquidity Grabs and Market Structure Resets. These movements usually occur after the accumulation of orders in Buy Side or Sell Side Liquidity zones and are accompanied by rapid breaks in the form of Break of Structure (BoS) or Change of Character (CHoCH).
At this stage, the market temporarily moves in the direction of liquidity to trigger counter orders and then enters a Retracement or Pullback phase, a point where professional traders using the Smart Money Concept (SMC) look for candle confirmation to enter with precision.
This strategy is built upon the same logic : an initial spiky move as a signal of institutional or liquidity driven algorithms, followed by a controlled pullback toward areas such as the Order Block, Fair Value Gap (FVG), or Imbalance Zone, and finally an entry based on a strong confirmation candle (Engulf, Rejection, Breaker) that defines the true direction of order flow.
This combination of price behavior, especially on lower timeframes such as M1 or M5, provides an ideal setup for fast Scalping, Micro Structure Trading, and even short term directional prediction in Binary Options Trading.
Since the main focus of this method is on identifying liquidity phases, structural confirmations, and momentum confirmation candles, the trader can design entries with high probability and logical stop loss placement using the concepts of Fractal Market Structure and Multi Timeframe Confirmation.
In the scalping version, the main objective is to capture the move toward the next liquidity pool or opposite demand and supply zone, while in the binary version, only the prediction of the next candle’s direction matters. This strategy inherently operates based on Smart Money Behavior, Liquidity Engineering, and Order Flow Dynamics, allowing the extraction of fast and profitable moves from the internal logic of market structure.
🔵 How to Use
The operational logic of this strategy is based on Liquidity Sweep, Pullback, and Confirmation Candle. The trader should first identify the initial Impulse Move, which is often accompanied by liquidity absorption around Buy Side or Sell Side Liquidity areas. After that, the market enters the Retracement phase and returns to structural zones such as the Order Block or the Fair Value Gap (FVG).
At this point, a position is taken only when a confirmation candle (Engulf, Breaker, or Rejection Candle) closes in the direction of continuation and aligns with the new structure (BOS or CHoCH). Applying this model on lower timeframes offers the highest precision for fast Scalping or for predicting the next candle’s direction in Binary Option trading.
🟣 Bullish Setup
In the bullish setup, the market first forms a spiky upward move with a sudden increase in momentum, indicating the activation of liquidity flow in the Buy Side Liquidity zone. This movement is usually accompanied by a Break of Structure (BOS) to the upside and marks the beginning of the Impulse Move phase. After this move, the price enters the Pullback phase and returns to structural areas such as the Bullish Order Block, Fair Value Gap (FVG), or Mitigation zone.
At this stage, the trader waits for a bullish confirmation candle (Bullish Engulf or Breaker Candle) to validate the end of the retracement. Entry is made at the close of the confirmation candle or on a minor pullback, with the stop loss placed below the Swing Low or below the pullback zone. The target is set at the next Buy Side Liquidity or Equal Highs. In the binary version, only the direction of the next candle matters and the entry takes place immediately after the confirmation candle.
🟣 Bearish Setup
In the bearish setup, the market first forms a spiky downward move, signaling increased selling pressure and liquidity absorption at the Sell Side Liquidity zone. This movement is accompanied by a Break of Structure (BOS) to the downside and represents the beginning of a bearish momentum phase. After the spike, the price enters the Retracement phase and returns to the Bearish Order Block or bearish Fair Value Gap zone. Within these areas, the formation of a bearish confirmation candle (Bearish Engulf, Breaker, or Rejection Candle) validates the continuation of the downtrend.
The entry is taken at the close of the confirmation candle, with the stop loss placed above the Swing High or above the pullback zone, and the target set toward the next Sell Side Liquidity or Equal Lows. In binary applications, only the direction of the next candle is considered and the confirmation candle serves as the entry trigger.
🔵 Conclusion
This strategy, by combining the principles of the Smart Money Concept, Liquidity Dynamics, and Candle Confirmation Logic, offers a precise and multi functional approach to market entry. Its core structure, identifying the initial spiky movement, waiting for a structural pullback, and entering based on a confirmation candle allows quick interpretation of institutional liquidity behavior and provides trading opportunities with high accuracy and controlled risk.
On lower timeframes, this logic becomes a powerful tool for Scalping and Micro Structure Trading, while in binary markets it delivers high success rates due to its focus on predicting the next candle’s direction. Built upon the foundations of Order Flow, Market Structure, and Fractal Liquidity Behavior, this strategy demonstrates that even in the fastest and noisiest market conditions, the order of Smart Money remains observable and exploitable.

Multi Straddle-Strangle ChartThis powerful indicator is designed for options traders who want to visualize and track the combined premium of multiple straddle and strangle strategies in a single, dedicated pane.
Quickly analyze and compare up to five different options strategies at a glance, directly on your chart. This tool is perfect for monitoring volatility, tracking potential profits/losses on a position, and spotting key support and resistance levels based on option premiums.
Key Features:
Plot Up to 5 Strategies: Simultaneously plot any combination of up to 5 straddles or strangles.
Real-Time Data: Fetches live data for both Call and Put options to give you an up-to-the-second view of the combined price.
Dynamic Symbol Generation: Automatically detects the underlying symbol (e.g., NIFTY, BANKNIFTY, stocks) and builds the correct option symbols based on your input.
Customizable Inputs: Easily configure the expiry date, strike prices and line colors for each of the 5 lines.
In-Chart Summary Table: A clean and clear table in the corner of your chart provides a quick summary of each enabled strategy and its current price.
Important Note on Usage:
This tool requires you to input a strike price in all fields, even if you do not plan to use all five lines. This is necessary because of a fundamental rule in the Pine Script language: every input must have a constant, non-empty default value. The indicator is optimized to only fetch data for the lines you have explicitly enabled with the "Enable Line X" checkbox.

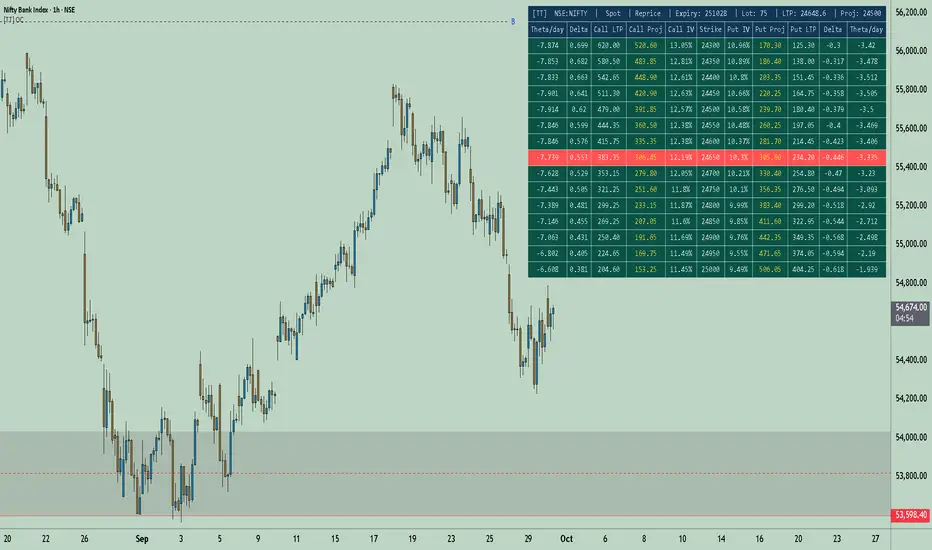
[TT] Option Chain✅Option Geeks for NSE India
Option Geeks is a powerful tool designed for options traders on the NSE (National Stock Exchange of India). It provides real-time visualization and insights based on key option greeks such as Delta, Gamma, Theta, and Implied Volatility (IV) — enabling traders to make more informed decisions when analyzing option chains and positions.
✅What This Script Does:
Calculates and displays the main option greeks for both Call and Put options.
Highlights sensitivity of option prices to changes in:
Underlying price (Delta, Gamma)
Time decay (Theta)
Implied Volatility Calculation.
Tracks live changes in IV and allows comparison across strikes and expiries.
Helps identify favorable option setups and hedging opportunities.
Designed for Bank Nifty, Nifty 50, and top NSE FnO stocks.
✅ How It Works (Conceptually):
Uses a simplified Black-Scholes model adapted for Indian markets.
Takes into account underlying price, strike, days to expiry, interest rate, and volatility to compute the Greeks. Plots real-time values on chart
Manually You need to input the ATM Strike and nearest expiry to update Greeks accordingly.
✅ Who Should Use It:
Options traders seeking deeper insight beyond price charts.
Scalpers and positional traders looking to understand how their trades react to time, price, and volatility.
Anyone trading on NSE’s F&O segment who wants to make smarter trades based on calculated risk metrics
F&O Time Zones – Final Fixed📌 This indicator highlights high-probability intraday time zones used in Indian F&O (Futures & Options) strategies. Ideal for scalping, breakout setups, and trap avoidance.
🕒 Covered Time Zones:
• 9:15 – 9:21 AM → Flash Trades (first 1-minute volatility)
• 9:21 – 9:30 AM → Smart Money Trap (VWAP fakeouts)
• 9:30 – 9:50 AM → Fake Breakout Zone
• 9:50 – 10:15 AM → Institutional Entry Timing
• 10:15 – 10:45 AM → VWAP Range Scalps
• 10:45 – 11:15 AM → Second Trap Zone
• 11:15 – 1:00 PM → Trend Continuation Window
• 1:00 – 1:45 PM → Volatility Compression
• 1:45 – 2:15 PM → Institutional Exit Phase 1
• 2:15 – 2:45 PM → Trend Acceleration / Reversals
• 2:45 – 3:15 PM → Expiry Scalping Zone
• 3:15 – 3:30 PM → Dead Zone (square-off time)
🔧 Features:
✓ Clean vertical lines per zone
✓ Optional label positions (top or bottom)
✓ Adjustable line style, width, and color
🧠 Best used on: NIFTY, BANKNIFTY, FINNIFTY (5-min or lower)
---
🔒 **Disclaimer**:
This script is for **educational purposes only**. It is not financial advice. Trading involves risk. Please consult a professional or do your own research before taking any positions.
—
👤 Script by: **JoanJagan**
🛠️ Built in Pine Script v5

Option Value/Time Value DifferenceThis indicator calculates and visualizes the difference between two option contracts (either their time value or option value) based on a user-selected underlying instrument (e.g., NIFTY 50). It fetches real-time data for the underlying and the two specified options, computes their intrinsic and time values, and plots either the time value or option value (ask price) along with their difference. A customizable table displays key details, including strike prices, option types (Call/Put), and the selected values, with a dark mode option for better visibility.
Key Features:
Flexible Plotting: Choose to plot and display either the Time Value (option price minus intrinsic value) or the Option Value (ask price) for two option strikes.
Difference Calculation: Plots the difference between the two options’ selected values (time value or option value) as a distinct line.
Dynamic Table: Shows strike prices, option types (CE/PE), and the selected values (time value or option value) for both options, plus their difference.
Dark Mode Support: Toggle between light and dark themes for the table display.
Real-Time Data: Uses TradingView’s request.security to fetch live prices for the underlying and options.
Use Case:
This script is ideal for options traders who want to compare two strikes (e.g., a Call and a Put, or two Calls/Puts at different strikes) and analyze their time value or option value differences in real-time. It’s particularly useful for strategies like spreads, straddles, or strangles.
How to Use
Add to Chart:
Open TradingView, go to the Pine Editor, paste this script, and click “Add to Chart.”
Configure Inputs:
Underlying Instrument: Enter the symbol of the underlying asset (e.g., NSE:NIFTY for NIFTY 50).
Option Instrument 1: Enter the symbol of the first option (e.g., NSE:NIFTY250327C24000 for a Call expiring March 27, 2025, at strike 24000).
Option Instrument 2: Enter the symbol of the second option (e.g., NSE:NIFTY250327C24500 for a Call at strike 24500).
Plot Type: Select either Time Value (default) or Option Value to determine what is plotted and displayed.
Dark Mode: Check this box to switch the table to a dark theme (default is light).
Interpret Outputs:
Chart Lines:
Blue Line: Value of the first option (time value or option value, based on selection).
Red Line: Value of the second option.
Purple Line: Difference between the two options’ values.
Table (Middle-Left Position):
Row 1: Strike price and type (CE/PE) of the first option.
Row 2: Strike price and type of the second option.
Row 3: Selected value (time value or option value) of the first option.
Row 4: Selected value of the second option.
Row 5: Difference between the two options’ values.
Adjust Settings:
Modify the input symbols or plot type via the indicator’s settings to suit your analysis needs.
Inputs
Underlying Instrument (Symbol, Default: NSE:NIFTY):
The ticker symbol of the underlying asset (e.g., NIFTY 50 index).
Option Instrument 1 (Symbol, Default: NSE:NIFTY250327C24000):
The ticker symbol of the first option contract. Must follow a format like NSE:NIFTY (e.g., Call at 24000).
Option Instrument 2 (Symbol, Default: NSE:NIFTY250327C24500):
The ticker symbol of the second option contract (e.g., Call at 24500).
Plot Type (String, Options: Time Value, Option Value, Default: Time Value):
Choose whether to plot and display the Time Value (option price minus intrinsic value) or the Option Value (ask price).
Dark Mode (Boolean, Default: false):
Enable for a dark-themed table; disable for a light theme.
Outputs
Plotted Lines:
Value 1 (Blue): Time value or option value of the first option, depending on the Plot Type.
Value 2 (Red): Time value or option value of the second option.
Difference (Purple): The difference between Value 1 and Value 2 (e.g., Time Value 1 - Time Value 2).
Table Display:
Strike prices and option types (Call/Put) for both options.
Selected values (time value or option value) for each option.
The difference between the two options’ selected values.

Options Oscillator [Lite] IVRank, IVx, Call/Put Volatility Skew The first TradingView indicator that provides REAL IVRank, IVx, and CALL/PUT skew data based on REAL option chain for 5 U.S. market symbols.
🔃 Auto-Updating Option Metrics without refresh!
🍒 Developed and maintained by option traders for option traders.
📈 Specifically designed for TradingView users who trade options.
🔶 Ticker Information:
This 'Lite' indicator is currently only available for 5 liquid U.S. market smbols : NASDAQ:TSLA AMEX:DIA NASDAQ:AAPL NASDAQ:AMZN and NYSE:ORCL
🔶 How does the indicator work and why is it unique?
This Pine Script indicator is a complex tool designed to provide various option metrics and visualization tools for options market traders. The indicator extracts raw options data from an external data provider (ORATS), processes and refines the delayed data package using pineseed, and sends it to TradingView, visualizing the data using specific formulas (see detailed below) or interpolated values (e.g., delta distances). This method of incorporating options data into a visualization framework is unique and entirely innovative on TradingView.
The indicator aims to offer a comprehensive view of the current state of options for the implemented instruments, including implied volatility (IV), IV rank (IVR), options skew, and expected market movements, which are objectively measured as detailed below.
The options metrics we display may be familiar to options traders from various major brokerage platforms such as TastyTrade, IBKR, TOS, Tradier, TD Ameritrade, Schwab, etc.
🟨 The following data is displayed in the oscillator 🟨
We use Tastytrade formulas, so our numbers mostly align with theirs!
🔶 𝗜𝗩𝗥𝗮𝗻𝗸
The Implied Volatility Rank (IVR) helps options traders assess the current level of implied volatility (IV) in comparison to the past 52 weeks. IVR is a useful metric to determine whether options are relatively cheap or expensive. This can guide traders on whether to buy or sell options.
IV Rank formula = (current IV - 52 week IV low) / (52 week IV high - 52 week IV low)
IVRank is default blue and you can adjust their settings:
🔶 𝗜𝗩𝘅 𝗮𝘃𝗴
The implied volatility (IVx) shown in the option chain is calculated like the VIX. The Cboe uses standard and weekly SPX options to measure expected S&P 500 volatility. A similar method is used for calculating IVx for each expiration cycle.
We aggregate the IVx values for the 35-70 day monthly expiration cycle, and use that value in the oscillator and info panel.
We always display which expiration the IVx values are averaged for when you hover over the IVx cell.
IVx main color is purple, but you can change the settings:
🔹IVx 5 days change %
We are also displaying the five-day change of the IV Index (IVx value). The IV Index 5-Day Change column provides quick insight into recent expansions or decreases in implied volatility over the last five trading days.
Traders who expect the value of options to decrease might view a decrease in IVX as a positive signal. Strategies such as Strangle and Ratio Spread can benefit from this decrease.
On the other hand, traders anticipating further increases in IVX will focus on the rising IVX values. Strategies like Calendar Spread or Diagonal Spread can take advantage of increasing implied volatility.
This indicator helps traders quickly assess changes in implied volatility, enabling them to make informed decisions based on their trading strategies and market expectations.
Important Note:
The IVx value alone does not provide sufficient context. There are stocks that inherently exhibit high IVx values. Therefore, it is crucial to consider IVx in conjunction with the Implied Volatility Rank (IVR), which measures the IVx relative to its own historical values. This combined view helps in accurately assessing the significance of the IVx in relation to the specific stock's typical volatility behavior.
This indicator offers traders a comprehensive view of implied volatility, assisting them in making informed decisions by highlighting both the absolute and relative volatility measures.
🔶 𝗖𝗔𝗟𝗟/𝗣𝗨𝗧 𝗣𝗿𝗶𝗰𝗶𝗻𝗴 𝗦𝗸𝗲𝘄 𝗵𝗶𝘀𝘁𝗼𝗴𝗿𝗮𝗺
At TanukiTrade, Vertical Pricing Skew refers to the difference in pricing between put and call options with the same expiration date at the same distance (at tastytrade binary expected move). We analyze this skew to understand market sentiment. This is the same formula used by TastyTrade for calculations.
We calculate the interpolated strike price based on the expected move, taking into account the neighboring option prices and their distances. This allows us to accurately determine whether the CALL or PUT options are more expensive.
🔹 What Causes Pricing Skew? The Theory Behind It
The asymmetric pricing of PUT and CALL options is driven by the natural dynamics of the market. The theory is that when CALL options are more expensive than PUT options at the same distance from the current spot price, market participants are buying CALLs and selling PUTs, expecting a faster upward movement compared to a downward one .
In the case of PUT skew, it's the opposite: participants are buying PUTs and selling CALLs , as they expect a potential downward move to happen more quickly than an upward one.
An options trader can take advantage of this phenomenon by leveraging PUT pricing skew. For example, if they have a bullish outlook and both IVR and IVx are high and IV started decreasing, they can capitalize on this PUT skew with strategies like a jade lizard, broken wing butterfly, or short put.
🔴 PUT Skew 🔴
Put options are more expensive than call options, indicating the market expects a faster downward move (▽). This alone doesn't indicate which way the market will move (because nobody knows that), but the options chain pricing suggests that if the market moves downward, it could do so faster in velocity compared to a potential upward movement.
🔹 SPY PUT SKEW example:
If AMEX:SPY PUT option prices are 46% higher than CALLs at the same distance for the optimal next monthly expiry (DTE). This alone doesn't indicate which way the market will move (because nobody knows that), but the options chain pricing suggests that if the market moves downward, it could do so 46% faster in velocity compared to a potential upward movement
🟢 CALL Skew 🟢
Call options are more expensive than put options, indicating the market expects a faster upward move (△). This alone doesn't indicate which way the market will move (because nobody knows that), but the options chain pricing suggests that if the market moves upward, it could do so faster in velocity compared to a potential downward movement.
🔹 INTC CALL SKEW example:
If NASDAQ:INTC CALL option prices are 49% higher than PUTs at the same distance for the optimal next monthly expiry (DTE). This alone doesn't indicate which way the market will move (because nobody knows that), but the options chain pricing suggests that if the market moves upward, it could do so 49% faster in velocity compared to a potential downward movement .
🔶 USAGE example:
The script is compatible with our other options indicators.
For example: Since the main metrics are already available in this Options Oscillator, you can hide the main IVR panel of our Options Overlay indicator, freeing up more space on the chart. The following image shows this:
🔶 ADDITIONAL IMPORTANT COMMENTS
🔹 Historical Data:
Yes, we only using historical internal metrics dating back to 2024-07-01, when the TanukiTrade options brand launched. For now, we're using these, but we may expand the historical data in the future.
🔹 What distance does the indicator use to measure the call/put pricing skew?:
It is important to highlight that this oscillator displays the call/put pricing skew changes for the next optimal monthly expiration on a histogram.
The Binary Expected Move distance is calculated using the TastyTrade method for the next optimal monthly expiration: Formula = (ATM straddle price x 0.6) + (1st OTM strangle price x 0.3) + (2nd OTM strangle price x 0.1)
We interpolate the exact difference based on the neighboring strikes at the binary expected move distance using the TastyTrade method, and compare the interpolated call and put prices at this specific point.
🔹 - Why is there a slight difference between the displayed data and my live brokerage data?
There are two reasons for this, and one is beyond our control.
◎ Option-data update frequency:
According to TradingView's regulations and guidelines, we can update external data a maximum of 5 times per day. We strive to use these updates in the most optimal way:
(1st update) 15 minutes after U.S. market open
(2nd, 3rd, 4th updates) 1.5–3 hours during U.S. market open hours
(5th update) 10 minutes before U.S. market close.
You don’t need to refresh your window, our last refreshed data-pack is always automatically applied to your indicator, and you can see the time elapsed since the last update at the bottom of the corner on daily TF.
◎ Brokerage Calculation Differences:
Every brokerage has slight differences in how they calculate metrics like IV and IVx. If you open three windows for TOS, TastyTrade, and IBKR side by side, you will notice that the values are minimally different. We had to choose a standard, so we use the formulas and mathematical models described by TastyTrade when analyzing the options chain and drawing conclusions.
🔹 - EOD data:
The indicator always displays end-of-day (EOD) data for IVR, IV, and CALL/PUT pricing skew. During trading hours, it shows the current values for the ongoing day with each update, and at market close, these values become final. From that point on, the data is considered EOD, provided the day confirms as a closed daily candle.
🔹 - U.S. market only:
Since we only deal with liquid option chains: this option indicator only works for the USA options market and do not include future contracts; we have implemented each selected symbol individually.
Disclaimer:
Our option indicator uses approximately 15min-3 hour delayed option market snapshot data to calculate the main option metrics. Exact realtime option contract prices are never displayed; only derived metrics and interpolated delta are shown to ensure accurate and consistent visualization. Due to the above, this indicator can only be used for decision support; exclusive decisions cannot be made based on this indicator. We reserve the right to make errors.This indicator is designed for options traders who understand what they are doing. It assumes that they are familiar with options and can make well-informed, independent decisions. We work with public data and are not a data provider; therefore, we do not bear any financial or other liability.
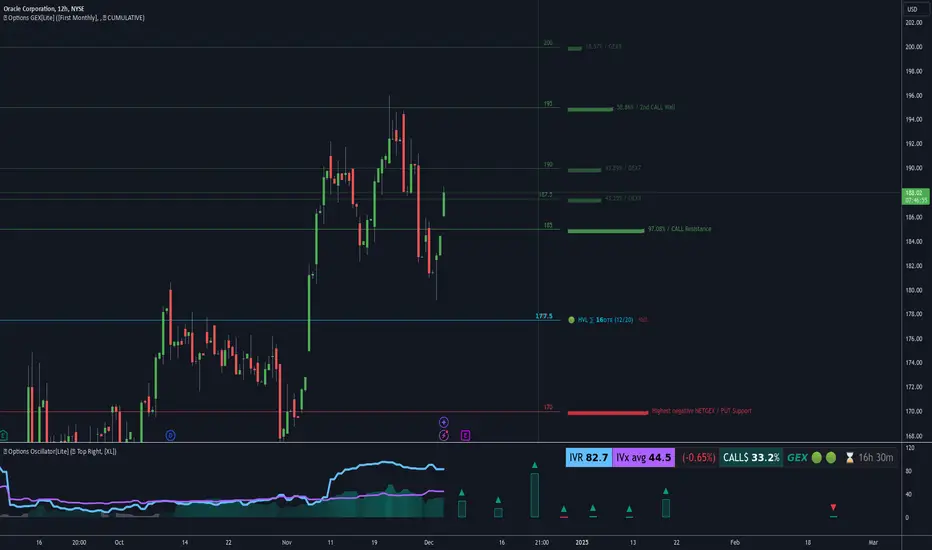
Options Overlay [Pro] IVR IV Skew Delta Exp.mv MurreyMath Expiry
𝗧𝗵𝗲 𝗳𝗶𝗿𝘀𝘁 𝗿𝗲𝗮𝗹 𝗼𝗽𝘁𝗶𝗼𝗻𝘀 𝗱𝗮𝘁𝗮 𝗶𝗻𝗱𝗶𝗰𝗮𝘁𝗼𝗿 𝗼𝗻 𝗧𝗿𝗮𝗱𝗶𝗻𝗴𝗩𝗶𝗲𝘄, 𝗮𝘃𝗮𝗶𝗹𝗮𝗯𝗹𝗲 𝗳𝗼𝗿 𝗼𝘃𝗲𝗿 𝟭𝟱𝟬+ 𝗹𝗶𝗾𝘂𝗶𝗱 𝗨𝗦 𝗺𝗮𝗿𝗸𝗲𝘁 𝘀𝘆𝗺𝗯𝗼𝗹𝘀.
🔃 Auto-Updating Option Metrics without refresh!
🍒 Developed and maintained by option traders for option traders.
📈 Specifically designed for TradingView users who trade options.
Our indicator provides essential key metrics such as:
✅ IVRank
✅ IVx
✅ 5-Day IVx Change
✅ Delta curves and interpolated distances
✅ Expected move curve
✅ Standard deviation (STD1) curve
✅ Vertical Pricing Skew
✅ Horizontal IVx Skew
✅ Delta Skew
like TastyTrade, TOS, IBKR etc, but in a much more visually intuitive way. See detailed descriptions below.
If this isn't enough, we also include a unique grid system designed specifically for options traders. This package features our innovative dynamic grid system:
✅ Enhanced Murrey Math levels (horizontal scale)
✅ Options expirations (vertical scale)
Designed to help you assess market conditions and make well-informed trading decisions, this tool is an essential addition for every serious options trader!
Ticker Information:
This indicator is currently implemented for more than 150 liquid US market tickers and we are continuously expanding the list:
SP:SPX AMEX:SPY NASDAQ:QQQ NASDAQ:TLT AMEX:GLD
NYSE:AA NASDAQ:AAL NASDAQ:AAPL NYSE:ABBV NASDAQ:ABNB NASDAQ:AMD NASDAQ:AMZN AMEX:ARKK NASDAQ:AVGO NYSE:AXP NYSE:BA NYSE:BABA NYSE:BAC NASDAQ:BIDU AMEX:BITO NYSE:BMY NYSE:BP NASDAQ:BYND NYSE:C NYSE:CAT NYSE:CCJ NYSE:CCL NASDAQ:COIN NYSE:COP NASDAQ:COST NYSE:CRM NASDAQ:CRWD NASDAQ:CSCO NYSE:CVNA NYSE:CVS NYSE:CVX NYSE:DAL NASDAQ:DBX AMEX:DIA NYSE:DIS NASDAQ:DKNG NASDAQ:EBAY NASDAQ:ETSY NASDAQ:EXPE NYSE:F NYSE:FCX NYSE:FDX AMEX:FXI AMEX:GDX AMEX:GDXJ NYSE:GE NYSE:GM NYSE:GME NYSE:GOLD NASDAQ:GOOG NASDAQ:GOOGL NYSE:GPS NYSE:GS NASDAQ:HOOD NYSE:IBM NASDAQ:IEF NASDAQ:INTC AMEX:IWM NASDAQ:JD NYSE:JNJ NYSE:JPM NYSE:JWN NYSE:KO NYSE:LLY NYSE:LOW NYSE:LVS NYSE:MA NASDAQ:MARA NYSE:MCD NYSE:MET NASDAQ:META NYSE:MGM NYSE:MMM NYSE:MPC NYSE:MRK NASDAQ:MRNA NYSE:MRO NASDAQ:MRVL NYSE:MS NASDAQ:MSFT AMEX:MSOS NYSE:NCLH NASDAQ:NDX NYSE:NET NASDAQ:NFLX NYSE:NIO NYSE:NKE NASDAQ:NVDA NASDAQ:ON NYSE:ORCL NYSE:OXY NASDAQ:PEP NYSE:PFE NYSE:PINS NYSE:PLTR NASDAQ:PTON NASDAQ:PYPL NASDAQ:QCOM NYSE:RBLX NYSE:RCL NASDAQ:RIOT NASDAQ:RIVN NASDAQ:ROKU NASDAQ:SBUX NYSE:SHOP AMEX:SLV NASDAQ:SMCI NASDAQ:SMH NYSE:SNAP NYSE:SQ NYSE:T NYSE:TGT NASDAQ:TQQQ NASDAQ:TSLA NYSE:TSM NASDAQ:TTD NASDAQ:TXN NYSE:U NASDAQ:UAL NYSE:UBER AMEX:UNG NYSE:UPS NASDAQ:UPST AMEX:USO NYSE:V AMEX:VXX NYSE:VZ NASDAQ:WBA NYSE:WFC NYSE:WMT NASDAQ:WYNN NYSE:X AMEX:XHB AMEX:XLE AMEX:XLF AMEX:XLI AMEX:XLK AMEX:XLP AMEX:XLU AMEX:XLV AMEX:XLY NYSE:XOM NYSE:XPEV CBOE:XSP NASDAQ:ZM
How does the indicator work and why is it unique?
This Pine Script indicator is a complex tool designed to provide various option metrics and visualization tools for options market traders. The indicator extracts raw options data from an external data provider (ORATS), processes and refines the delayed data package using pineseed, and sends it to TradingView, visualizing the data using specific formulas (see detailed below) or interpolated values (e.g., delta distances). This method of incorporating options data into a visualization framework is unique and entirely innovative on TradingView.
The indicator aims to offer a comprehensive view of the current state of options for the implemented instruments, including implied volatility (IV), IV rank (IVR), options skew, and expected market movements, which are objectively measured as detailed below.
The options metrics we display may be familiar to options traders from various major brokerage platforms such as TastyTrade, IBKR, TOS, Tradier, TD Ameritrade, Schwab, etc.
🟨 𝗗𝗘𝗧𝗔𝗜𝗟𝗘𝗗 𝗗𝗢𝗖𝗨𝗠𝗘𝗡𝗧𝗔𝗧𝗜𝗢𝗡 🟨
🔶 Auto-Updating Option Metrics and Curved Lines
🔹 Interpolated DELTA Curves (16,20,25,30,40)
In our indicator, the curve layer settings allow you to choose the delta value for displaying the delta curve: 16, 20, 25, 30, or even 40. The color of the curve can be customized, and you can also hide the delta curve by selecting the "-" option.
It's important to mention that we display interpolated deltas from the actual option chain of the underlying asset using the Black-Scholes model. This ensures that the 16 delta truly reflects the theoretical, but accurate, 16 delta distance. (For example, deltas shown by brokerages for individual strikes are rounded; a 0.16 delta might actually be 0.1625.)
🔹 Expected Move Curve (Exp.mv)
The expected move is the predicted dollar change in the underlying stock's price by a given option's expiration date, with 68% certainty. It is calculated using the expiration's pricing and implied volatility levels. We chose the TastyTrade method for calculating expected move, as we found it to be the most expressive.
Expected Move Calculation
Expected Move = (ATM straddle price x 0.6) + (1st OTM strangle price x 0.3) + (2nd OTM strangle price x 0.1)
For example , if stock XYZ is trading at 121 and the ATM straddle is 4.40, the 120/122 strangle is 3.46, and the 119/123 strangle is 2.66, the expected move is calculated as follows: 4.40 x 0.60 = 2.64; 3.46 x 0.30 = 1.04; 2.66 x 0.10 = 0.27; Expected move = 2.64 + 1.04 + 0.27 = ±3.9
In this example below, the TastyTrade platform indicates the expected move on the option chain with a brown color, and the exact value is displayed behind the ± symbol for each expiration. By default, we also use brown for this indication, but this can be changed or the curve display can be turned off.
🔹 Standard Deviation Curve (1 STD)
One standard deviation of a stock encompasses approximately 68.2% of outcomes in a distribution of occurrences based on current implied volatility.
We use the expected move formula to calculate the one standard deviation range of a stock. This calculation is based on the days-to-expiration (DTE) of our option contract, the stock price, and the implied volatility of a stock:
Calculation:
Standard Deviation = Closing Price * Implied Volatility * sqrt(Days to Expiration / 365)
According to options literature, there is a 68% probability that the underlying asset will fall within this one standard deviation range at expiration.
If the 1 STD and Exp.mv displays are both enabled, the indicator fills the area between them with a light gray color. This is because both represent probability distributions that appear as a "bell curve" when graphed, making it visually appealing.
Tip and Note:
The 1 STD line might appear jagged at times , which does not indicate a problem with the indicator. This is normal immediately after market open (e.g., during the first data refresh of the day) or if the expirations are illiquid (e.g., weekly expirations). The 1 STD value is calculated based on the aggregated IVx for the expirations, and the aggregated IVx value for weekly expirations updates less frequently due to lower trading volume. In such cases, we recommend enabling the "Only Monthly Expirations" option to smooth out the bell curve.
∑ Quant Observation:
The values of the expected move and the 1st standard deviation (1STD) will not match because they use different calculation methods, even though both are referred to as representing 68% of the underlying asset's movement in options literature. The expected move is based on direct market pricing of ATM options. The 1STD, on the other hand, uses the averaged implied volatility (IVX) for the given expiration to determine its value. Based on our experience, it is better to consider the area between the expected move and the 1STD as the true representation of the original 68% rule.
🔶 IVR Dashboard Panel Rows
🔹 IVR (IV Rank)
The Implied Volatility Rank (IVR) indicator helps options traders assess the current level of implied volatility (IV) in comparison to the past 52 weeks. IVR is a useful metric to determine whether options are relatively cheap or expensive. This can guide traders on whether to buy or sell options. We calculate IVrank, like TastyTrade does.
IVR Calculation:
IV Rank = (current IV - 52 week IV low) / (52 week IV high - 52 week IV low)
IVR Levels and Interpretations:
IVR 0-10 (Green): Very low implied volatility rank. Options might be "cheap," potentially a good time to buy options.
IVR 10-35 (White): Normal implied volatility rank. Options pricing is relatively standard.
IVR 35-50 (Orange): Almost high implied volatility rank.
IVR 50-75 (Red): Definitely high implied volatility rank. Options might be "expensive," potentially a good time to sell options for higher premiums.
IVR above 75 (Highlighted Red): Ultra high implied volatility rank. Indicates very high levels, suggesting a favorable time for selling options.
The panel refreshes automatically if the symbol is implemented. You can hide the panel or change the position and size.
🔹IVx (Implied Volatility Index)
The Implied Volatility Index (IVx) displayed in the option chain is calculated similarly to the VIX. The Cboe uses standard and weekly SPX options to measure the expected volatility of the S&P 500. A similar method is utilized to calculate IVx for each option expiration cycle.
For our purposes on the IVR Panel, we aggregate the IVx values specifically for the 35-70 day monthly expiration cycle . This aggregated value is then presented in the screener and info panel, providing a clear and concise measure of implied volatility over this period.
IVx Color coding:
IVx above 30 is displayed in orange.
IVx above 60 is displayed in red
IVx on curve:
The IVx values for each expiration can be viewed by hovering the mouse over the colored tooltip labels above the Curve.
IVx avg on IVR panel :
If the option is checked in the IVR panel settings, the IVR panel will display the average IVx values up to the optimal expiration.
Important Note:
The IVx value alone does not provide sufficient context. There are stocks that inherently exhibit high IVx values. Therefore, it is crucial to consider IVx in conjunction with the Implied Volatility Rank (IVR), which measures the IVx relative to its own historical values. This combined view helps in accurately assessing the significance of the IVx in relation to the specific stock's typical volatility behavior.
This indicator offers traders a comprehensive view of implied volatility, assisting them in making informed decisions by highlighting both the absolute and relative volatility measures.
🔹IVx 5 days change %
We are displaying the five-day change of the IV Index (IVx value). The IV Index 5-Day Change column provides quick insight into recent expansions or decreases in implied volatility over the last five trading days.
Traders who expect the value of options to decrease might view a decrease in IVX as a positive signal. Strategies such as Strangle and Ratio Spread can benefit from this decrease.
On the other hand, traders anticipating further increases in IVX will focus on the rising IVX values. Strategies like Calendar Spread or Diagonal Spread can take advantage of increasing implied volatility.
This indicator helps traders quickly assess changes in implied volatility, enabling them to make informed decisions based on their trading strategies and market expectations.
🔹 Vertical Pricing Skew
At TanukiTrade, Vertical Pricing Skew refers to the difference in pricing between put and call options with the same expiration date at the same distance (at expected move). We analyze this skew to understand market sentiment. This is the same formula used by TastyTrade for calculations.
We calculate the interpolated strike price based on the expected move , taking into account the neighboring option prices and their distances. This allows us to accurately determine whether the CALL or PUT options are more expensive.
PUT Skew (red): Put options are more expensive than call options, indicating the market expects a downward move (▽). If put options are more expensive by more than 20% at the same expected move distance, we color it lighter red.
CALL Skew (green): Call options are more expensive than put options, indicating the market expects an upward move (△). If call options are priced more than 30% higher at the examined expiration, we color it lighter green.
Vertical Skew on Curve:
The degree of vertical pricing skew for each expiration can be viewed by hovering over the points above the curve. Hover with mouse for more information.
Vertical Skew on IVR panel:
We focus on options with 35-70 days to expiration (DTE) for optimal analysis in case of vertical skew. Hover with mouse for more information.
This approach helps us gauge market expectations accurately, providing insights into potential price movements. Remember, we always evaluate the skew at the expected move using linear interpolation to determine the theoretical pricing of options.
🔹 Delta Skew 🌪️ (Twist)
We have a new metric that examines which monthly expiration indicates a "Delta Skew Twist" where the 16 delta deviates from the monthly STD. This is important because, under normal circumstances, the 16 delta is positioned between the expected move and the standard deviation (STD1) line (see Exp.mv & 1STD exact definitions above). However, if the interpolated 16 delta line exceeds the STD1 line either upwards or downwards, it represents a special case of vertical skew on the option chain.
Normal case : exp.move < delta16 < std1
Delta Skew Twist: exp.move < std1 < delta16
We indicate this with direction-specific colors (red/green) on the delta line. We also color the section of the delta curve affected by the delta skew in this case, even if you choose to display a lower delta, such as 30, instead of 16.
If "Colored Labels with Tooltips" is enabled, we also display a 🌪️ symbol in the tooltip for the expirations affected by Delta Skew.
If you have enabled the display of 'Vertical Pricing Skew' on the IVR Panel, a 🌪️ symbol will also appear next to the value of the vertical skew, and the tooltip will indicate from which expiration Delta Skew is observed.
🔹 Horizontal IVx Skew
In options pricing, it is typically expected that the implied volatility (IVx) increases for options with later expiration dates. This means that options further out in time are generally more expensive. At TanukiTrade, we refer to the phenomenon where this expectation is reversed—when the IVx decreases between two consecutive expirations—as Horizontal Skew or IVx Skew.
Horizontal IVx Skew occurs when: Front Expiry IVx < Back Expiry IVx
This scenario can create opportunities for traders who prefer diagonal or calendar strategies . Based on our experience, we categorize Horizontal Skew into two types:
Weekly Horizontal Skew:
When IVx skew is observed between two consecutive non-monthly expirations, the displayed value is the rounded-up percentage difference. On hover, the approximate location of this skew is also displayed. The precise location can be seen on this indicator.
Monthly Horizontal Skew:
When IVx skew is observed between two consecutive monthly expirations , the displayed value is the rounded-up percentage difference. On hover, the approximate location of this skew is also displayed. The precise location can be seen on our Overlay indicator.
The Monthly Vertical IVx skew is consistently more liquid than the weekly vertical IVx skew. Weekly Horizontal IVx Skew may not carry relevant information for symbols not included in the 'Weeklies & Volume Masters' preset in our Options Screener indicator.
If the options chain follows the normal IVx pattern, no skew value is displayed.
Color codes or tooltip labels above curve:
Gray - No horizontal skew;
Purple - Weekly horizontal skew;
BigBlue - Monthly horizontal skew
The display of monthly and weekly IVx skew can be toggled on or off on the IVR panel. However, if you want to disable the colored tooltips above the curve, this can only be done using the "Colored labels with tooltips" switch.
We indicate this range with colorful information bubbles above the upper STD line.
🔶 The Option Trader’s GRID System: Adaptive MurreyMath + Expiry Lines
At TanukiTrade, we utilize Enhanced MurreyMath and Expiry lines to create a dynamic grid system, unlike the basic built-in vertical grids in TradingView, which provide no insight into specific price levels or option expirations.
These grids are beneficial because they provide a structured layout, making important price levels visible on the chart. The grid automatically resizes as the underlying asset's volatility changes, helping traders identify expected movements for various option expirations.
The Option Trader’s GRID System part of this indicator can be used without limitations for all instruments . There are no type or other restrictions, and it automatically scales to fit every asset. Even if we haven't implemented the option metrics for a particular underlying asset, the GRID system will still function!
🔹 SETUP OF YOUR OPTIONS GRID SYSTEM
You can setup your new grid system in 3 easy steps!
STEP1: Hide default horizontal grid lines in TradingView
Right-click on an empty area of your chart, then select “Settings.” In the Chart settings -> Canvas -> Grid lines section, disable the display of horizontal lines to avoid distraction.
SETUP STEP2: Scaling fix
Right-click on the price scale on the right side, then select "Scale price chart only" to prevent the chart from scaling to the new horizontal lines!
STEP3: Enable Tanuki Options Grid
As a final step, make sure that both the vertical (MurreyMath) and horizontal (Expiry) lines are enabled in the Grid section of our indicator.
You are done, enjoy the new grid system!
🔹 HORIZONTAL: Enhanced MurreyMath Lines
Murrey Math lines are based on the principles observed by William Gann, renowned for his market symmetry forecasts. Gann's techniques, such as Gann Angles, have been adapted by Murrey to make them more accessible to ordinary investors. According to Murrey, markets often correct at specific price levels, and breakouts or returns to these levels can signal good entry points for trades.
At TanukiTrade, we enhance these price levels based on our experience , ensuring a clear display. We acknowledge that while MurreyMath lines aren't infallible predictions, they are useful for identifying likely price movements over a given period (e.g., one month) if the market trend aligns.
Our opinion: MurreyMath lines are not crystal balls (like no other tool). They should be used to identify that if we are trading in the right direction, the price is likely to reach the next unit step within a unit time (e.g. monthly expiration).
One unit step is the distance between Murrey Math lines, such as between the 0/8 and 1/8 lines. This interval helps identify different quadrants and is crucial for recognizing support and resistance levels.
Some option traders use Murrey Math lines to gauge the movement speed of an instrument over a unit time. A quadrant encompasses 4 unit steps.
Key levels, according to TanukiTrade, include:
Of course, the lines can be toggled on or off, and their default color can also be changed.
🔹 VERTICAL: Expiry Lines
The indicator can display monthly and weekly expirations as dashed lines, with customizable colors. Weekly expirations will always appear in a lighter shade compared to monthly expirations.
Monthly Expiry Lines:
You can turn off the lines indicating monthly expirations, or set the direction (past/future/both) and the number of lines to be drawn.
Weekly Expiry Lines:
You can display weekly expirations pointing to the future. You can also turn them off or specify how many weeks ahead the lines should be drawn.
Of course, the lines can be toggled on or off, and their default color can also be changed.
TIP: Hide default vertical grid lines in TradingView
Right-click on an empty area of your chart, then select “Settings.” In the Chart settings -> Canvas -> Grid lines section, disable the display of vertical lines to avoid distraction. Same, like steps above at MurreyMath lines.
🔶 ADDITIONAL IMPORTANT COMMENTS
- U.S. market only:
Since we only deal with liquid option chains: this option indicator only works for the USA options market and do not include future contracts; we have implemented each selected symbol individually.
- Why is there a slight difference between the displayed data and my live brokerage data? There are two reasons for this, and one is beyond our control.
- Brokerage Calculation Differences:
Every brokerage has slight differences in how they calculate metrics like IV and IVx. If you open three windows for TOS, TastyTrade, and IBKR side by side, you will notice that the values are minimally different. We had to choose a standard, so we use the formulas and mathematical models described by TastyTrade when analyzing the options chain and drawing conclusions.
- Option-data update frequency:
According to TradingView's regulations and guidelines, we can update external data a maximum of 5 times per day. We strive to use these updates in the most optimal way:
(1st update) 15 minutes after U.S. market open
(2nd, 3rd, 4th updates) 1.5–3 hours during U.S. market open hours
(5th update) 10 minutes before market close.
You don’t need to refresh your window, our last refreshed data-pack is always automatically applied to your indicator , and you can see the time elapsed since the last update at the bottom of your indicator.
- Skewed Curves:
The delta, expected move, and standard deviation curves also appear relevantly on a daily or intraday timeframe. Data loss is experienced above a daily timeframe: this is a TradingView limitation.
- Weekly illiquid expiries:
Especially for instruments where weekly options are illiquid: the weekly expiration STD1 data is not relevant. In these cases, we recommend checking in the "Display only Monthly labels" checkbox to avoid displaying not relevant weekly options expirations.
-Timeframe Issues:
Our option indicator visualizes relevant data on a daily resolution. If you see strange or incorrect data (e.g., when the options data was last updated), always switch to a daily (1D) timeframe. If you still see strange data, please contact us.
Disclaimer:
Our option indicator uses approximately 15min-3 hour delayed option market snapshot data to calculate the main option metrics. Exact realtime option contract prices are never displayed; only derived metrics and interpolated delta are shown to ensure accurate and consistent visualization. Due to the above, this indicator can only be used for decision support; exclusive decisions cannot be made based on this indicator . We reserve the right to make errors.This indicator is designed for options traders who understand what they are doing. It assumes that they are familiar with options and can make well-informed, independent decisions. We work with public data and are not a data provider; therefore, we do not bear any financial or other liability.

Options Screener [Pro] - IVRank, IVx, Deltas, Exp.move, Skew
𝗢𝗽𝘁𝗶𝗼𝗻 𝘀𝗰𝗿𝗲𝗲𝗻𝗲𝗿 𝗼𝗻 𝗧𝗿𝗮𝗱𝗶𝗻𝗴𝗩𝗶𝗲𝘄 𝘄𝗶𝘁𝗵 𝗿𝗲𝗮𝗹 𝗱𝗮𝘁𝗮, 𝗮𝘃𝗮𝗶𝗹𝗮𝗯𝗹𝗲 𝗳𝗼𝗿 𝗼𝘃𝗲𝗿 𝟭𝟱𝟬+ 𝗹𝗶𝗾𝘂𝗶𝗱 𝗨𝗦 𝗺𝗮𝗿𝗸𝗲𝘁 𝘀𝘆𝗺𝗯𝗼𝗹𝘀!
𝗢𝘂𝗿 𝘀𝗰𝗿𝗲𝗲𝗻𝗲𝗿 𝗽𝗿𝗼𝘃𝗶𝗱𝗲𝘀 𝗲𝘀𝘀𝗲𝗻𝘁𝗶𝗮𝗹 𝗸𝗲𝘆 𝗺𝗲𝘁𝗿𝗶𝗰𝘀 𝘀𝘂𝗰𝗵 𝗮𝘀:
✅ IVRank
✅ IVx
✅ 5-Day IVx Change
✅ Vertical Pricing Skew
✅ Horizontal IVx Skew
✅ Delta Skew
like TastyTrade, TOS, IBKR etc.
Designed to help you assess option market conditions and make well-informed trading decisions, this tool is an essential addition for every serious options trader!
Ticker Information:
This screener is currently implemented for more than 150 liquid US market tickers and we are continuously expanding the list:
SP:SPX AMEX:SPY NASDAQ:QQQ NASDAQ:TLT AMEX:GLD
NYSE:AA NASDAQ:AAL NASDAQ:AAPL NYSE:ABBV NASDAQ:ABNB NASDAQ:AMD NASDAQ:AMZN AMEX:ARKK NASDAQ:AVGO NYSE:AXP NYSE:BA NYSE:BABA NYSE:BAC NASDAQ:BIDU AMEX:BITO NYSE:BMY NYSE:BP NASDAQ:BYND NYSE:C NYSE:CAT NYSE:CCJ NYSE:CCL NASDAQ:COIN NYSE:COP NASDAQ:COST NYSE:CRM NASDAQ:CRWD NASDAQ:CSCO NYSE:CVNA NYSE:CVS NYSE:CVX NYSE:DAL NASDAQ:DBX AMEX:DIA NYSE:DIS NASDAQ:DKNG NASDAQ:EBAY NASDAQ:ETSY NASDAQ:EXPE NYSE:F NYSE:FCX NYSE:FDX AMEX:FXI AMEX:GDX AMEX:GDXJ NYSE:GE NYSE:GM NYSE:GME NYSE:GOLD NASDAQ:GOOG NASDAQ:GOOGL NYSE:GPS NYSE:GS NASDAQ:HOOD NYSE:IBM NASDAQ:IEF NASDAQ:INTC AMEX:IWM NASDAQ:JD NYSE:JNJ NYSE:JPM NYSE:JWN NYSE:KO NYSE:LLY NYSE:LOW NYSE:LVS NYSE:MA NASDAQ:MARA NYSE:MCD NYSE:MET NASDAQ:META NYSE:MGM NYSE:MMM NYSE:MPC NYSE:MRK NASDAQ:MRNA NYSE:MRO NASDAQ:MRVL NYSE:MS NASDAQ:MSFT AMEX:MSOS NYSE:NCLH NASDAQ:NDX NYSE:NET NASDAQ:NFLX NYSE:NIO NYSE:NKE NASDAQ:NVDA NASDAQ:ON NYSE:ORCL NYSE:OXY NASDAQ:PEP NYSE:PFE NYSE:PINS NYSE:PLTR NASDAQ:PTON NASDAQ:PYPL NASDAQ:QCOM NYSE:RBLX NYSE:RCL NASDAQ:RIOT NASDAQ:RIVN NASDAQ:ROKU NASDAQ:SBUX NYSE:SHOP AMEX:SLV NASDAQ:SMCI NASDAQ:SMH NYSE:SNAP NYSE:SQ NYSE:T NYSE:TGT NASDAQ:TQQQ NASDAQ:TSLA NYSE:TSM NASDAQ:TTD NASDAQ:TXN NYSE:U NASDAQ:UAL NYSE:UBER AMEX:UNG NYSE:UPS NASDAQ:UPST AMEX:USO NYSE:V AMEX:VXX NYSE:VZ NASDAQ:WBA NYSE:WFC NYSE:WMT NASDAQ:WYNN NYSE:X AMEX:XHB AMEX:XLE AMEX:XLF AMEX:XLI AMEX:XLK AMEX:XLP AMEX:XLU AMEX:XLV AMEX:XLY NYSE:XOM NYSE:XPEV CBOE:XSP NASDAQ:ZM
How does the screener work and why is it unique?
This Pine Script screener is an expert tool created to provide various option metrics and visualization tools for options market traders. The screener extracts raw options data from an external data provider (ORATS), processes, and refines the delayed data package using pineseed, and sends it to TradingView. The data is calculated using specific formulas or interpolated values, such as delta distances. This method of integrating options data into a screener framework is unique and innovative on TradingView.
The screener aims to offer a comprehensive view of the current state of options for the implemented instruments, including implied volatility index (IVx), IV rank (IVR), options skew, and expected market movements, which are objectively measured as detailed below.
The options metrics displayed may be familiar to options traders from various major brokerage platforms such as TastyTrade, IBKR, TOS, Tradier, TD Ameritrade, Schwab, etc.
🟨 𝗗𝗘𝗧𝗔𝗜𝗟𝗘𝗗 𝗗𝗢𝗖𝗨𝗠𝗘𝗡𝗧𝗔𝗧𝗜𝗢𝗡 🟨
~~~~~~~~~~~~~~~~~~~~~~~~~~~~~~~~~~~~~~~~~~~~~~~~~~
~~~~~~~~~~~~~~~~~~~~~~~~~~~~~~~~~~~~~~~~~~~~~~~~~~
🔶 Auto-Updating Option Metrics
~~~~~~~~~~~~~~~~~~~~~~~~~~~~~~~~~~~~~~~~~~~~~~~~~~
~~~~~~~~~~~~~~~~~~~~~~~~~~~~~~~~~~~~~~~~~~~~~~~~~~
🔹 IVR (IV Rank)
The Implied Volatility Rank (IVR) indicator helps options traders assess the current level of implied volatility (IV) in comparison to the past 52 weeks. IVR is a useful metric to determine whether options are relatively cheap or expensive. This can guide traders on whether to buy or sell options. We calculate IVrank, like TastyTrade does.
IVR Calculation: IV Rank = (current IV - 52 week IV low) / (52 week IV high - 52 week IV low)
IVR Levels and Interpretations:
IVR 0-10 (Green): Very low implied volatility rank. Options might be "cheap," potentially a good time to buy options.
IVR 10-35 (White): Normal implied volatility rank. Options pricing is relatively standard.
IVR 35-50 (Orange): Almost high implied volatility rank.
IVR 50-75 (Red): Definitely high implied volatility rank. Options might be "expensive," potentially a good time to sell options for higher premiums.
IVR above 75 (Highlighted Red): Ultra high implied volatility rank. Indicates very high levels, suggesting a favorable time for selling options.
Extra: If the IVx value is also greater than 30, the background will be dark highlighted, because a high IVR alone doesn’t mean much without high IVx.
🔹IVx (Implied Volatility Index)
The Implied Volatility Index (IVx) displayed in the option chain is calculated similarly to the VIX. The Cboe employs standard and weekly SPX options to measure the expected volatility of the S&P 500. A similar method is utilized to calculate IVx for each option expiration cycle.
For our purposes, we aggregate the IVx values specifically for the 35-70 day monthly expiration cycle . This aggregated value is then presented in the screener and info panel, providing a clear and concise measure of implied volatility over this period.
We will display a warning if the option chain is heavily skewed and valid, symmetric 16 delta options are not found at optimal monthly expirations.
IVx Color coding:
IVx above 30 is displayed in orange.
IVx above 60 is displayed in red
Important Note: The IVx value alone does not provide sufficient context. There are stocks that inherently exhibit high IVx values. Therefore, it is crucial to consider IVx in conjunction with the Implied Volatility Rank (IVR), which measures the IVx relative to its own historical values. This combined view helps in accurately assessing the significance of the IVx in relation to the specific stock's typical volatility behavior.
This indicator offers traders a comprehensive view of implied volatility, assisting them in making informed decisions by highlighting both the absolute and relative volatility measures.
🔹IVx 5 days change %
We are displaying the five-day change of the IV Index (IVx value). The IV Index 5-Day Change column provides quick insight into recent expansions or decreases in implied volatility over the last five trading days.
Traders who expect the value of options to decrease might view a decrease in IVX as a positive signal. Strategies such as Strangle and Ratio Spread can benefit from this decrease.
On the other hand, traders anticipating further increases in IVX will focus on the rising IVX values. Strategies like Calendar Spread or Diagonal Spread can take advantage of increasing implied volatility.
This indicator helps traders quickly assess changes in implied volatility, enabling them to make informed decisions based on their trading strategies and market expectations.
🔹 Vertical Pricing Skew
At TanukiTrade, Vertical Pricing Skew refers to the difference in pricing between put and call options with the same expiration date at the same distance (at expected move). We analyze this skew to understand market sentiment. This is the same formula used by TastyTrade for calculations.
PUT Skew (red): Put options are more expensive than call options, indicating the market expects a downward move (▽). If put options are more expensive by more than 20% at the same expected move distance, we color it lighter red.
CALL Skew (green): Call options are more expensive than put options, indicating the market expects an upward move (△). If call options are priced more than 30% higher at the examined expiration, we color it lighter green.
We focus on options with 35-70 days to expiration (DTE) for optimal analysis. We always evaluate the skew at the expected move using linear interpolation to determine the theoretical pricing of options. If the pricing have more than C50%/P35% we are highlighting the cell.
This approach helps us gauge market expectations accurately, providing insights into potential price movements.
🔹 Horizontal IVx Skew
In options pricing, it is typically expected that the implied volatility (IVx) increases for options with later expiration dates. This means that options further out in time are generally more expensive. At TanukiTrade, we refer to the phenomenon where this expectation is reversed—when the IVx decreases between two consecutive expirations—as Horizontal Skew or IVx Skew.
Horizontal IVx Skew occurs when: Front Month IVx < Back Month IVx
This scenario can create opportunities for traders who prefer diagonal or calendar strategies. Based on our experience, we categorize Horizontal Skew into two types:
Weekly Horizontal Skew: When IVx skew is observed between two consecutive non-monthly expirations , the displayed value is the rounded-up percentage difference. On hover, the approximate location of this skew is also displayed. The precise location can be seen on the Overlay indicator.
Monthly Horizontal Skew: When IVx skew is observed between two consecutive monthly expirations , the displayed value is the rounded-up percentage difference. On hover, the approximate location of this skew is also displayed. The precise location can be seen on the Overlay indicator.
The Monthly Vertical IVx skew is consistently stronger (more liquid) on average symbols than the weekly vertical IVx skew. Weekly Horizontal IVx Skew may not carry relevant information for symbols not included in the 'Weeklies & Volume Masters' preset.
If the options chain follows the normal IVx pattern, no skew value is displayed.
Additionally , if the Implied Volatility Rank (IVR) is low (indicated by green), the Horizontal Skew background turns black, because this environment is good for Calendar+Diagonal.
Additionally , if the % of the skew is greater than 10, the Horizontal Skew font color turns lighter.
🔹 Delta Skew 🌪️ (Twist)
We have a metric that examines which monthly expiration indicates a "Delta Skew Twist" where the 16 delta deviates from the monthly STD. This is important because, under normal circumstances, the 16 delta is positioned between the expected move and the standard deviation (STD1) line. However, if the interpolated 16 delta line exceeds the STD1 line either upwards or downwards, it represents a special case of vertical skew.
Normal case : exp.move < delta16 < std1
Delta Skew Twist: exp.move < std1 < delta16
If the Days to Expiration of the twist is less than 75, we use a lighter color.
~~~~~~~~~~~~~~~~~~~~~~~~~~~~~~~~~~~~~~~~~~~~~~~~~~
~~~~~~~~~~~~~~~~~~~~~~~~~~~~~~~~~~~~~~~~~~~~~~~~~~
🔶 HOW WE CALCULATE
~~~~~~~~~~~~~~~~~~~~~~~~~~~~~~~~~~~~~~~~~~~~~~~~~~
~~~~~~~~~~~~~~~~~~~~~~~~~~~~~~~~~~~~~~~~~~~~~~~~~~
🔹 Expected Move
The expected move is the predicted dollar change in the underlying stock's price by a given option's expiration date, with 68% certainty. It is calculated using the expiration's pricing and implied volatility levels.
Expected Move Calculation
Expected Move = (ATM straddle price x 0.6) + (1st OTM strangle price x 0.3) + (2nd OTM strangle price x 0.1)
For example , if stock XYZ is trading at 121 and the ATM straddle is 4.40, the 120/122 strangle is 3.46, and the 119/123 strangle is 2.66, the expected move is calculated as follows: 4.40 x 0.60 = 2.64; 3.46 x 0.30 = 1.04; 2.66 x 0.10 = 0.27; Expected move = 2.64 + 1.04 + 0.27 = ±3.9
🔹 Standard deviation
One standard deviation of a stock encompasses approximately 68.2% of outcomes in a distribution of occurrences based on current implied volatility.
We use the expected move formula to calculate the one standard deviation range of a stock. This calculation is based on the days-to-expiration (DTE) of our option contract, the stock price, and the implied volatility of a stock:
Calculation:
Standard Deviation = Closing Price * Implied Volatility * sqrt(Days to Expiration / 365)
According to options literature, there is a 68% probability that the underlying asset will fall within this one standard deviation range at expiration.
∑ Quant Observation: The values of the expected move and the 1st standard deviation (1STD) will not match because they use different calculation methods, even though both are referred to as representing 68% of the underlying asset's movement in options literature. The expected move is based on direct market pricing of ATM options. The 1STD, on the other hand, uses the averaged implied volatility (IVX) for the given expiration to determine its value. Based on our experience, it is better to consider the area between the expected move and the 1STD as the true representation of the original 68% rule.
~~~~~~~~~~~~~~~~~~~~~~~~~~~~~~~~~~~~~~~~~~~~~~~~~~
~~~~~~~~~~~~~~~~~~~~~~~~~~~~~~~~~~~~~~~~~~~~~~~~~~
🔶 USAGE
~~~~~~~~~~~~~~~~~~~~~~~~~~~~~~~~~~~~~~~~~~~~~~~~~~
~~~~~~~~~~~~~~~~~~~~~~~~~~~~~~~~~~~~~~~~~~~~~~~~~~
🔹 Create a new empty layout for the screener!
You can access this from the dropdown menu in the upper right corner. In the popup window, name it as you like, for example, "Option Screener."
🔹 Hide the candlestick chart
Make the chart invisible using the "Hide" option from the three-dot dropdown menu located in the upper left corner.
🔹 Other Unwanted Elements
If other unnecessary elements are distracting you (e.g., economic data, volume, default grid), you can easily remove them from the layout. Right-click on the empty chart area. Here, click on the gear (Settings) icon and remove everything from the "Events" tab, as well as from the "Trading" tab. Under the "Canvas" tab, it is recommended to set the "Grid lines" setting to "None."
~~~~~~~~~~~~~~~~~~~~~~~~~~~~~~~~~~~~~~~~~~~~~~~~~~
~~~~~~~~~~~~~~~~~~~~~~~~~~~~~~~~~~~~~~~~~~~~~~~~~~
🔶 Screener Settings
~~~~~~~~~~~~~~~~~~~~~~~~~~~~~~~~~~~~~~~~~~~~~~~~~~
~~~~~~~~~~~~~~~~~~~~~~~~~~~~~~~~~~~~~~~~~~~~~~~~~~
Naturally, the font size and position can be easily adjusted.
Additionally, there are two basic usage modes: manual input or using the preset list.
🔹If you selected “Manual Below” in the preset dropdown, the tickers you chose from the dropdown (up to a maximum of 40) will be displayed. The panel name will be the one you specified.
🔹If you selected a pre-assembled list , the manually entered list will be ignored, and the preset list will be displayed. (In the future, we will expand the preset list based on your feedback!).
~~~~~~~~~~~~~~~~~~~~~~~~~~~~~~~~~~~~~~~~~~~~~~~~~~
~~~~~~~~~~~~~~~~~~~~~~~~~~~~~~~~~~~~~~~~~~~~~~~~~~
🔶 Best Practices for TanukiTrade Option Screener:
~~~~~~~~~~~~~~~~~~~~~~~~~~~~~~~~~~~~~~~~~~~~~~~~~~
~~~~~~~~~~~~~~~~~~~~~~~~~~~~~~~~~~~~~~~~~~~~~~~~~~
🔹 Every Preset on a New Layout:
If you following the steps above, you easy can setup this screener in one window with one split layout:
🔹 Split Layout:
- Left Side: The underlying asset with our Options IV Overlay (IVR, Deltas, Expected Move, STD1, Skew visualized) along with the Enhanced Murrey Math Indicator and Option Expiry.
- Right Side: Searching for opportunities using our Options Screener.
Opportunities Search
🔹 Everything in One Layout + One Window:
This is the all-in-one view:
- The underlying asset with our Options IV Overlay (IVR, Deltas, Expected Move, STD1, Skew visualized)
- Enhanced Murrey Math Indicator and Option Expiry
- Options Screener on the left
~~~~~~~~~~~~~~~~~~~~~~~~~~~~~~~~~~~~~~~~
🔶 ADDITIONAL IMPORTANT COMMENTS
- U.S. market only:
Since we only deal with liquid option chains: this option indicator only works for the USA options market and do not include future contracts; we have implemented each selected symbol individually.
- Why is there a slight difference between the displayed data and my live brokerage data? There are two reasons for this, and one is beyond our control.
- Brokerage Calculation Differences:
Every brokerage has slight differences in how they calculate metrics like IV and IVx. If you open three windows for TOS, TastyTrade, and IBKR side by side, you will notice that the values are minimally different. We had to choose a standard, so we use the formulas and mathematical models described by TastyTrade when analyzing the options chain and drawing conclusions.
- Option-data update frequency:
According to TradingView's regulations and guidelines, we can update external data a maximum of 5 times per day. We strive to use these updates in the most optimal way:
(1st update) 15 minutes after U.S. market open
(2nd, 3rd, 4th updates) 1.5–3 hours during U.S. market open hours
(5th update) 10 minutes before market close.
You don’t need to refresh your window, our last refreshed data-pack is always automatically applied to your indicator , and you can see the time elapsed since the last update at the bottom of your indicator.
- Weekly illiquid expiries:
The Weekly Horizontal IVx Skew may not carry relevant information for instruments not included in the 'Weeklies & Volume Masters' preset package.
-Timeframe Issues:
Our option indicator visualizes relevant data on a daily resolution. If you see strange or incorrect data (e.g., when the options data was last updated), always switch to a daily (1D) timeframe. If you still see strange data, please contact us.
Disclaimer:
Our option indicator uses approximately 15min-3 hour delayed option market snapshot data to calculate the main option metrics. Exact realtime option contract prices are never displayed; only derived metrics and interpolated delta are shown to ensure accurate and consistent visualization. Due to the above, this indicator can only be used for decision support; exclusive decisions cannot be made based on this indicator . We reserve the right to make errors.This indicator is designed for options traders who understand what they are doing. It assumes that they are familiar with options and can make well-informed, independent decisions. We work with public data and are not a data provider; therefore, we do not bear any financial or other liability.

Options SCREENER [Lite] - IVRank, IVx, Deltas, Exp.move, Skew
𝗢𝗽𝘁𝗶𝗼𝗻 𝘀𝗰𝗿𝗲𝗲𝗻𝗲𝗿 𝗼𝗻 𝗧𝗿𝗮𝗱𝗶𝗻𝗴𝗩𝗶𝗲𝘄 𝘄𝗶𝘁𝗵 𝗿𝗲𝗮𝗹 𝗱𝗮𝘁𝗮, 𝗼𝗻𝗹𝘆 𝗳𝗼𝗿 𝟱 𝗹𝗶𝗾𝘂𝗶𝗱 𝗨𝗦 𝗺𝗮𝗿𝗸𝗲𝘁 𝘀𝘆𝗺𝗯𝗼𝗹𝘀
𝗢𝘂𝗿 𝘀𝗰𝗿𝗲𝗲𝗻𝗲𝗿 𝗽𝗿𝗼𝘃𝗶𝗱𝗲𝘀 𝗲𝘀𝘀𝗲𝗻𝘁𝗶𝗮𝗹 𝗸𝗲𝘆 𝗺𝗲𝘁𝗿𝗶𝗰𝘀 𝘀𝘂𝗰𝗵 𝗮𝘀:
✅ IVRank
✅ IVx
✅ 5-Day IVx Change
✅ Vertical Pricing Skew
✅ Horizontal IVx Skew
✅ Delta Skew
like TastyTrade, TOS, IBKR etc.
Designed to help you assess option market conditions and make well-informed trading decisions, this tool is an essential addition for every serious options trader!
Ticker Information:
This screener is currently implemented only for 5 liquid US market tickers:
NASDAQ:AAPL NASDAQ:AMZN AMEX:DIA NYSE:ORCL and NASDAQ:TSLA
How does the screener work and why is it unique?
This Pine Script screener is an expert tool created to provide various option metrics and visualization tools for options market traders. The screener extracts raw options data from an external data provider (ORATS), processes, and refines the delayed data package using pineseed, and sends it to TradingView. The data is calculated using specific formulas or interpolated values, such as delta distances. This method of integrating options data into a screener framework is unique and innovative on TradingView.
The screener aims to offer a comprehensive view of the current state of options for the implemented instruments, including implied volatility index (IVx), IV rank (IVR), options skew, and expected market movements, which are objectively measured as detailed below.
The options metrics displayed may be familiar to options traders from various major brokerage platforms such as TastyTrade, IBKR, TOS, Tradier, TD Ameritrade, Schwab, etc.
🟨 𝗗𝗘𝗧𝗔𝗜𝗟𝗘𝗗 𝗗𝗢𝗖𝗨𝗠𝗘𝗡𝗧𝗔𝗧𝗜𝗢𝗡 🟨
~~~~~~~~~~~~~~~~~~~~~~~~~~~~~~~~~~~~~~~~~~~~~~~~~~
~~~~~~~~~~~~~~~~~~~~~~~~~~~~~~~~~~~~~~~~~~~~~~~~~~
🔶 Auto-Updating Option Metrics
~~~~~~~~~~~~~~~~~~~~~~~~~~~~~~~~~~~~~~~~~~~~~~~~~~
~~~~~~~~~~~~~~~~~~~~~~~~~~~~~~~~~~~~~~~~~~~~~~~~~~
🔹 IVR (IV Rank)
The Implied Volatility Rank (IVR) indicator helps options traders assess the current level of implied volatility (IV) in comparison to the past 52 weeks. IVR is a useful metric to determine whether options are relatively cheap or expensive. This can guide traders on whether to buy or sell options. We calculate IVrank, like TastyTrade does.
IVR Calculation: IV Rank = (current IV - 52 week IV low) / (52 week IV high - 52 week IV low)
IVR Levels and Interpretations:
IVR 0-10 (Green): Very low implied volatility rank. Options might be "cheap," potentially a good time to buy options.
IVR 10-35 (White): Normal implied volatility rank. Options pricing is relatively standard.
IVR 35-50 (Orange): Almost high implied volatility rank.
IVR 50-75 (Red): Definitely high implied volatility rank. Options might be "expensive," potentially a good time to sell options for higher premiums.
IVR above 75 (Highlighted Red): Ultra high implied volatility rank. Indicates very high levels, suggesting a favorable time for selling options.
Extra: If the IVx value is also greater than 30, the background will be dark highlighted, because a high IVR alone doesn’t mean much without high IVx.
🔹IVx (Implied Volatility Index)
The Implied Volatility Index (IVx) displayed in the option chain is calculated similarly to the VIX. The Cboe employs standard and weekly SPX options to measure the expected volatility of the S&P 500. A similar method is utilized to calculate IVx for each option expiration cycle.
For our purposes, we aggregate the IVx values specifically for the 35-70 day monthly expiration cycle . This aggregated value is then presented in the screener and info panel, providing a clear and concise measure of implied volatility over this period.
We will display a warning if the option chain is heavily skewed and valid, symmetric 16 delta options are not found at optimal monthly expirations.
IVx Color coding:
IVx above 30 is displayed in orange.
IVx above 60 is displayed in red
Important Note: The IVx value alone does not provide sufficient context. There are stocks that inherently exhibit high IVx values. Therefore, it is crucial to consider IVx in conjunction with the Implied Volatility Rank (IVR), which measures the IVx relative to its own historical values. This combined view helps in accurately assessing the significance of the IVx in relation to the specific stock's typical volatility behavior.
This indicator offers traders a comprehensive view of implied volatility, assisting them in making informed decisions by highlighting both the absolute and relative volatility measures.
🔹IVx 5 days change %
We are displaying the five-day change of the IV Index (IVx value). The IV Index 5-Day Change column provides quick insight into recent expansions or decreases in implied volatility over the last five trading days.
Traders who expect the value of options to decrease might view a decrease in IVX as a positive signal. Strategies such as Strangle and Ratio Spread can benefit from this decrease.
On the other hand, traders anticipating further increases in IVX will focus on the rising IVX values. Strategies like Calendar Spread or Diagonal Spread can take advantage of increasing implied volatility.
This indicator helps traders quickly assess changes in implied volatility, enabling them to make informed decisions based on their trading strategies and market expectations.
🔹 Vertical Pricing Skew
At TanukiTrade, Vertical Pricing Skew refers to the difference in pricing between put and call options with the same expiration date at the same distance (at expected move). We analyze this skew to understand market sentiment. This is the same formula used by TastyTrade for calculations.
PUT Skew (red): Put options are more expensive than call options, indicating the market expects a downward move (▽). If put options are more expensive by more than 20% at the same expected move distance, we color it lighter red.
CALL Skew (green): Call options are more expensive than put options, indicating the market expects an upward move (△). If call options are priced more than 30% higher at the examined expiration, we color it lighter green.
We focus on options with 35-70 days to expiration (DTE) for optimal analysis. We always evaluate the skew at the expected move using linear interpolation to determine the theoretical pricing of options. If the pricing have more than C50%/P35% we are highlighting the cell.
This approach helps us gauge market expectations accurately, providing insights into potential price movements.
🔹 Horizontal IVx Skew
In options pricing, it is typically expected that the implied volatility (IVx) increases for options with later expiration dates. This means that options further out in time are generally more expensive. At TanukiTrade, we refer to the phenomenon where this expectation is reversed—when the IVx decreases between two consecutive expirations—as Horizontal Skew or IVx Skew.
Horizontal IVx Skew occurs when: Front Month IVx < Back Month IVx
This scenario can create opportunities for traders who prefer diagonal or calendar strategies. Based on our experience, we categorize Horizontal Skew into two types:
Weekly Horizontal Skew: When IVx skew is observed between two consecutive non-monthly expirations , the displayed value is the rounded-up percentage difference. On hover, the approximate location of this skew is also displayed. The precise location can be seen on the Overlay indicator.
Monthly Horizontal Skew: When IVx skew is observed between two consecutive monthly expirations , the displayed value is the rounded-up percentage difference. On hover, the approximate location of this skew is also displayed. The precise location can be seen on the Overlay indicator.
The Monthly Vertical IVx skew is consistently stronger (more liquid) on average symbols than the weekly vertical IVx skew. Weekly Horizontal IVx Skew may not carry relevant information for symbols not included in the 'Weeklies & Volume Masters' preset.
If the options chain follows the normal IVx pattern, no skew value is displayed.
Additionally , if the Implied Volatility Rank (IVR) is low (indicated by green), the Horizontal Skew background turns black, because this environment is good for Calendar+Diagonal.
Additionally , if the % of the skew is greater than 10, the Horizontal Skew font color turns lighter.
🔹 Delta Skew 🌪️ (Twist)
We have a metric that examines which monthly expiration indicates a "Delta Skew Twist" where the 16 delta deviates from the monthly STD. This is important because, under normal circumstances, the 16 delta is positioned between the expected move and the standard deviation (STD1) line. However, if the interpolated 16 delta line exceeds the STD1 line either upwards or downwards, it represents a special case of vertical skew.
Normal case : exp.move < delta16 < std1
Delta Skew Twist: exp.move < std1 < delta16
If the Days to Expiration of the twist is less than 75, we use a lighter color.
~~~~~~~~~~~~~~~~~~~~~~~~~~~~~~~~~~~~~~~~~~~~~~~~~~
~~~~~~~~~~~~~~~~~~~~~~~~~~~~~~~~~~~~~~~~~~~~~~~~~~
🔶 HOW WE CALCULATE
~~~~~~~~~~~~~~~~~~~~~~~~~~~~~~~~~~~~~~~~~~~~~~~~~~
~~~~~~~~~~~~~~~~~~~~~~~~~~~~~~~~~~~~~~~~~~~~~~~~~~
🔹 Expected Move
The expected move is the predicted dollar change in the underlying stock's price by a given option's expiration date, with 68% certainty. It is calculated using the expiration's pricing and implied volatility levels.
Expected Move Calculation
Expected Move = (ATM straddle price x 0.6) + (1st OTM strangle price x 0.3) + (2nd OTM strangle price x 0.1)
For example , if stock XYZ is trading at 121 and the ATM straddle is 4.40, the 120/122 strangle is 3.46, and the 119/123 strangle is 2.66, the expected move is calculated as follows: 4.40 x 0.60 = 2.64; 3.46 x 0.30 = 1.04; 2.66 x 0.10 = 0.27; Expected move = 2.64 + 1.04 + 0.27 = ±3.9
🔹 Standard deviation
One standard deviation of a stock encompasses approximately 68.2% of outcomes in a distribution of occurrences based on current implied volatility.
We use the expected move formula to calculate the one standard deviation range of a stock. This calculation is based on the days-to-expiration (DTE) of our option contract, the stock price, and the implied volatility of a stock:
Calculation:
Standard Deviation = Closing Price * Implied Volatility * sqrt(Days to Expiration / 365)
According to options literature, there is a 68% probability that the underlying asset will fall within this one standard deviation range at expiration.
∑ Quant Observation: The values of the expected move and the 1st standard deviation (1STD) will not match because they use different calculation methods, even though both are referred to as representing 68% of the underlying asset's movement in options literature. The expected move is based on direct market pricing of ATM options. The 1STD, on the other hand, uses the averaged implied volatility (IVX) for the given expiration to determine its value. Based on our experience, it is better to consider the area between the expected move and the 1STD as the true representation of the original 68% rule.
~~~~~~~~~~~~~~~~~~~~~~~~~~~~~~~~~~~~~~~~~~~~~~~~~~
~~~~~~~~~~~~~~~~~~~~~~~~~~~~~~~~~~~~~~~~~~~~~~~~~~
🔶 USAGE
~~~~~~~~~~~~~~~~~~~~~~~~~~~~~~~~~~~~~~~~~~~~~~~~~~
~~~~~~~~~~~~~~~~~~~~~~~~~~~~~~~~~~~~~~~~~~~~~~~~~~
🔹 Create a new empty layout for the screener!
You can access this from the dropdown menu in the upper right corner. In the popup window, name it as you like, for example, "Option Screener."
🔹 Hide the candlestick chart
Make the chart invisible using the "Hide" option from the three-dot dropdown menu located in the upper left corner.
🔹 Other Unwanted Elements
If other unnecessary elements are distracting you (e.g., economic data, volume, default grid), you can easily remove them from the layout. Right-click on the empty chart area. Here, click on the gear (Settings) icon and remove everything from the "Events" tab, as well as from the "Trading" tab. Under the "Canvas" tab, it is recommended to set the "Grid lines" setting to "None."
~~~~~~~~~~~~~~~~~~~~~~~~~~~~~~~~~~~~~~~~~~~~~~~~~~
~~~~~~~~~~~~~~~~~~~~~~~~~~~~~~~~~~~~~~~~~~~~~~~~~~
🔶 Screener Settings
~~~~~~~~~~~~~~~~~~~~~~~~~~~~~~~~~~~~~~~~~~~~~~~~~~
~~~~~~~~~~~~~~~~~~~~~~~~~~~~~~~~~~~~~~~~~~~~~~~~~~
Naturally, the font size and position can be easily adjusted.
Additionally, there are two basic usage modes: manual input or using the preset list.
🔹If you selected “Manual Below” in the preset dropdown, the tickers you chose from the dropdown (up to a maximum of 40) will be displayed. The panel name will be the one you specified.
🔹If you selected a pre-assembled list , the manually entered list will be ignored, and the preset list will be displayed. (In the future, we will expand the preset list based on your feedback!).
~~~~~~~~~~~~~~~~~~~~~~~~~~~~~~~~~~~~~~~~~~~~~~~~~~
~~~~~~~~~~~~~~~~~~~~~~~~~~~~~~~~~~~~~~~~~~~~~~~~~~
🔶 Best Practices for TanukiTrade Option Screener:
~~~~~~~~~~~~~~~~~~~~~~~~~~~~~~~~~~~~~~~~~~~~~~~~~~
~~~~~~~~~~~~~~~~~~~~~~~~~~~~~~~~~~~~~~~~~~~~~~~~~~
🔹 Every Preset on a New Layout:
If you following the steps above, you easy can setup this screener in one window with one split layout:
🔹 Split Layout:
- Left Side: The underlying asset with our Options IV Overlay (IVR, Deltas, Expected Move, STD1, Skew visualized) along with the Enhanced Murrey Math Indicator and Option Expiry.
- Right Side: Searching for opportunities using our Options Screener.
Opportunities Search
🔹 Everything in One Layout + One Window:
This is the all-in-one view:
- The underlying asset with our Options IV Overlay (IVR, Deltas, Expected Move, STD1, Skew visualized)
- Enhanced Murrey Math Indicator and Option Expiry
- Options Screener on the left
~~~~~~~~~~~~~~~~~~~~~~~~~~~~~~~~~~~~~~~~
🔶 ADDITIONAL IMPORTANT COMMENTS
- U.S. market only:
Since we only deal with liquid option chains: this option indicator only works for the USA options market and do not include future contracts; we have implemented each selected symbol individually.
- Why is there a slight difference between the displayed data and my live brokerage data? There are two reasons for this, and one is beyond our control.
- Brokerage Calculation Differences:
Every brokerage has slight differences in how they calculate metrics like IV and IVx. If you open three windows for TOS, TastyTrade, and IBKR side by side, you will notice that the values are minimally different. We had to choose a standard, so we use the formulas and mathematical models described by TastyTrade when analyzing the options chain and drawing conclusions.
- Option-data update frequency:
According to TradingView's regulations and guidelines, we can update external data a maximum of 5 times per day. We strive to use these updates in the most optimal way:
(1st update) 15 minutes after U.S. market open
(2nd, 3rd, 4th updates) 1.5–3 hours during U.S. market open hours
(5th update) 10 minutes before market close.
You don’t need to refresh your window, our last refreshed data-pack is always automatically applied to your indicator , and you can see the time elapsed since the last update at the bottom of your indicator.
- Weekly illiquid expiries:
The Weekly Horizontal IVx Skew may not carry relevant information for instruments not included in the 'Weeklies & Volume Masters' preset package.
-Timeframe Issues:
Our option indicator visualizes relevant data on a daily resolution. If you see strange or incorrect data (e.g., when the options data was last updated), always switch to a daily (1D) timeframe. If you still see strange data, please contact us.
Disclaimer:
Our option indicator uses approximately 15min-3 hour delayed option market snapshot data to calculate the main option metrics. Exact realtime option contract prices are never displayed; only derived metrics and interpolated delta are shown to ensure accurate and consistent visualization. Due to the above, this indicator can only be used for decision support; exclusive decisions cannot be made based on this indicator . We reserve the right to make errors.This indicator is designed for options traders who understand what they are doing. It assumes that they are familiar with options and can make well-informed, independent decisions. We work with public data and are not a data provider; therefore, we do not bear any financial or other liability.
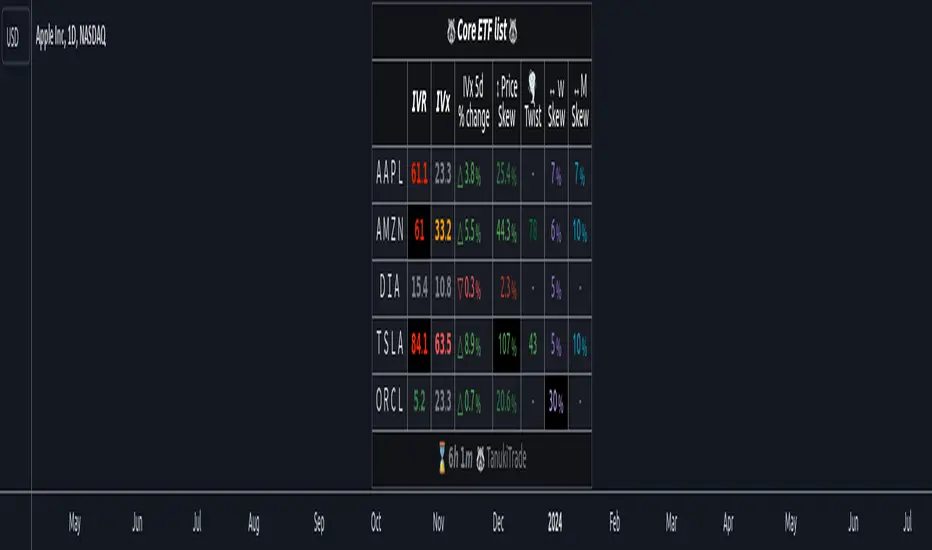
Options Overlay [Lite] IVR IV Skew Delta Expmv MurreyMath Expiry𝗡𝗼𝗻-𝗼𝗳𝗳𝗶𝗰𝗶𝗮𝗹 𝗧𝗢𝗦 𝗮𝗻𝗱 𝗧𝗮𝘀𝘁𝘆𝗧𝗿𝗮𝗱𝗲 𝗹𝗶𝗸𝗲 𝗜𝗩𝗥 𝗢𝗽𝘁𝗶𝗼𝗻𝘀 𝘃𝗶𝘀𝘂𝗮𝗹𝗶𝘇𝗮𝘁𝗶𝗼𝗻 𝘁𝗼𝗼𝗹 𝘄𝗶𝘁𝗵 𝗱𝗲𝗹𝗮𝘆𝗲𝗱 𝗼𝗽𝘁𝗶𝗼𝗻 𝗰𝗵𝗮𝗶𝗻 𝗱𝗮𝘁𝗮
Are you an options trader who uses TradingView for technical analysis for the US market?
➡️ Do you want to see the IV Rank of an instrument on TradingView?
➡️ Can’t you check the key options metrics while charting?
➡️ Have you never visualized the options chain before?
➡️ Would you like to see how the IVx has changed for a specific ticker?
If you answered "yes" to any of these questions, then we have the solution for you!
🔃 Auto-Updating Option Metrics without refresh!
🍒 Developed and maintained by option traders for option traders.
📈 Specifically designed for TradingView users who trade options.
Our indicator provides essential key metrics such as:
✅ IVRank
✅ IVx
✅ 5-Day IVx Change
✅ Delta curves and interpolated distances
✅ Expected move curve
✅ Standard deviation (STD1) curve
✅ Vertical Pricing Skew
✅ Horizontal IVx Skew
✅ Delta Skew
like TastyTrade, TOS, IBKR etc, but in a much more visually intuitive way. See detailed descriptions below.
If this isn't enough, we also include a unique grid system designed specifically for options traders. This package features our innovative dynamic grid system:
✅ Enhanced Murrey Math levels (horizontal scale)
✅ Options expirations (vertical scale)
Designed to help you assess market conditions and make well-informed trading decisions, this tool is an essential addition for every serious options trader!
Ticker Information:
This indicator is currently implemented for 5 liquid tickers: NASDAQ:AAPL NASDAQ:AMZN AMEX:DIA NYSE:ORCL and NASDAQ:TSLA
How does the indicator work and why is it unique?
This Pine Script indicator is a complex tool designed to provide various option metrics and visualization tools for options market traders. The indicator extracts raw options data from an external data provider (ORATS), processes and refines the delayed data package using pineseed, and sends it to TradingView, visualizing the data using specific formulas (see detailed below) or interpolated values (e.g., delta distances). This method of incorporating options data into a visualization framework is unique and entirely innovative on TradingView.
The indicator aims to offer a comprehensive view of the current state of options for the implemented instruments, including implied volatility (IV), IV rank (IVR), options skew, and expected market movements, which are objectively measured as detailed below.
The options metrics we display may be familiar to options traders from various major brokerage platforms such as TastyTrade, IBKR, TOS, Tradier, TD Ameritrade, Schwab, etc.
Key Features:
IV Rank (IVR) : The implied volatility rank compares the current IV to the lowest and highest values over the past 52 weeks. The IVR indicator helps determine whether options are relatively cheap or expensive.
IV Average (IVx) : The implied volatility displayed in the options chain, calculated similarly to the VIX. IVx values are aggregated within the 35-70 day expiration cycle.
IV Change (5 days) : The change in implied volatility over the past five trading days. This indicator provides a quick insight into the recent changes in IV.
Expected Move (Exp. Move) : The expected movement for the options expiration cycle, calculated using the price of the ATM (at-the-money) straddle, the first OTM (out-of-the-money) strangle, and the second OTM strangle.
Options Skew : The price difference between put and call options with the same expiration date. Vertical and horizontal skew indicators help understand market sentiment and potential price movements.
Visualization Tools:
Informational IVR Panel : A tabular display mode that presents the selected indicators on the chart. The panel’s placement, size, and content are customizable, including color and tooltip settings.
1 STD, Delta, and Expected Move : Visualization of fundamental classic options metrics corresponding to expirations with bell curves.
Colored Label Tooltips : Detailed tooltips above the bell curves showing options metrics for each expiration.
Adaptive Murrey Math Lines : A horizontal line system based on the principles of Murrey Math Lines, helping identify important price levels and market structures.
Expiration Lines : Displays both monthly and weekly options expirations. The indicator supports various color and style settings, as well as the regulation of the number of expirations displayed.
🟨 𝗗𝗘𝗧𝗔𝗜𝗟𝗘𝗗 𝗗𝗢𝗖𝗨𝗠𝗘𝗡𝗧𝗔𝗧𝗜𝗢𝗡 🟨
🔶 Auto-Updating Option Metrics and Curved Lines
🔹 Interpolated DELTA Curves (16,20,25,30,40)
In our indicator, the curve layer settings allow you to choose the delta value for displaying the delta curve: 16, 20, 25, 30, or even 40. The color of the curve can be customized, and you can also hide the delta curve by selecting the "-" option.
It's important to mention that we display interpolated deltas from the actual option chain of the underlying asset using the Black-Scholes model. This ensures that the 16 delta truly reflects the theoretical, but accurate, 16 delta distance. (For example, deltas shown by brokerages for individual strikes are rounded; a 0.16 delta might actually be 0.1625.)
🔹 Expected Move Curve (Exp.mv)
The expected move is the predicted dollar change in the underlying stock's price by a given option's expiration date, with 68% certainty. It is calculated using the expiration's pricing and implied volatility levels. We chose the TastyTrade method for calculating expected move, as we found it to be the most expressive.
Expected Move Calculation
Expected Move = (ATM straddle price x 0.6) + (1st OTM strangle price x 0.3) + (2nd OTM strangle price x 0.1)
For example , if stock XYZ is trading at 121 and the ATM straddle is 4.40, the 120/122 strangle is 3.46, and the 119/123 strangle is 2.66, the expected move is calculated as follows: 4.40 x 0.60 = 2.64; 3.46 x 0.30 = 1.04; 2.66 x 0.10 = 0.27; Expected move = 2.64 + 1.04 + 0.27 = ±3.9
In this example below, the TastyTrade platform indicates the expected move on the option chain with a brown color, and the exact value is displayed behind the ± symbol for each expiration. By default, we also use brown for this indication, but this can be changed or the curve display can be turned off.
🔹 Standard Deviation Curve (1 STD)
One standard deviation of a stock encompasses approximately 68.2% of outcomes in a distribution of occurrences based on current implied volatility.
We use the expected move formula to calculate the one standard deviation range of a stock. This calculation is based on the days-to-expiration (DTE) of our option contract, the stock price, and the implied volatility of a stock:
Calculation:
Standard Deviation = Closing Price * Implied Volatility * sqrt(Days to Expiration / 365)
According to options literature, there is a 68% probability that the underlying asset will fall within this one standard deviation range at expiration.
If the 1 STD and Exp.mv displays are both enabled, the indicator fills the area between them with a light gray color. This is because both represent probability distributions that appear as a "bell curve" when graphed, making it visually appealing.
Tip and Note:
The 1 STD line might appear jagged at times , which does not indicate a problem with the indicator. This is normal immediately after market open (e.g., during the first data refresh of the day) or if the expirations are illiquid (e.g., weekly expirations). The 1 STD value is calculated based on the aggregated IVx for the expirations, and the aggregated IVx value for weekly expirations updates less frequently due to lower trading volume. In such cases, we recommend enabling the "Only Monthly Expirations" option to smooth out the bell curve.
∑ Quant Observation:
The values of the expected move and the 1st standard deviation (1STD) will not match because they use different calculation methods, even though both are referred to as representing 68% of the underlying asset's movement in options literature. The expected move is based on direct market pricing of ATM options. The 1STD, on the other hand, uses the averaged implied volatility (IVX) for the given expiration to determine its value. Based on our experience, it is better to consider the area between the expected move and the 1STD as the true representation of the original 68% rule.
🔶 IVR Dashboard Panel Rows
🔹 IVR (IV Rank)
The Implied Volatility Rank (IVR) indicator helps options traders assess the current level of implied volatility (IV) in comparison to the past 52 weeks. IVR is a useful metric to determine whether options are relatively cheap or expensive. This can guide traders on whether to buy or sell options. We calculate IVrank, like TastyTrade does.
IVR Calculation:
IV Rank = (current IV - 52 week IV low) / (52 week IV high - 52 week IV low)
IVR Levels and Interpretations:
IVR 0-10 (Green): Very low implied volatility rank. Options might be "cheap," potentially a good time to buy options.
IVR 10-35 (White): Normal implied volatility rank. Options pricing is relatively standard.
IVR 35-50 (Orange): Almost high implied volatility rank.
IVR 50-75 (Red): Definitely high implied volatility rank. Options might be "expensive," potentially a good time to sell options for higher premiums.
IVR above 75 (Highlighted Red): Ultra high implied volatility rank. Indicates very high levels, suggesting a favorable time for selling options.
The panel refreshes automatically if the symbol is implemented. You can hide the panel or change the position and size.
🔹IVx (Implied Volatility Index)
The Implied Volatility Index (IVx) displayed in the option chain is calculated similarly to the VIX. The Cboe uses standard and weekly SPX options to measure the expected volatility of the S&P 500. A similar method is utilized to calculate IVx for each option expiration cycle.
For our purposes on the IVR Panel, we aggregate the IVx values specifically for the 35-70 day monthly expiration cycle . This aggregated value is then presented in the screener and info panel, providing a clear and concise measure of implied volatility over this period.
IVx Color coding:
IVx above 30 is displayed in orange.
IVx above 60 is displayed in red
IVx on curve:
The IVx values for each expiration can be viewed by hovering the mouse over the colored tooltip labels above the Curve.
IVx avg on IVR panel :
If the option is checked in the IVR panel settings, the IVR panel will display the average IVx values up to the optimal expiration.
Important Note:
The IVx value alone does not provide sufficient context. There are stocks that inherently exhibit high IVx values. Therefore, it is crucial to consider IVx in conjunction with the Implied Volatility Rank (IVR), which measures the IVx relative to its own historical values. This combined view helps in accurately assessing the significance of the IVx in relation to the specific stock's typical volatility behavior.
This indicator offers traders a comprehensive view of implied volatility, assisting them in making informed decisions by highlighting both the absolute and relative volatility measures.
🔹IVx 5 days change %
We are displaying the five-day change of the IV Index (IVx value). The IV Index 5-Day Change column provides quick insight into recent expansions or decreases in implied volatility over the last five trading days.
Traders who expect the value of options to decrease might view a decrease in IVX as a positive signal. Strategies such as Strangle and Ratio Spread can benefit from this decrease.
On the other hand, traders anticipating further increases in IVX will focus on the rising IVX values. Strategies like Calendar Spread or Diagonal Spread can take advantage of increasing implied volatility.
This indicator helps traders quickly assess changes in implied volatility, enabling them to make informed decisions based on their trading strategies and market expectations.
🔹 Vertical Pricing Skew
At TanukiTrade, Vertical Pricing Skew refers to the difference in pricing between put and call options with the same expiration date at the same distance (at expected move). We analyze this skew to understand market sentiment. This is the same formula used by TastyTrade for calculations.
We calculate the interpolated strike price based on the expected move , taking into account the neighboring option prices and their distances. This allows us to accurately determine whether the CALL or PUT options are more expensive.
PUT Skew (red): Put options are more expensive than call options, indicating the market expects a downward move (▽). If put options are more expensive by more than 20% at the same expected move distance, we color it lighter red.
CALL Skew (green): Call options are more expensive than put options, indicating the market expects an upward move (△). If call options are priced more than 30% higher at the examined expiration, we color it lighter green.
Vertical Skew on Curve:
The degree of vertical pricing skew for each expiration can be viewed by hovering over the points above the curve. Hover with mouse for more information.
Vertical Skew on IVR panel:
We focus on options with 35-70 days to expiration (DTE) for optimal analysis in case of vertical skew. Hover with mouse for more information.
This approach helps us gauge market expectations accurately, providing insights into potential price movements. Remember, we always evaluate the skew at the expected move using linear interpolation to determine the theoretical pricing of options.
🔹 Delta Skew 🌪️ (Twist)
We have a new metric that examines which monthly expiration indicates a "Delta Skew Twist" where the 16 delta deviates from the monthly STD. This is important because, under normal circumstances, the 16 delta is positioned between the expected move and the standard deviation (STD1) line (see Exp.mv & 1STD exact definitions above). However, if the interpolated 16 delta line exceeds the STD1 line either upwards or downwards, it represents a special case of vertical skew on the option chain.
Normal case : exp.move < delta16 < std1
Delta Skew Twist: exp.move < std1 < delta16
We indicate this with direction-specific colors (red/green) on the delta line. We also color the section of the delta curve affected by the delta skew in this case, even if you choose to display a lower delta, such as 30, instead of 16.
If "Colored Labels with Tooltips" is enabled, we also display a 🌪️ symbol in the tooltip for the expirations affected by Delta Skew.
If you have enabled the display of 'Vertical Pricing Skew' on the IVR Panel, a 🌪️ symbol will also appear next to the value of the vertical skew, and the tooltip will indicate from which expiration Delta Skew is observed.
🔹 Horizontal IVx Skew
In options pricing, it is typically expected that the implied volatility (IVx) increases for options with later expiration dates. This means that options further out in time are generally more expensive. At TanukiTrade, we refer to the phenomenon where this expectation is reversed—when the IVx decreases between two consecutive expirations—as Horizontal Skew or IVx Skew.
Horizontal IVx Skew occurs when: Front Expiry IVx < Back Expiry IVx
This scenario can create opportunities for traders who prefer diagonal or calendar strategies . Based on our experience, we categorize Horizontal Skew into two types:
Weekly Horizontal Skew:
When IVx skew is observed between two consecutive non-monthly expirations, the displayed value is the rounded-up percentage difference. On hover, the approximate location of this skew is also displayed. The precise location can be seen on this indicator.
Monthly Horizontal Skew:
When IVx skew is observed between two consecutive monthly expirations , the displayed value is the rounded-up percentage difference. On hover, the approximate location of this skew is also displayed. The precise location can be seen on our Overlay indicator.
The Monthly Vertical IVx skew is consistently more liquid than the weekly vertical IVx skew. Weekly Horizontal IVx Skew may not carry relevant information for symbols not included in the 'Weeklies & Volume Masters' preset in our Options Screener indicator.
If the options chain follows the normal IVx pattern, no skew value is displayed.
Color codes or tooltip labels above curve:
Gray - No horizontal skew;
Purple - Weekly horizontal skew;
BigBlue - Monthly horizontal skew
The display of monthly and weekly IVx skew can be toggled on or off on the IVR panel. However, if you want to disable the colored tooltips above the curve, this can only be done using the "Colored labels with tooltips" switch.
We indicate this range with colorful information bubbles above the upper STD line.
🔶 The Option Trader’s GRID System: Adaptive MurreyMath + Expiry Lines
At TanukiTrade, we utilize Enhanced MurreyMath and Expiry lines to create a dynamic grid system, unlike the basic built-in vertical grids in TradingView, which provide no insight into specific price levels or option expirations.
These grids are beneficial because they provide a structured layout, making important price levels visible on the chart. The grid automatically resizes as the underlying asset's volatility changes, helping traders identify expected movements for various option expirations.
The Option Trader’s GRID System part of this indicator can be used without limitations for all instruments . There are no type or other restrictions, and it automatically scales to fit every asset. Even if we haven't implemented the option metrics for a particular underlying asset, the GRID system will still function!
🔹 SETUP OF YOUR OPTIONS GRID SYSTEM
You can setup your new grid system in 3 easy steps!
STEP1: Hide default horizontal grid lines in TradingView
Right-click on an empty area of your chart, then select “Settings.” In the Chart settings -> Canvas -> Grid lines section, disable the display of horizontal lines to avoid distraction.
SETUP STEP2: Scaling fix
Right-click on the price scale on the right side, then select "Scale price chart only" to prevent the chart from scaling to the new horizontal lines!
STEP3: Enable Tanuki Options Grid
As a final step, make sure that both the vertical (MurreyMath) and horizontal (Expiry) lines are enabled in the Grid section of our indicator.
You are done, enjoy the new grid system!
🔹 HORIZONTAL: Enhanced MurreyMath Lines
Murrey Math lines are based on the principles observed by William Gann, renowned for his market symmetry forecasts. Gann's techniques, such as Gann Angles, have been adapted by Murrey to make them more accessible to ordinary investors. According to Murrey, markets often correct at specific price levels, and breakouts or returns to these levels can signal good entry points for trades.
At TanukiTrade, we enhance these price levels based on our experience , ensuring a clear display. We acknowledge that while MurreyMath lines aren't infallible predictions, they are useful for identifying likely price movements over a given period (e.g., one month) if the market trend aligns.
Our opinion: MurreyMath lines are not crystal balls (like no other tool). They should be used to identify that if we are trading in the right direction, the price is likely to reach the next unit step within a unit time (e.g. monthly expiration).
One unit step is the distance between Murrey Math lines, such as between the 0/8 and 1/8 lines. This interval helps identify different quadrants and is crucial for recognizing support and resistance levels.
Some option traders use Murrey Math lines to gauge the movement speed of an instrument over a unit time. A quadrant encompasses 4 unit steps.
Key levels, according to TanukiTrade, include:
Of course, the lines can be toggled on or off, and their default color can also be changed.
🔹 VERTICAL: Expiry Lines
The indicator can display monthly and weekly expirations as dashed lines, with customizable colors. Weekly expirations will always appear in a lighter shade compared to monthly expirations.
Monthly Expiry Lines:
You can turn off the lines indicating monthly expirations, or set the direction (past/future/both) and the number of lines to be drawn.
Weekly Expiry Lines:
You can display weekly expirations pointing to the future. You can also turn them off or specify how many weeks ahead the lines should be drawn.
Of course, the lines can be toggled on or off, and their default color can also be changed.
TIP: Hide default vertical grid lines in TradingView
Right-click on an empty area of your chart, then select “Settings.” In the Chart settings -> Canvas -> Grid lines section, disable the display of vertical lines to avoid distraction. Same, like steps above at MurreyMath lines.
🔶 ADDITIONAL IMPORTANT COMMENTS
- U.S. market only:
Since we only deal with liquid option chains: this option indicator only works for the USA options market and do not include future contracts; we have implemented each selected symbol individually.
- Why is there a slight difference between the displayed data and my live brokerage data? There are two reasons for this, and one is beyond our control.
- Brokerage Calculation Differences:
Every brokerage has slight differences in how they calculate metrics like IV and IVx. If you open three windows for TOS, TastyTrade, and IBKR side by side, you will notice that the values are minimally different. We had to choose a standard, so we use the formulas and mathematical models described by TastyTrade when analyzing the options chain and drawing conclusions.
- Option-data update frequency:
According to TradingView's regulations and guidelines, we can update external data a maximum of 5 times per day. We strive to use these updates in the most optimal way:
(1st update) 15 minutes after U.S. market open
(2nd, 3rd, 4th updates) 1.5–3 hours during U.S. market open hours
(5th update) 10 minutes before market close.
You don’t need to refresh your window, our last refreshed data-pack is always automatically applied to your indicator , and you can see the time elapsed since the last update at the bottom of your indicator.
- Skewed Curves:
The delta, expected move, and standard deviation curves also appear relevantly on a daily or intraday timeframe. Data loss is experienced above a daily timeframe: this is a TradingView limitation.
- Weekly illiquid expiries:
Especially for instruments where weekly options are illiquid: the weekly expiration STD1 data is not relevant. In these cases, we recommend checking in the "Display only Monthly labels" checkbox to avoid displaying not relevant weekly options expirations.
-Timeframe Issues:
Our option indicator visualizes relevant data on a daily resolution. If you see strange or incorrect data (e.g., when the options data was last updated), always switch to a daily (1D) timeframe. If you still see strange data, please contact us.
Disclaimer:
Our option indicator uses approximately 15min-3 hour delayed option market snapshot data to calculate the main option metrics. Exact realtime option contract prices are never displayed; only derived metrics and interpolated delta are shown to ensure accurate and consistent visualization. Due to the above, this indicator can only be used for decision support; exclusive decisions cannot be made based on this indicator . We reserve the right to make errors.This indicator is designed for options traders who understand what they are doing. It assumes that they are familiar with options and can make well-informed, independent decisions. We work with public data and are not a data provider; therefore, we do not bear any financial or other liability.
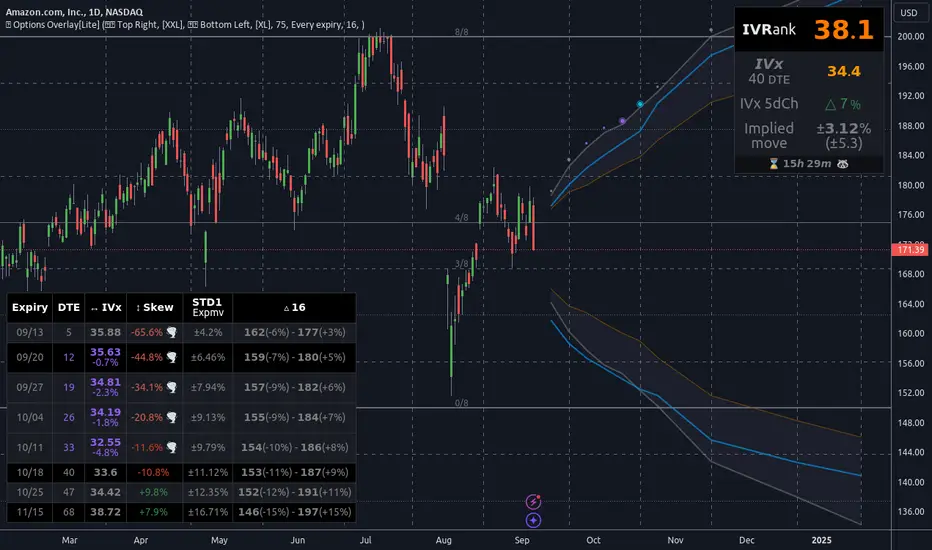
IV Rank Oscillator by dinvestorqShort Title: IVR OscSlg
Description:
The IV Rank Oscillator is a custom indicator designed to measure and visualize the Implied Volatility (IV) Rank using Historical Volatility (HV) as a proxy. This indicator helps traders determine whether the current volatility level is relatively high or low compared to its historical levels over a specified period.
Key Features :
Historical Volatility (HV) Calculation: Computes the historical volatility based on the standard deviation of logarithmic returns over a user-defined period.
IV Rank Calculation: Normalizes the current HV within the range of the highest and lowest HV values over the past 252 periods (approximately one year) to generate the IV Rank.
IV Rank Visualization: Plots the IV Rank, along with reference lines at 50 (midline), 80 (overbought), and 20 (oversold), making it easy to interpret the relative volatility levels.
Historical Volatility Plot: Optionally plots the Historical Volatility for additional reference.
Usage:
IV Rank : Use the IV Rank to assess the relative level of volatility. High IV Rank values (close to 100) indicate that the current volatility is high relative to its historical range, while low IV Rank values (close to 0) indicate low relative volatility.
Reference Lines: The overbought (80) and oversold (20) lines help identify extreme volatility conditions, aiding in trading decisions.
Example Use Case:
A trader can use the IV Rank Oscillator to identify potential entry and exit points based on the volatility conditions. For instance, a high IV Rank may suggest a period of high market uncertainty, which could be a signal for options traders to consider strategies like selling premium. Conversely, a low IV Rank might indicate a more stable market condition.
Parameters:
HV Calculation Length: Adjustable period length for the historical volatility calculation (default: 20 periods).
This indicator is a powerful tool for options traders, volatility analysts, and any market participant looking to gauge market conditions based on historical volatility patterns.
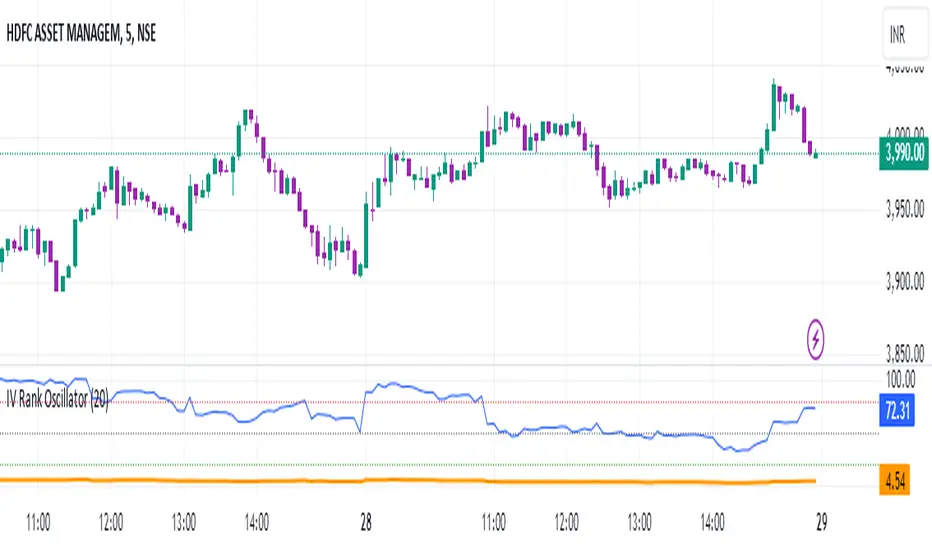
NSE Option Chain
This Indicator show Options Data on signal dashboard , that help trader to analyse the market.
Options data consist of two things , Call and Put.
Every Strike has its Call and Put price.
So if user Opens any chart which is traded in options , dashboard will show total 16 Call and 16 Put strikes
8 Above from ATM and 8 Below from ATM.
On left hand side of dashboard there is Call data and on right side there is Put data.
Call side datas are , Call LTP which is latest price of that call strike , Call Chg which is change in points from previous day close and third is Call % which is % change from previous day close.
Same is on put side.
Color code is done based on positive or negative of data. If change or % is negative then color is red else green.
ATM strike data is plotted in bold
Inputs :
Spot Symbol Input for Option dashboard
Expiry date of that option contract
Strike interval between 2 strikes
Reference ATM strike ( user should keep this input as current ATM strike )
How to Use :
If dashboard shows call side is negative and put side is positive then that means market Bearish , because falling market leads to falling price of call and increase in price of Put.
Similarly if put is negative and call is positive then market is bullish.
This dashboard give trend conformation , trader should take other conformation also before taking trade.

SPX IB Intraday Real TimeThis indicator was designed for traders doing Iron Butterflies intradays with the SPX.
Draw and assemble the picture of an IB with the call and put wings chosen according to the selected configuration. Additionally, it shows both breakevens according to the credit obtained.
The indicator shows the distance, in real time, between the current price of the SPX and the breakevens (calls and puts) that have been selected. This result is shown in percentages and points. In the upper right corner (for calls) and lower right (for puts). The label will change color as the price moves closer or further away from the breakevens.
Setting:
Open Time (Hour): IB opening time.
Open Time (Minute): IB opening minutes.
Open Price: Strike to which the center or body of the IB was opened.
Auto Price Open: If enabled, it will take the strike at the price closest to the SPX.
Wings Width: width of the IB wings.
Credit: Refers to the credit obtained according to the IB that was opened.
Shows Breakeven: Shows breakeven points at expiration based on credit earned.
Add SMAs: Adds the SMAs 8, 20 and 50 to the chart.
Note 1: It is recommended to use TradingView's Dark Theme Color.
Note 2: this indicator will only work in intraday times of less than 30 minutes (1m,2m,5m,10m,15m,30m) and will only show results while the market is open, that is, in real time.
************************************
Spanish Version:
Este indicador fue diseñado para los traders que hacen intradías de Iron Butterflies con el SPX.
Dibuja y arma el cuadro de un IB con las alas call y puts elegidas de acuerdo a la configuración seleccionada. Además, muestra ambos breakevens según el crédito obtenido.
El indicador muestra la distancia, en tiempo real, entre el actual precio del SPX y los breakevens (calls y puts) que se hayan seleccionado. Este resultado se muestra en porcentajes y en puntos. En la esquina superior derecha (para los calls) e inferior derecha (para los puts). El label cambiará de color a medida que el precio se acerque o aleje de los breakevens.
Configuración:
Open Time (Hour): Hora de apertura del IB.
Open Time (Minute): Minutos de apertura del IB.
Open Price: Strike al que se abrió el centro o cuerpo del IB.
Auto Price Open: Si se encuentra habilitado tomará el strike al precio más cercano al SPX.
Wings Width: ancho de las alas del IB.
Credit: Se refiere al crédito obtenido según el IB que se abrió.
Shows Breakeven: Muestra los puntos de breakeven en la expiración según el crédito obtenido.
Add SMAs: Agrega al cuadro las SMA 8, 20 y 50.
Nota 1: se recomienda usar el Dark Theme Color de TradingView.
Nota 2: este indicador solo funcionará en temporalidades intradías menores a 30 minutos (1m,2m,5m,10m,15m,30m) y solo mostrará resultados mientras el mercado esté abierto, o sea en tiempo real.
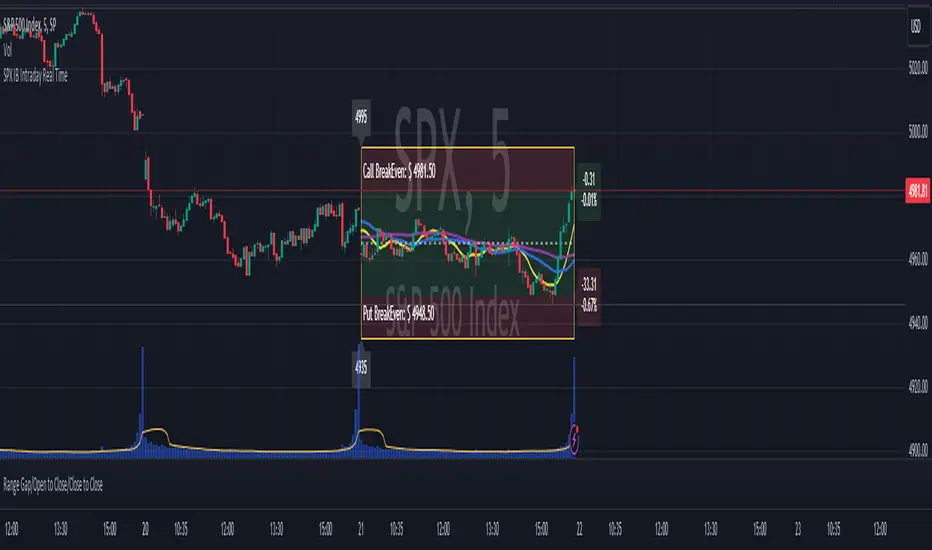
[BCT] Option Pricing via Markov Chain Monte Carlo SimulationOverview:
This script offers a toolkit for quantitative options trading, using Monte Carlo simulations based on actual historical returns to model potential future price paths for underlying assets. A range of metrics related to options trading are also provided.
Monte Carlo Simulations:
The script employs Monte Carlo simulations to model future price paths based on the historical returns of the underlying asset. These simulated paths are represented as parabolas at the 2-sigma, 25th percentile, and median levels for quick reference.
Methodologies:
For calculating options prices at At-the-Money (or any user-selected strike), two methodologies are used:
Simple Averaging: Takes the mean of the simulated asset price paths.
Kernel Density Estimation (KDE): Applied to the simulated asset price paths to produce a smoothed estimate of its probability density function, thereby aiding in a more nuanced option price calculation.
Bootstrap Resampling:
Bootstrap resampling is specifically applied to the simulated asset price paths to generate an estimate of the standard deviation of the options prices. Note that while bootstrap methods are employed, they serve as statistical tools and do not guarantee statistical reliability.
Metrics Displayed:
Model-Estimated At-the-Money (or selected strike) Straddle Price
Model-Estimated At-the-Money (or selected strike) Call Price
Model-Estimated At-the-Money (or selected strike) Put Price
Model-Estimated Standard deviation for Option Prices from simulated price paths
Underlying Monte Carlo Simulation Results (represented as parabolas at the 2 sigma, 25 percentile and median)
This is not financial advice. Use at your own risk.
Disclaimer: Options trading carries a high level of risk and may not be suitable for all investors. This script is intended to serve as an educational tool and should not be considered financial advice. While designed to aid in decision-making, the script's indicators are not guarantees of performance or outcomes. Always conduct your own due diligence before making trading decisions.

Supertrend x4 w/ Cloud FillSuperTrend is one of the most common ATR based trailing stop indicators.
The average true range (ATR) plays an important role in 'Supertrend' as the indicator uses ATR to calculate its value. The ATR indicator signals the degree of price volatility. In this version you can change the ATR calculation method from the settings. Default method is RMA, when the alternative method is SMA.
The indicator is easy to use and gives an accurate reading about an ongoing trend. It is constructed with two parameters, namely period and multiplier.
The implementation of 4 supertrends and cloud fills allows for a better overall picture of the higher and lower timeframe trend one is trading a particular security in.
The default values used while constructing a supertrend indicator is 10 for average true range or trading period.
The key aspect what differentiates this indicator is the Multiplier. The multiplier is based on how much bigger of a range you want to capture. In our case by default, it starts with 2.636 and 3.336 for Set 1 & Set 2 respectively giving a narrow band range or Short Term (ST) timeframe visual. On the other hand, the multipliers for Set 3 & Set 4 goes up to 9.736 and 8.536 for the multiplier respectively giving a large band range or Long Term (LT) timeframe visual.
A ‘Supertrend’ indicator can be used on equities, futures or forex, or even crypto markets and also on minutes, hourly, daily, and weekly charts as well, but generally, it fails in a sideways-moving market. That's why with this implementation it enables one to stay out of the market if they choose to do so when the market is ranging.
This Supertrend indicator is modelled around trends and areas of interest versus buy and sell signals. Therefore, to better understand this indicator, one must calibrate it to one's need first, which means day trader (shorter timeframe) vs swing trader (longer time frame), and then understand how it can be utilized to improve your entries, exits, risk and position sizing.
Example:
In this chart shown above using SPX500:OANDA, 15R Time Frame, we can see that there is at any give time 1 to 4 clouds/bands of Supertrends. These four are called Set 1, Set 2, Set 3 and Set 4 in the indicator. Set's 1 & 2 are considered short term, whereas Set's 3 & 4 are considered long term. The term short and long are subjective based on one's trading style. For instance, if a person is a 1min chart trader, which would be short term, to get an idea of the trend you would have to look at a longer time frame like a 5min for instance. Similarly, in this cases the timeframes = Multiplier value that you set.
Optional Ideas:
+ Apply some basic EMA/SMA indicator script of your choice for easier understanding of the trend or to allow smooth transition to using this indicator.
+ Split the chart into two vertical layouts and applying this same script coupled with xdecow's 2 WWV candle painting script on both the layouts. Now you can use the left side of the chart to show all bearish move candles only (make the bullish candles transparent) and do the opposite for the right side of the chart. This way you enhance focus to just stick to one side at a given time.
Credits:
This indicator is a derivative of the fine work done originally by KivancOzbilgic
Here is the source to his original indicator: ).
Disclaimer:
This indicator and tip is for educational and entertainment purposes only. This not does constitute to financial advice of any sort.

MeanReversion - LogReturn/Vola ZScoreShows the z-Score of log-return (blue line) and volatility (black line). In statistics, the z-score is the number of standard deviations by which a value of a raw score is above or below the mean value.
This indicator aggregates z-score based on two indicators:
MeanReversion by Logarithmic Returns
MeanReversion by Volatility
Change the time period in bars for longer or shorter time frames. At a daily chart 252 mean on trading year, 21 mean one trading month.

Option ScalperWhat is Scalping?
Scalping is a trading strategy aimed at profiting from quick momentum in a volatile index or stock or any other instrument that can be traded.
Traders who use such strategies place anywhere from 10 to a few hundred trades in a single day.
The idea behind such type of trading is that small moves in an index or stock price are much easier to capture than the larger moves.
Traders who use such strategies are known as scalpers. When you take many small profits a number of times, say 10 points scalped 20 times per day, they can easily add up to large gains.
An Option Buyer's Biggest Enemy is Time Decay and when you scalp, you do not allow the time decay to eat your Option Premium as your Entry and Exit is often quick enough.
What is Option Scalper?
Option Scalper indicator is a momentum-based indicator that tries to detect momentum based upon a number of factors as given below:
(1) Price action accumulated over a period of time when big candles are nowhere
(2) Repeatedly Occurring, certain Candle patterns which indicate if buyers have the upper hand or sellers are ruling the market.
(3) Gradient of moving averages which shows consistency of net buying/selling force
(4) Price jumping normal distribution line and landing in outlying areas, signalling increasing momentum of buying/selling activity.
Based upon the above factors, when Option Scalper thinks a move has the potential to turn into a big move, it generates its Buy/Sell Signals.
When aggressive buying or selling starts where Buying & Selling Forces become unequal, the Price starts moving in one direction with candles making Higher Highs or Lower Lows, moving average lines start scaling up or down or volumes start increasing.
Option Scalper detects these (1) Higher Highs or Lower Lows, (2) scaling up moving average lines, and/or (3) price breaking out of channels; and generates Buy or Sell signals.
In order to use this indicator, simply deploy this on your chart, and wait for Buy/Sell signals. When a Buy/Sell Signal appears, a small line starts forming up at the closing level of Buy/Sell signal candle. Your Entry will be above that line for Buy Signal and below that line for Sell Signal.
It works on all time frames.
Whenever a Buy Signal is followed by Sell signal (let it be after 7 - 8 candles or after many candles) or vice-versa, you have to switch your position to make most of the reverse move.
It is a general purpose indicator and may be used on stocks, commodities, forex and any other instruments alike and is not meant for any specific market.
How to Take Buy/Sell Entry with Option Scalper?
Whenever a Buy/Sell Signal appears on a candle, Option Scalper starts marking its closing price with a horizontal line that keeps extending towards right side with every new candle. This line is Blue in Color for Buy Signal and dark golden color for Sell Signal.
Initially this horizontal line will be very small but as more and more candles appear with the passage of time, the length of the line keeps increasing.
The purpose of this line is to mark the closing price of Signal candle and you have to take your Buy Entry above this line (if last signal is BUY) or you have to take your trade Below this line (if last signal is SELL).
The indicator will also draw another line at the Opening Price of Signal Candle, which can act as your initial stop loss. If trade starts moving in your direction and price goes above upper variance line (light green curvy line) or goes below lower variance line (purple wavy line), then that line becomes your trailing stop loss line from that point onwards.
The indicator also marks the consolidation zone for you. If the Buy/Sell Signal has come but price is in consolidation zone (grey colour cloud), do not take any positions yet and wait for the price to come out of the cloud and breach the Entry Line.
Exiting Buy/Sell Positions and Re-Entry Rules
1. Exiting your Buy Trade: When a Buy Trade is active, indicator can detect where the ongoing upmove may end or retrace for a while and it will print an X symbol (RED COLOR) to warn you. After you see a Red Color X symbol, if price starts making lower lows, you can exit your Buy Trade there or if you are in good profit, you can wait for the price to go below upper variance line (the green color Trailing Stop Loss Line for Buy Trade). See the image below for Red Color X symbol which warns you to be prepared for EXIT from Buy Trade:
2. Re-Entry for Buy Trade: If the last signal on your chart is still Buy Signal but your stop loss has been hit once or twice and you have no open positions now, you can RE-ENTER in buy trade if and when price again climbs above the grey cloud.
3. Exiting your Sell Trade: When a Sell Trade is active, indicator can detect where the ongoing down-move may end or retrace for a while and it will print an X symbol (Green COLOR) to warn you. After you see a Green Color X symbol, if price starts making higher highs, you can exit your Sell Trade there or if you are in good profit, you can wait for the price to go above lower variance line (the purple color Trailing Stop Loss Line for Sell Trade).
4. Re-Entry for Sell Trade: If the last signal on your chart is Sell Signal but your stop loss has been hit once or twice and you have no open positions now, you can RE-ENTER in Sell trade if and when price again crosses below the grey color cloud.
See the image below for recognizing Red and Green X symbols which indicate that temporary retracement or reversal signal is developing:
What are the other features of Option Scalper?
1. End to End Horizontal Support/Resistance Lines: Indicator also detects, prints and deletes horizontal support and resistance lines which can help in your trading decisions. For example, a Buy Signal comes and price crosses above upper variance line and also crosses nearby horizontal resistance line means it has higher probability of moving further up. The reverse is also true (for Sell Signal). See an example of a resistance line below:
2. Star Symbols: If 5 or more consecutive candles are of the same color, then Star Symbol (*) starts appearing above or below the candles. When price has moved too high or too low from the upper or lower variance line, these stars indicate that there is higher probability of retracement happening now which should prompt you to book full or partial profit. See the circled stars in the below image
3. Color Changing Candles: If a candle changes its color from Red to Purple or from Green to light green, they indicate increased intensity of Selling or Buying activity. For example, if each 1 min candle within a 5 min candle is red, then that 5 min candle will turn purple which means Selling pressure is too much and there are very few or no buyers at all. Reverse is also true when Green Candle becomes Light Green. Example images of such candles can be seen below:
4. Consolidation Zone: It is very important for an option buyer to strike only when there is momentum and not to take any fresh trade (or if you already have a position, then closing it for the time being) when price is in consolidation zone. Consolidation zone is marked by a grey colour cloud as seen in below image.
What Type of Alerts Can be Set up: You can set up 3 type of alerts with this indicator (a) Buy Entry Signal which happens when Price closes above the marked Buy Price Level (b) Sell Signal which happens when Price closes below the marked Sell Price Level or (c) Any signal (if you want to be alerted when either Buy or Sell Signal happens)
How to get this indicator?
This is invite-only indicator. Get in touch with us using information given below in Signature field to try this indicator FREE. You may also chat with us through Private Chat feature of TradingView.

Options Price CalculatorIn the team, we continue to explore and expand the boundaries of TradingView.
For now, there is not much an options trader can do with options in TradingView.
We wanted to change that and created a simple option pricer.
You can set up in parameters a set of strikes, implied volatility, and days to expiry.
The indicators will take a risk-free rate from US01Y and the underlying price from your current chart.
It will compute prices and greeks for both put and call options.
Thanks to @MUQWISHI for helping code it.
Disclaimer
Please remember that past performance may not indicate future results.
Due to various factors, including changing market conditions, the strategy may no longer perform as well as in historical backtesting.
This post and the script don’t provide any financial advice.
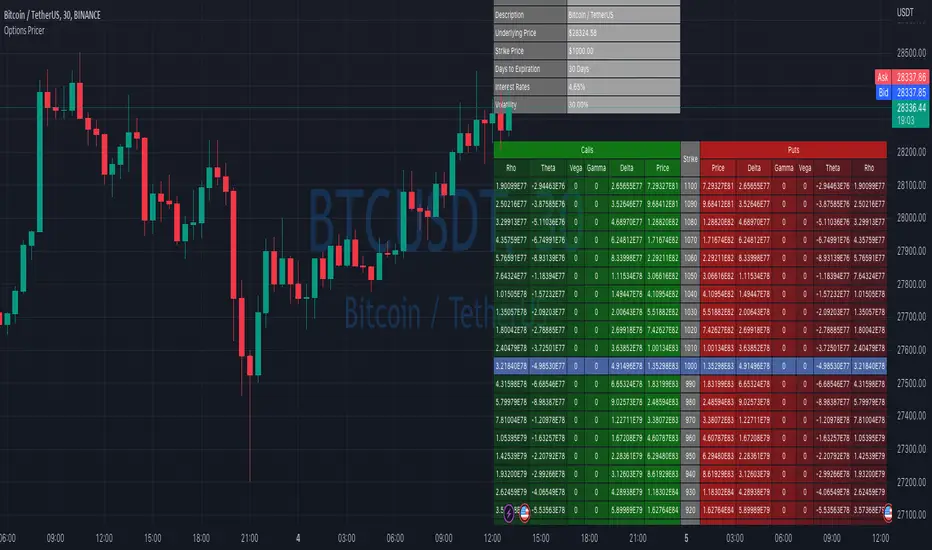
VolatilityCone by ImpliedVolatilityThis volatility cone draws the implied volatility as standard deviations from a measurement date.
For best results set measurement date to high volume bars.
How to use:
1) Select VolatilityCone from Indicators
2) Click to the chart to set the measurement date
3) Determine the impliedvolatility for the measurement date of your symbol
e.g.
For S&P500 use VIX value at measurement date for implied volatility
