Key Time Window & Kill Zones
📌 Key Time Window & Kill Zones
This indicator highlights important global trading sessions and high-probability execution windows using fixed UTC (GMT+0) timings, which align correctly with IST and all other time zones through TradingView’s internal time conversion.
It is designed to help traders focus on institutional activity periods, avoid low-probability hours, and execute trades only during statistically active market windows for Crypto, Forex And US markets.
________________________________________
⏱️ Session Timings (All in UTC / GMT+0)
Asia Range — 22:00 – 05:00 (Red) ( NO TRADING ZONE)
• Marks the Asian session consolidation range
• Useful for identifying liquidity highs and lows
• Acts as reference for London and New York liquidity sweeps
________________________________________
Frankfurt Trap Time — 07:00 – 08:00 (Grey) ( NO TRADING ZONE)
• Commonly produces false breakouts and stop-hunts
• No-trade zone
• Used only to observe potential liquidity traps before London open
________________________________________
London Kill Zone — 08:00 – 09:00 (Blue) (TRADING ZONE)
• High-volatility window at London open
• Trades are valid only after Frankfurt liquidity is swept
• Suitable for smart-money entries following manipulation
________________________________________
New York Range — 13:00 – 17:00 (Purple)
• Defines the broader New York session range
• Tradeable only when market structure is trending
• Provides context for NY session price development
________________________________________
New York Kill Zone (Key Time Window) — 14:00 – 15:00 (Deep Purple) ( KEY TIME WINDOW- TRADING WINDOW)
• Primary execution window
• Best setups form after London or NY open inducement
• Suitable for both reversals and continuations
________________________________________
NYSE Cash Open — 14:30 – 14:45 (Dark Purple) ( AVOID NEW ENTRIES IN THIS ZONE)
• Exact US cash market opening window
• Increased volatility and decisive price moves
• One of the most important intraday execution periods
________________________________________
🧠 How to Use
• Use session zones as time-based confirmation, not standalone signals
• Combine with:
o Market structure
o Liquidity sweeps
o Inducement
o Order blocks / supply & demand
• Avoid trading outside the highlighted sessions
• Best suited for intraday and scalping strategies
________________________________________
⚠️ Important Notes
• All sessions are plotted in UTC (GMT+0)
• Automatically adjust to the user’s chart time zone (including IST)
• This indicator does not generate buy or sell signals
• Intended for educational and analytical purposes only
________________________________________
BONUS
Two Extra Options To mark your Special Time Zones If you Want.
Nasdaq

KINETIC GOLD NQ Velocity Breakout [Ash_TheTrader]🚀 Stop Guessing. Start Scalping with Physics.
Introducing the KINETIC GOLD NQ ⚡ VELOCITY BREAKOUT System
Author: Ash_TheTrader
Assets: Gold (XAUUSD), Nasdaq (US100), Bitcoin (BTC)
Style: High-Frequency Scalping (M1/M5)
---
🛑 The Problem: Why Most Indicators Fail
You’ve been there. The RSI says "Oversold," so you buy. But price keeps crashing. The Moving Average crosses over, so you enter. But the trend is already over.
Why? Because those indicators are lagging . They tell you what happened 10 candles ago.
⚡ The Solution: The "Physics" of Price
Markets move like objects in the real world. They have Velocity (Speed) and Momentum (Mass).
The Kinetic Velocity Breakout (KMB) system doesn't look at "Overbought" or "Oversold." It looks for FORCE .
It answers one simple question: Is the market moving fast enough to pay me?
---
🧠 The 4 "Smart Logic" Features
1. The Velocity Speedometer 🏎️
Most candles are "noise." This system ignores them. It uses a Normalized Volatility Engine to detect when price hits "WARP SPEED".
• Blue: Slow (Cruising). Don't touch.
• Yellow: Accelerating. Get ready.
• Red: WARP SPEED. Institutional money is entering.
2. The 1.5x Impulse Rule 💥
The algorithm strictly enforces the "1.5x Law." A signal ONLY fires if the breakout candle is 1.5 times larger than the average of the last 3 candles.
• Result? No more fakeouts. We only trade real expansions.
3. "Smart Mode" AI Dashboard 🖥️
A heads-up display (HUD) lives on your chart, auto-detecting your trading environment:
• Auto-Session: Tells you if you are in London, New York, or Asia.
• Risk Mode: Shows if you are using "Aggressive" or "Normal" logic.
• Status: Gives you a text readout like "READY ⚡" or "WAIT..."
4. Auto-Pilot Risk Management 🛡️
Scalping is fast. You don't have time to calculate Pips.
• The script draws the lines for you.
• As soon as a "ROCKET" signal appears, a Green TP Line (2x Reward) and Red SL Line appear instantly.
---
🎮 How to Trade: The 3-Step "Kinetic" Strategy
This strategy is designed for Gold (XAUUSD) and Nasdaq (US100) on the 5-Minute Timeframe .
Step 1: The "Yellow" Warning ⚠️
Watch the Smart Structure Lines (Dashed Lines).
• If the candles turn Yellow or the Dashboard says "FAST" , wake up.
• This means pressure is building against a key level.
Step 2: The "Warp" Trigger 🚀
Wait for a Confirmed Breakout . You are looking for:
1. A candle closes OUTSIDE the dashed structure line.
2. The candle color is NEON CYAN (Bullish) or NEON MAGENTA (Bearish).
3. The Signal Label appears: "ROCKET" (Buy) or "DROP" (Sell).
👉 Rule: No Label? No Trade. The 1.5x Logic saves you from bad trades.
Step 3: The Execution 💰
1. Enter at the close of the signal candle.
2. Stop Loss: Place it exactly on the Red Line provided by the indicator.
3. Take Profit: Place it on the Green Line .
4. Walk away. Let the physics work.
---
⚙️ Customizing Your Style
The script comes with two built-in "Personalities":
🛡️ Normal Scalper (Default)
• Best for: New traders, Funded Accounts.
• Logic: Waits for strong confirmation. High Win Rate.
• Risk: 1:2 Risk/Reward.
⚠️ QuickScalper (Aggressive)
• Best for: Gold M1, Volatility Hunters.
• Logic: Enters earlier on 1.2x Impulse. More signals, faster exits.
• Risk: 1:1.5 Risk/Reward (Grab the cash and go).
---
👇 Get the Code
Search for: KINETIC ⚡ in the TradingView library.
"Markets are physics. Trade the Velocity, not the noise." — Ash_TheTrader

AlgoIndex NQ/MNQ FuturesAlgoIndex Futures v3.15 - NQ/MNQ (10-Minute RTH)
This strategy is specifically tailored for trading CME Nasdaq futures - NQ and MNQ, including continuous symbols such as NQ1!/MNQ1!. It is optimized for a 10-minute chart during U.S. Regular Trading Hours (RTH), utilizing session settings defined in the Inputs. This strategy is not intended for other futures contracts or markets.
Core Concept
The strategy employs an ATR-based trend-band model similar to Supertrend for identifying directional mechanism changes in NQ/MNQ. Trade signals are evaluated at the bar close, incorporating session and time-based safety techniques to mitigate lower-quality trading opportunities near session boundaries.
Recommended Use (Optimized Defaults)
The default input parameters are fine-tuned for NQ/MNQ on the 10-minute chart. Users are encouraged to utilize these defaults initially and to make incremental adjustments to one variable at a time to understand the impact on the strategy's performance, trading frequency, and risk profile.
Configurable Inputs
- Take Profit / Stop Loss Settings:
- Enable Stop Loss and define Stop Loss (Points)
- Enable Take Profit and define Take Profit (Points)
- Enable Trailing Stop and set both Trailing Stop (Points) and Trailing Offset (Points)
- Time Avoidance Filter:
- Enable Time Avoidance
- Avoid First X Minutes
- Avoid Last X Minutes
- Display Avoidance Zones (visual overlay)
- Session Filter and End-of-Day Management:
- Enable Session Filter
- Define Trading Session (default: 09:30-16:00)
- Select Session Timezone
- Option to Close Positions at Session End
- Specify EOD Close Minutes Before (default: 20)
- Safety Controls:
- Option to Close Before Holidays (when enabled, this feature allows the strategy to flatten positions prior to holiday or early close conditions)
- Automation Settings (Optional):
- Ticker Override (optional)
- Define Contracts (position size)
- Strategy Configuration:
- Trade Direction: Both / Long Only / Short Only
- Visual Configuration:
- Option to Show Buy/Sell Signals
- Highlight Trend Zones
- Display Info Table
- Customizable Bull/Bear Colors
Alerts and Automation (Optional)
This strategy can generate order-fill alert payloads for hooking into webhook-based automation solutions. Keep in mind to validate your alert type and your bridge/broker configuration during Replay and paper trading. Note that reversals may trigger two sequential actions (e.g., exit followed by new entry).
Backtest Notes (Optional)
For more precise historical fill data, consider enabling TradingView’s Bar Magnifier in Strategy Properties. Always apply consistent assumptions for commission and slippage when comparing backtest results.
Disclaimer
This script is intended for informational and educational purposes only and does not constitute investment advice. Trading futures carries significant risk and may result in losses that exceed the initial deposit. Backtested results are hypothetical and do not guarantee future performance.

Forexsebi - NASDAQ Psychological Levels - TrendflowTrendflow is an advanced TradingView indicator combining psychological price levels with trend and multi-timeframe analysis.
The indicator automatically plots psychological levels in around the current price. Each level is visualized using horizontal lines and price zones (boxes) to clearly highlight potential support and resistance areas.
Psychological Levels – Trendflow ist ein fortschrittlicher TradingView-Indikator , der wichtige psychologische Preislevel mit einer klaren Trend- und Multi-Timeframe-Analyse kombiniert.
Trend Analysis with SMAs
SMA 50 & SMA 200 plotted directly on the chart
Individually toggleable
Clear color separation for fast trend recognition
Multi-Timeframe SMA Trend Table
Trend status (BULLISH / BEARISH / NEUTRAL) across:
5M, 15M, 1H, 4H, 1D
Logic: Price relative to SMA 50 & SMA 200
Color-coded, easy-to-read table
Info Box
Current Gold price
Nearest psychological level above and below price
Alert System
Alerts when price approaches a psychological level
User-defined alert distance

Bayesian Order Flow Predictor📌 Bayesian Order Flow Predictor — Advanced Probability Engine for Nasdaq and Futures
This indicator is a next-generation probabilistic forecasting system designed for Nasdaq traders who rely on Order Flow, Auction Market Theory, Value Area dynamics, market structure, DOM imbalance, and Bayesian probability models.
It combines 7 professional-grade factors (DOM, CVD, RSI, EMA trend, ATR volatility, Market Structure, Value Area positioning) into a unified Bayesian probability panel that outputs a clean bullish/bearish probability curve with high-confidence reversal and trend-continuation signals.
Engineered for scalpers, day traders, futures traders, and ICT-style order flow technicians, it delivers real-time directional probability, session-aware signals, and optional news-filter exclusion.
⭐ Features
Bayesian Probability Model (0–100%)
DOM imbalance scoring across dynamic depth levels
Cumulative Volume Delta (CVD) scoring
Market structure detection (HH/LL micro-trend shifts)
RSI momentum and overbought/oversold scoring
EMA directional bias + ATR-normalized deviation
Value Area positioning (VAH / VAL / POC) with optional previous-session mode
Session filtering (only signals during active hours)
Automated news filter (exclude signals around scheduled macro events)
Bull/Bear probability zones with background coloring
Anti-repetition system (no double signals in same direction)
Designed for future scalping, futures order flow, and high-precision timing
🧠 Bayesian Probability Engine — How It Works
The model evaluates 7 independent market factors simultaneously:
DOM imbalance
CVD pressure
Market structure
RSI deviation
EMA trend
Value Area position
ATR volatility shift
Each factor is transformed into a normalized score, multiplied by its weighting parameter, and aggregated into a global score.
This score is then passed through a Bayesian logistic function to convert uncertainty into a smooth probability curve, giving traders a clean, mathematically stable, and noise-resistant forecast.
📈 Buy & Sell Signal Logic
Signals trigger when:
Bullish Probability crosses above the user threshold
Bearish Probability crosses below the opposite threshold
Session is active
No protected news event is occurring
This avoids noise, prevents over-signaling, and focuses only on high-confidence inflection points.
🎯Fully compatible with the indicator: ➡️ AI Probabilistic Orderflow scalper
Both indicators synchronize perfectly when used together:
Bayesian panel → trend probability
Scalper v1 → timing + TP/SL engine
Together they create a complete probability-driven revenue management system for scalping Future.
📘 How to Use
Add the indicator to your chart
Set your trading session (e.g., 09:30–16:00 EST)
Adjust weights depending on your style (Order Flow / Momentum / Value Area)
Watch the probability curve:
Above threshold → bullish bias
Below threshold → bearish bias
Take signals when the curve crosses thresholds, not when flat
Combine with "AI Probabilistic Orderflow scalper" indicator for execution timing
Avoid high-impact news using the News Filter
💎 Advantages
Professional-grade Bayesian model
Works in all volatility regimes
Noise-resistant and smoother than traditional oscillators
Integrates Order Flow + Auction Theory + Momentum + Volatility
Perfect for NQ scalpers seeking an AI-style probability dashboard
Reduces emotional decision-making
Compatible with any execution strategy
Optimized for high winrate scalping and sniper entries

AI Probabilistic OrderFlow Scalper⭐ Main Name
AI Probabilistic OrderFlow Scalper
⭐Description:
📌 AI Probabilistic OrderFlow Scalper — Predictive Auction Theory Model for Futures
This script combines Order Flow, Auction Market Theory, Volume Imbalance, Market Structure (HH/LL), RSI bias filtering, and a probability-based direction model inspired by AI and Revenue Management.
It produces high-precision scalping entries designed for fast markets such as Nasdaq Futures (NQ), while remaining compatible with all markets (indices, crypto, forex, metals).
This is not a typical indicator — it is a probabilistic predictive model engineered to provide sniper entries, a tick-based Take Profit, a volatility-adaptive ATR Stop Loss, and optional Value Area levels (VAH/VAL/POC).
⭐ Main Features
🔥 Directional probability model (AI-style weighted scoring)
📊 Order Flow imbalance (delta-like logic)
📈 HH/LL market structure detection
🎯 Smart RSI bias filter
🚀 One signal per trend shift (anti-spam)
🎯 Tick-based Take Profit (perfect for NQ / futures)
🛡️ ATR-based dynamic Stop Loss
📉 Value Area display: VAH, VAL, POC
🔊 Volume confirmation filter
📡 Directional probability plot
✔️ Works for Futures, Crypto, Forex, Indices
🧠 Probabilistic AI Approach
The model uses a 3-factor scoring system:
Order Flow imbalance
Market structure (HH/LL)
RSI trend bias
Each validated condition = 1 point.
The total score is converted into Buy/Sell probabilities, and the higher-probability direction is selected.
When probability exceeds the threshold (e.g. 80%), the system triggers a high-confidence sniper signal.
This mirrors Hight probability decision:
→ Only take a decision when probability of success is maximized.
🎯 Buy/Sell Signals (Sniper Entries)
🔵 Green triangle under the candle = high-probability Buy
🔴 Red triangle above the candle = high-probability Sell
✔️ Only one signal per directional shift
✔️ Signals appear only when all strict filters are satisfied
📌 Automatic TP / SL
TP: fixed tick-based (e.g. 100 ticks for NQ scalping)
SL: ATR-based, adapts to volatility
TP/SL display can be enabled or disabled
Perfectly calibrated for high-speed scalping.
📘 How to Use
Use any timeframe
Adjust probability threshold (75–90 recommended)
Enable strict mode for maximum precision
Let the model filter entries automatically
Choose a TP suitable for your market
Optionally display VAH/VAL/POC for Auction Theory context
Always test using backtesting before going live
🏆 Advantages
Extremely fast for scalping
High win-rate potential via probabilistic filtering
Clean signals (no noise or spam)
Combines the strongest trading frameworks:
Order Flow
Market Structure
Statistical modeling
Volume profiling
Automated risk management

NY 8-11 Statistical Bias NQ 【Donkey】This indicator analyzes historical session patterns to predict directional bias during the NY 8:00-11:00 AM trading window for Micro NQ futures.
Simple Logic:
Monitors 3 sessions: Asian (20:00-02:00), London (02:00-08:00), NY (08:00-11:00)
Identifies current pattern based on: ranges, opening positions, and sweep behaviors
Searches database of 2.080 historical sessions for matching patterns
Displays statistical probability: "X% reached HIGH" vs "Y% reached LOW"
Shows expected drawdown levels for risk management
Example: If pattern shows "77% HIGH bias" → historically, 77 out of 100 similar sessions reached London high during NY 8-11 window.
Key Features
✅ Statistical Database:2.080 real sessions analyzed, 236 unique patterns
✅ 4-Level Pattern Matching: Finds best match with minimum 25 occurrences
✅ Live Bias Display: Shows HIGH% vs LOW% probability in real-time table
✅ Risk Management Zones: Visual drawdown levels (50%, 75%, 90%) + stop-loss suggestion
✅ No Repainting: Calculations made in real-time, no look-ahead bias
✅ Session Visualization: Color-coded boxes for Asian/London/NY ranges
How Pattern Matching Works
5 Components Analyzed:
Asian Range: Above/Below average
London Open: Above/Below Asian 50%
London Sweep: H, L, DH (double high→low), DL (double low→high), N (none)
London Range: Above/Below average
NY Open: Above/Below London 50%
Cascade Search (finds best available match):
Level 1: All 5 components (most specific)
Level 2: 4 components (drops London Range)
Level 3: 3 components (core pattern)
Level 4: 2 components (minimal pattern)
Validity: Only displays patterns with ≥25 historical occurrences.
Interpretation
Bias Table Shows:
Pattern match level (1-4) and historical count
Session characteristics (ranges, sweeps, positions)
TOTAL HIGH % = probability of reaching London high
TOTAL LOW % = probability of reaching London low
Bias strength: ⭐⭐⭐ STRONG (≥70%), ⭐⭐ MEDIUM (60-69%), ⭐ WEAK (<60%)
Drawdown Zones (for winning trades):
🟢 Green: 50% of winners stayed within this level
🟡 Yellow: 75% of winners stayed within this level
🟠 Orange: 90% of winners stayed within this level
🔴 Red Line: Suggested stop-loss (95th percentile + buffer)
Settings
Fully Customizable:
Timezone selection (auto-detects sessions correctly)
Minimum session threshold (default: 25)
Toggle boxes, lines, labels, drawdown zones
Complete color customization
Table size and position
Best Use Cases
✅ Optimal Setup:
Instrument: Micro NQ (MNQ) futures
Timeframe: Only 1-minute
Timezone: America/New_York
Historical data: 8+ years loaded
✅ Trading Approach:
Wait for pattern confirmation (≥25 sessions)
Prefer STRONG bias (≥70%) for higher confidence
Use drawdown zones for stop placement
Combine with price action confirmation
Avoid major news events (FOMC, NFP)
⚠️ Required Disclaimers
IMPORTANT RISK WARNINGS:
Past Performance ≠ Future Results: Historical statistics do NOT guarantee future outcomes
Not Financial Advice: Educational tool for statistical analysis only
Risk of Loss: Futures trading involves substantial risk of loss
No Guarantees: Individual trades WILL result in losses regardless of percentages shown
Requires Knowledge: Best for traders familiar with session analysis and risk management
Instrument-Specific: Optimized for Micro NQ - test before using elsewhere
Never risk more than you can afford to lose. Always use proper risk management.

NQ Scalping WMAThis indicator plots two Weighted Moving Averages (WMAs) derived from the high and close to visualize short-term momentum extremes on NQ (Nasdaq futures). I built it for myself for scalping reversals on the 1-minute timeframe.
The area between the upper WMA (“Top-Source”) and lower WMA (“Bot-Source”) is filled with contextual color: green when price is above the top WMA, red when price is below the bottom WMA, and neutral gray otherwise. This makes it easy to spot overextensions, potential snap-back zones, and quick mean-reversion opportunities. Inputs include WMA length, line color, and separate sources for top/bottom WMAs, allowing fast tuning for changing intraday volatility.
The original code I used to make this is from PlayBit EMA by FFriZz

NY VIX Channel Trend US Futures Day Trade StrategyNY VIX Channel Trend Strategy
Summary in one paragraph
Session anchored intraday strategy for index futures such as ES and NQ on one to fifteen minute charts. It acts only after the first configurable window of New York Regular Trading Hours and uses a VIX derived daily implied move to form a realistic channel from the session open. Originality comes from using a pure implied volatility yardstick as portable support and resistance, then committing in the direction of the first window close relative to the open. Add it to a clean chart and trade the simple visuals. For conservative alerts use on bar close.
Scope and intent
• Markets. Index futures ES and NQ
• Timeframes. One to thirty minutes
• Default demo. ES1 on five minutes
• Purpose. Provide a portable intraday yardstick for entries and exits without curve fitting
• Limits. This is a strategy. Orders are simulated on standard candles
Originality and usefulness
• Unique concept. A VIX only channel anchored at 09:30 New York plus a single window trend test
• Addresses. False urgency at session open and unrealistic bands from arbitrary multipliers
• Testability. Every input is visible and the channel is plotted so users can audit behavior
• Portable yardstick. Daily implied move equals VIX percent divided by square root of two hundred fifty two
• Protected status. None. Method and use are fully disclosed
Method overview in plain language
Take the daily VIX or VIX9D value, convert it to a daily fraction by dividing by square root of two hundred fifty two, then anchor a symmetric channel at the New York session open. Observe the first N minutes. If that window closes above the open the bias is long. If it closes below the open the bias is short. One trade per session. Exits occur at the channel boundary or at a bracket based on a user selected VIX factor. Positions are closed a set number of minutes before the session ends.
Base measures
Return basis. The daily implied move unit equals VIX percent divided by square root of two hundred fifty two and serves as the distance unit for targets and stops.
Components
• VIX Channel. Top, mid, bottom lines anchored at 09:30 New York. No extra multipliers
• Window Trend. Close of the first N minutes relative to the session open sets direction
• Risk Bracket. Take profit and stop loss equal to VIX unit times user factor
• Session Window. Uses the exchange time of the chart
Fusion rule
Minimum gates count equals one. The trade only arms after the window has elapsed and a direction exists. One entry per session.
Signal rule
• Long when the window close is above the session open and the window has completed
• Short when the window close is below the session open and the window has completed
• Exit on channel touch. Long exits at the top. Short exits at the bottom
• Flat thirty minutes before the session close or at the user setting
Inputs with guidance
Setup
• Use VIX9D. Width source. Typical true for fast tone or false for baseline
• Use daily OPEN. Toggle for sensitivity to overnight changes
Logic
• Window minutes. Five to one hundred twenty. Larger values delay entries and reduce whipsaw
• VIX factor for TP. Zero point five to two. Raising it widens the profit target
• VIX factor for SL. Zero point five to two. Raising it widens the stop
• Exit minutes before close. Fifteen to ninety. Raising it exits earlier
Properties visible in this publication
• Initial capital one hundred thousand USD
• Base currency USD
• request.security uses lookahead off
• Commission cash per contract two point five $ per each contract. Slippage one tick
• Default order size method FIXED with value one contract. Pyramiding zero. Process orders on close ON. Bar magnifier OFF. Recalculate after order is filled OFF. Calc on every tick ON
Realism and responsible publication
No performance claims. Past results never guarantee future outcomes. Fills and slippage vary by venue. Shapes can move while a bar forms and settle on close. Strategy uses standard candles.
Honest limitations and failure modes
Economic releases and thin liquidity can break the channel. Very quiet regimes can reduce signal contrast. Session windows follow the exchange time of the chart. If both stop and target can be hit within one bar, assume stop first for conservative reading without bar magnifier.
Works best in liquid hours of New York RTH. Very large gaps and surprise news may exceed the implied channel. Always validate on the symbols you trade.
Entries and exits
• Entry logic. After the first window, go long if the window close is above the session open, go short if below
• Exit logic. Long exits at the channel top or at the take profit or stop. Short exits at the channel bottom or at the take profit or stop. Flat before session close by the configured minutes
• Risk model. Initial stop and target based on the VIX unit times user factors. No trail and no break even. No cooldown
• Tie handling. Treat as stop first for conservative interpretation
Position sizing
Fixed size one contract per trade. Target risk per trade should generally remain near one percent of account equity. Risk is based on the daily volatility value, the max loss from the tests for one year duration with 5min chart was 4%, while the avg loss was below <1% of the total capital.
If you have any questions please let me know. Thank you for coming by !

TriAnchor Elastic Reversion US Market SPY and QQQ adaptedSummary in one paragraph
Mean-reversion strategy for liquid ETFs, index futures, large-cap equities, and major crypto on intraday to daily timeframes. It waits for three anchored VWAP stretches to become statistically extreme, aligns with bar-shape and breadth, and fades the move. Originality comes from fusing daily, weekly, and monthly AVWAP distances into a single ATR-normalized energy percentile, then gating with a robust Z-score and a session-safe gap filter.
Scope and intent
• Markets: SPY QQQ IWM NDX large caps liquid futures liquid crypto
• Timeframes: 5 min to 1 day
• Default demo: SPY on 60 min
• Purpose: fade stretched moves only when multi-anchor context and breadth agree
• Limits: strategy uses standard candles for signals and orders only
Originality and usefulness
• Unique fusion: tri-anchor AVWAP energy percentile plus robust Z of close plus shape-in-range gate plus breadth Z of SPY QQQ IWM
• Failure mode addressed: chasing extended moves and fading during index-wide thrusts
• Testability: each component is an input and visible in orders list via L and S tags
• Portable yardstick: distances are ATR-normalized so thresholds transfer across symbols
• Open source: method and implementation are disclosed for community review
Method overview in plain language
Base measures
• Range basis: ATR(length = atr_len) as the normalization unit
• Return basis: not used directly; we use rank statistics for stability
Components
• Tri-Anchor Energy: squared distances of price from daily, weekly, monthly AVWAPs, each divided by ATR, then summed and ranked to a percentile over base_len
• Robust Z of Close: median and MAD based Z to avoid outliers
• Shape Gate: position of close inside bar range to require capitulation for longs and exhaustion for shorts
• Breadth Gate: average robust Z of SPY QQQ IWM to avoid fading when the tape is one-sided
• Gap Shock: skip signals after large session gaps
Fusion rule
• All required gates must be true: Energy ≥ energy_trig_prc, |Robust Z| ≥ z_trig, Shape satisfied, Breadth confirmed, Gap filter clear
Signal rule
• Long: energy extreme, Z negative beyond threshold, close near bar low, breadth Z ≤ −breadth_z_ok
• Short: energy extreme, Z positive beyond threshold, close near bar high, breadth Z ≥ +breadth_z_ok
What you will see on the chart
• Standard strategy arrows for entries and exits
• Optional short-side brackets: ATR stop and ATR take profit if enabled
Inputs with guidance
Setup
• Base length: window for percentile ranks and medians. Typical 40 to 80. Longer smooths, shorter reacts.
• ATR length: normalization unit. Typical 10 to 20. Higher reduces noise.
• VWAP band stdev: volatility bands for anchors. Typical 2.0 to 4.0.
• Robust Z window: 40 to 100. Larger for stability.
• Robust Z entry magnitude: 1.2 to 2.2. Higher means stronger extremes only.
• Energy percentile trigger: 90 to 99.5. Higher limits signals to rare stretches.
• Bar close in range gate long: 0.05 to 0.25. Larger requires deeper capitulation for longs.
Regime and Breadth
• Use breadth gate: on when trading indices or broad ETFs.
• Breadth Z confirm magnitude: 0.8 to 1.8. Higher avoids fighting thrusts.
• Gap shock percent: 1.0 to 5.0. Larger allows more gaps to trade.
Risk — Short only
• Enable short SL TP: on to bracket shorts.
• Short ATR stop mult: 1.0 to 3.0.
• Short ATR take profit mult: 1.0 to 6.0.
Properties visible in this publication
• Initial capital: 25000USD
• Default order size: Percent of total equity 3%
• Pyramiding: 0
• Commission: 0.03 percent
• Slippage: 5 ticks
• Process orders on close: OFF
• Bar magnifier: OFF
• Recalculate after order is filled: OFF
• Calc on every tick: OFF
• request.security lookahead off where used
Realism and responsible publication
• No performance claims. Past results never guarantee future outcomes
• Fills and slippage vary by venue
• Shapes can move during bar formation and settle on close
• Standard candles only for strategies
Honest limitations and failure modes
• Economic releases or very thin liquidity can overwhelm mean-reversion logic
• Heavy gap regimes may require larger gap filter or TR-based tuning
• Very quiet regimes reduce signal contrast; extend windows or raise thresholds
Open source reuse and credits
• None
Strategy notice
Orders are simulated by TradingView on standard candles. request.security uses lookahead off where applicable. Non-standard charts are not supported for execution.
Entries and exits
• Entry logic: as in Signal rule above
• Exit logic: short side optional ATR stop and ATR take profit via brackets; long side closes on opposite setup
• Risk model: ATR-based brackets on shorts when enabled
• Tie handling: stop first when both could be touched inside one bar
Dataset and sample size
• Test across your visible history. For robust inference prefer 100 plus trades.

FluxGate Daily Swing StrategySummary in one paragraph
FluxGate treats long and short as different ecosystems. It runs two independent engines so the long side can be bold when the tape rewards upside persistence while the short side can stay selective when downside is messy. The core reads three directional drivers from price geometry then removes overlap before gating with clean path checks. The complementary risk module anchors stop distance to a higher timeframe ATR so a unit means the same thing on SPY and BTC. It can add take profit breakeven and an ATR trail that only activates after the trade earns it. If a stop is hit the strategy can re enter in the same direction on the next bar with a daily retry cap that you control. Add it to a clean chart. Use defaults to see the intended behavior. For conservative workflows evaluate on bar close.
Scope and intent
• Markets. Large cap equities and liquid ETFs major FX pairs US index futures and liquid crypto pairs
• Timeframes. From one minute to daily
• Default demo in this publication. SPY on one day timeframe
• Purpose. Reduce false starts without missing sustained trends by fusing independent drivers and suppressing activity when the path is noisy
• Limits. This is a strategy. Orders are simulated on standard candles. Non standard chart types are not supported for execution
Originality and usefulness
• Unique fusion. FluxGate extracts three drivers that look at price from different angles. Direction measures slope of a smoothed guide and scales by realized volatility so a point of slope does not mean a different thing on different symbols. Persistence looks at short sign agreement to reward series of closes that keep direction. Curvature measures the second difference of a local fit to wake up during convex pushes. These three are then orthonormalized so a strong reading in one does not double count through another.
• Gates that matter. Efficiency ratio prefers direct paths over treadmills. Entropy turns up versus down frequency into an information read. Light fractal cohesion punishes wrinkly paths. Together they slow the system in chop and allow it to open up when the path is clean.
• Separate long and short engines. Threshold tilts adapt to the skew of score excursions. That lets long engage earlier when upside distribution supports it and keeps short cautious where downside surprise and venue frictions are common.
• Practical risk behavior. Stops are ATR anchored on a higher timeframe so the unit is portable. Take profit is expressed in R so two R means the same concept across symbols. Breakeven and trailing only activate after a chosen R so early noise does not squeeze a good entry. Re entry after stop lets the system try again without you babysitting the chart.
• Testability. Every major window and the aggression controls live in Inputs. There is no hidden magic number.
Method overview in plain language
Base measures
• Return basis. Natural log of close over prior close for stability and easy aggregation through time. Realized volatility is the standard deviation of returns over a moving window.
• Range basis for risk. ATR computed on a higher timeframe anchor such as day week or month. That anchor is steady across venues and avoids chasing chart specific quirks.
Components
• Directional intensity. Use an EMA of typical price as a guide. Take the day to day slope as raw direction. Divide by realized volatility to get a unit free measure. Soft clip to keep outliers from dominating.
• Persistence. Encode whether each bar closed up or down. Measure short sign agreement so a string of higher closes scores better than a jittery sequence. This favors push continuity without guessing tops or bottoms.
• Curvature. Fit a short linear regression and compute the second difference of the fitted series. Strong curvature flags acceleration that slope alone may miss.
• Efficiency gate. Compare net move to path length over a gate window. Values near one indicate direct paths. Values near zero indicate treadmill behavior.
• Entropy gate. Convert up versus down frequency into a probability of direction. High entropy means coin toss. The gate narrows there.
• Fractal cohesion. A light read of path wrinkliness relative to span. Lower cohesion reduces the urge to act.
• Phase assist. Map price inside a recent channel to a small signed bias that grows with confidence. This helps entries lean toward the right half of the channel without becoming a breakout rule.
• Shock control. Compare short volatility to long volatility. When short term volatility spikes the shock gate temporarily damps activity so the system waits for pressure to normalize.
Fusion rule
• Normalize the three drivers after removing overlap
• Blend with weights that adapt to your aggression input
• Multiply by the gates to respect path quality
• Smooth just enough to avoid jitter while keeping timing responsive
• Compute an adaptive mean and deviation of the score and set separate long and short thresholds with a small tilt informed by skew sign
• The result is one long score and one short score that can cross their thresholds at different times for the same tape which is a feature not a bug
Signal rule
• A long suggestion appears when the long score crosses above its long threshold while all gates are active
• A short suggestion appears when the short score crosses below its short threshold while all gates are active
• If any required gate is missing the state is wait
• When a position is open the status is in long or in short until the complementary risk engine exits or your entry mode closes and flips
Inputs with guidance
Setup Long
• Base length Long. Master window for the long engine. Typical range twenty four to eighty. Raising it improves selectivity and reduces trade count. Lowering it reacts faster but can increase noise
• Aggression Long. Zero to one. Higher values make thresholds more permissive and shorten smoothing
Setup Short
• Base length Short. Master window for the short engine. Typical range twenty eight to ninety six
• Aggression Short. Zero to one. Lower values keep shorts conservative which is often useful on upward drifting symbols
Entries and UI
• Entry mode. Both or Long only or Short only
Complementary risk engine
• Enable risk engine. Turns on bracket exits while keeping your signal logic untouched
• ATR anchor timeframe. Day Week or Month. This sets the structural unit of stop distance
• ATR length. Default fourteen
• Stop multiple. Default one point five times the anchor ATR
• Use take profit. On by default
• Take profit in R. Default two R
• Breakeven trigger in R. Default one R
Usage recipes
Intraday trend focus
• Entry mode Both
• ATR anchor Week
• Aggression Long zero point five Aggression Short zero point three
• Stop multiple one point five Take profit two R
• Expect fewer trades that stick to directional pushes and skip treadmill noise
Intraday mean reversion focus
• Session windows optional if you add them in your copy
• ATR anchor Day
• Lower aggression both sides
• Breakeven later and trailing later so the first bounce has room
• This favors fade entries that still convert into trends when the path stays clean
Swing continuation
• Signal timeframe four hours or one day
• Confirm timeframe one day if you choose to include bias
• ATR anchor Week or Month
• Larger base windows and a steady two R target
• This accepts fewer entries and aims for larger holds
Properties visible in this publication
• Initial capital 25.000
• Base currency USD
• Default order size percent of equity value three - 3% of the total capital
• Pyramiding zero
• Commission zero point zero three percent - 0.03% of total capital
• Slippage five ticks
• Process orders on close off
• Recalculate after order is filled off
• Calc on every tick off
• Bar magnifier off
• Any request security calls use lookahead off everywhere
Realism and responsible publication
• No performance promises. Past results never guarantee future outcomes
• Fills and slippage vary by venue and feed
• Strategies run on standard candles only
• Shapes can update while a bar is forming and settle on close
• Keep risk per trade sensible. Around one percent is typical for study. Above five to ten percent is rarely sustainable
Honest limitations and failure modes
• Sudden news and thin liquidity can break assumptions behind entropy and cohesion reads
• Gap heavy symbols often behave better with a True Range basis for risk than a simple range
• Very quiet regimes can reduce score contrast. Consider longer windows or higher thresholds when markets sleep
• Session windows follow the exchange time of the chart if you add them
• If stop and target can both be inside a single bar this strategy prefers stop first to keep accounting conservative
Open source reuse and credits
• No reused open source beyond public domain building blocks such as ATR EMA and linear regression concepts
Legal
Education and research only. Not investment advice. You are responsible for your decisions. Test on history and in simulation with realistic costs

Blick Trades Position Size CalculatorThe Blick Trades Position Size indicator is a comprehensive Position Size Calculator designed for futures traders on TradingView. It automatically detects the asset type (Gold, Nasdaq, or ES futures - both regular and micro contracts) and calculates the optimal number of contracts to trade based on your risk amount and stop loss price.
The indicator features a "Maximize Risk" option that intelligently switches between regular and micro contracts to get as close as possible to your target risk amount, plus support for limit orders with custom entry prices. It displays visual elements on the chart including entry and stop loss lines with live risk calculations, and uses an asset-specific display system so you can control which charts show the indicator (preventing parameter confusion when switching between different futures contracts).
The calculator handles all the complex math automatically - just input your risk amount and stop loss, and it tells you exactly how many contracts to trade while showing your precise dollar risk in real-time.

ProbRSI Adaptive SPY and QQQ Swing One Hour Strategy Summary in one paragraph
A probabilistic RSI engine for large cap ETFs and index names on intraday and swing timeframes. It converts ATR scaled returns into a 0 to 100 probability line, adapts its smoothing from path efficiency, and gates flips with simple percent levels. It is original because it fuses three pieces that traders rarely combine in one signal line: ATR normalized return probability, curvature compression, and per bar adaptive EMA. Add it to a clean chart, keep the default one hour signal on QQQ, and read the entry and exit markers generated by the strategy. For conservative alerts select on bar close.
Scope and intent
• Markets. Major ETFs and large cap equities. Index futures. Liquid crypto. Major FX pairs
• Timeframes. One minute to daily. Defaults to one hour for swing pace
• Default demo used in this publication. SPY/QQQ on one hour
• Purpose. Reduce false flips by adapting to path efficiency and by gating long and short separately
• Limits. This is a strategy. Orders are simulated on standard candles only
Originality and usefulness
• Unique fusion. Logistic probability of ATR scaled returns with arcsine pre transform, optional curvature compression, and per bar adaptive EMA steered by an efficiency ratio
• Failure mode addressed. Fast whips in congestion and late entries after spikes
• Testability. Each component has a named input and can be tuned directly. Entry names Long and Short are visible in the list of trades
• Portable yardstick. ATR scaled return is a common unit across symbols and venues
• Protected rationale. The code stays protected to preserve implementation details of the adaptive engine and curvature assist while the method and usage are fully explained here for community review
Method overview in plain language
You convert raw returns into a probability scale, adapt the smoothing to the straightness of the path, and only allow flips when a simple gate is satisfied. The probability line crosses its own EMA to generate signals. When the cross happens below a short gate or above a long gate, the flip is allowed. Otherwise it is ignored.
Base measures
• Return basis. Close minus prior close normalized by ATR, then arcsine to damp large steps. ATR window is set by ATR length. Sensitivity is adjusted by an ATR scale input
• Probability map. A logistic function maps the normalized return to 0 to 1 which becomes 0 to 100 after scaling
Components
• Probability core. Logistic probability of ATR scaled returns. Higher values imply upside pressure. Smoothed by an adaptive EMA
• Curvature assist optional. A curvature proxy compresses extreme spikes toward neutral. Useful after news bars. Weight controls strength
• Efficiency ratio. A path efficiency score from 0 to 1 extends the smoothing length during noisy paths and shortens it during directional paths
• Signal line. An EMA of the probability line creates the reference for cross up and cross down
• Gates. Two simple percent levels define when long and short flips are allowed
Fusion rule
• The adaptive EMA length is computed as a linear map between a minimum and a maximum bound based on one minus efficiency
• If curvature assist is enabled the probability is adjusted by a small counter spike term
• Final probability is compared to its EMA
Signal rule
• Long. A long entry is suggested when probability crosses above the signal line and the current probability is above the Long gate level
• Short. A short entry is suggested when probability crosses below the signal line and the current probability is below the Short gate level
• Exit and flip. When an opposite entry condition appears the current position is closed and a new position opens in the opposite direction
What you will see on the chart
• Strategy markers on suggestion bars. Orders named Long and Short
• Exit marker when the opposite signal closes the open side
• No table by design. All tuning lives in Inputs for a clean chart
Inputs with guidance
Market TF
• Symbol. Series used for oscillator computation. Use the instrument you trade or a close proxy
• Signal timeframe. Timeframe where the oscillator is evaluated. Leave blank to follow the chart
Core
• Price source. Series used for returns. Typical choice close
• Base length. Fallback EMA length used when adaptation is off. Typical range 20 to 200. Larger smooths more
• ATR length. Window for ATR that scales returns. Typical range 10 to 30. Larger normalizes more and lowers sensitivity
• Logit sharpness. Steepness of the logistic link. Typical range 1 to 8. Raising it reacts more to the same input
• ATR scale. Extra divisor on ATR. Typical range 0.5 to 2. Smaller is more sensitive
• Signal length. EMA of the probability line. Typical range 5 to 20. Larger gives fewer flips
• Long gate. Allow long flips only above this level. Typical range 20 to 40
• Short gate. Allow short flips only below this level. Typical range 20 to 40
Adaptive
• Adaptive smoothing. If on, the efficiency ratio controls the per bar EMA length
• Min effective length. Lower bound of adaptive EMA. Typical range 5 to 50
• Max effective length. Upper bound of adaptive EMA. Typical range 50 to 300
• Efficiency window. Window for efficiency ratio. Typical range 30 to 100
Shape Assist
• Curvature influence. If on, extreme spikes are nudged toward neutral
• Curvature weight. Strength of compression. Typical range 0.1 to 0.3
Properties visible in this publication
• Initial capital. 25000
• Base currency. USD
• request.security lookahead off everywhere
• Commission. 0.03 percent
• Slippage. 5 ticks
• Default order size method percent of equity with value 3 for realistic testing
• Pyramiding 0
• Process orders on close ON
• Bar magnifier OFF
• Recalculate after order is filled OFF
• Calc on every tick OFF
Realism and responsible publication
• No performance claims. Past results never guarantee future outcomes
• Shapes can move while a bar forms and settle on close
• Strategies use standard candles for signals and orders only
Honest limitations and failure modes
• Economic releases and thin liquidity can break assumptions behind the curvature assist
• Gap heavy symbols may prefer a longer ATR window
• Very quiet regimes can reduce signal contrast. Consider higher gates or longer signal length
• Session time follows the exchange of the chart and can change symbol to symbol
• Symbol sensitivity is expected. Use the gates and length inputs to find stable settings
• Past results never guarantee future outcomes
Open source reuse and credits
• None
Mode
Public protected. Source is hidden while access is free. Implementation detail remains private. Method and use are fully disclosed here
Legal
Education and research only. Not investment advice. You are responsible for your decisions. Test on historical data and in simulation before any live use. Use realistic costs.

Quantum Flux Universal Strategy Summary in one paragraph
Quantum Flux Universal is a regime switching strategy for stocks, ETFs, index futures, major FX pairs, and liquid crypto on intraday and swing timeframes. It helps you act only when the normalized core signal and its guide agree on direction. It is original because the engine fuses three adaptive drivers into the smoothing gains itself. Directional intensity is measured with binary entropy, path efficiency shapes trend quality, and a volatility squash preserves contrast. Add it to a clean chart, watch the polarity lane and background, and trade from positive or negative alignment. For conservative workflows use on bar close in the alert settings when you add alerts in a later version.
Scope and intent
• Markets. Large cap equities and ETFs. Index futures. Major FX pairs. Liquid crypto
• Timeframes. One minute to daily
• Default demo used in the publication. QQQ on one hour
• Purpose. Provide a robust and portable way to detect when momentum and confirmation align, while dampening chop and preserving turns
• Limits. This is a strategy. Orders are simulated on standard candles only
Originality and usefulness
• Unique concept or fusion. The novelty sits in the gain map. Instead of gating separate indicators, the model mixes three drivers into the adaptive gains that power two one pole filters. Directional entropy measures how one sided recent movement has been. Kaufman style path efficiency scores how direct the path has been. A volatility squash stabilizes step size. The drivers are blended into the gains with visible inputs for strength, windows, and clamps.
• What failure mode it addresses. False starts in chop and whipsaw after fast spikes. Efficiency and the squash reduce over reaction in noise.
• Testability. Every component has an input. You can lengthen or shorten each window and change the normalization mode. The polarity plot and background provide a direct readout of state.
• Portable yardstick. The core is normalized with three options. Z score, percent rank mapped to a symmetric range, and MAD based Z score. Clamp bounds define the effective unit so context transfers across symbols.
Method overview in plain language
The strategy computes two smoothed tracks from the chart price source. The fast track and the slow track use gains that are not fixed. Each gain is modulated by three drivers. A driver for directional intensity, a driver for path efficiency, and a driver for volatility. The difference between the fast and the slow tracks forms the raw flux. A small phase assist reduces lag by subtracting a portion of the delayed value. The flux is then normalized. A guide line is an EMA of a small lead on the flux. When the flux and its guide are both above zero, the polarity is positive. When both are below zero, the polarity is negative. Polarity changes create the trade direction.
Base measures
• Return basis. The step is the change in the chosen price source. Its absolute value feeds the volatility estimate. Mean absolute step over the window gives a stable scale.
• Efficiency basis. The ratio of net move to the sum of absolute step over the window gives a value between zero and one. High values mean trend quality. Low values mean chop.
• Intensity basis. The fraction of up moves over the window plugs into binary entropy. Intensity is one minus entropy, which maps to zero in uncertainty and one in very one sided moves.
Components
• Directional Intensity. Measures how one sided recent bars have been. Smoothed with RMA. More intensity increases the gain and makes the fast and slow tracks react sooner.
• Path Efficiency. Measures the straightness of the price path. A gamma input shapes the curve so you can make trend quality count more or less. Higher efficiency lifts the gain in clean trends.
• Volatility Squash. Normalizes the absolute step with Z score then pushes it through an arctangent squash. This caps the effect of spikes so they do not dominate the response.
• Normalizer. Three modes. Z score for familiar units, percent rank for a robust monotone map to a symmetric range, and MAD based Z for outlier resistance.
• Guide Line. EMA of the flux with a small lead term that counteracts lag without heavy overshoot.
Fusion rule
• Weighted sum of the three drivers with fixed weights visible in the code comments. Intensity has fifty percent weight. Efficiency thirty percent. Volatility twenty percent.
• The blend power input scales the driver mix. Zero means fixed spans. One means full driver control.
• Minimum and maximum gain clamps bound the adaptive gain. This protects stability in quiet or violent regimes.
Signal rule
• Long suggestion appears when flux and guide are both above zero. That sets polarity to plus one.
• Short suggestion appears when flux and guide are both below zero. That sets polarity to minus one.
• When polarity flips from plus to minus, the strategy closes any long and enters a short.
• When flux crosses above the guide, the strategy closes any short.
What you will see on the chart
• White polarity plot around the zero line
• A dotted reference line at zero named Zen
• Green background tint for positive polarity and red background tint for negative polarity
• Strategy long and short markers placed by the TradingView engine at entry and at close conditions
• No table in this version to keep the visual clean and portable
Inputs with guidance
Setup
• Price source. Default ohlc4. Stable for noisy symbols.
• Fast span. Typical range 6 to 24. Raising it slows the fast track and can reduce churn. Lowering it makes entries more reactive.
• Slow span. Typical range 20 to 60. Raising it lengthens the baseline horizon. Lowering it brings the slow track closer to price.
Logic
• Guide span. Typical range 4 to 12. A small guide smooths without eating turns.
• Blend power. Typical range 0.25 to 0.85. Raising it lets the drivers modulate gains more. Lowering it pushes behavior toward fixed EMA style smoothing.
• Vol window. Typical range 20 to 80. Larger values calm the volatility driver. Smaller values adapt faster in intraday work.
• Efficiency window. Typical range 10 to 60. Larger values focus on smoother trends. Smaller values react faster but accept more noise.
• Efficiency gamma. Typical range 0.8 to 2.0. Above one increases contrast between clean trends and chop. Below one flattens the curve.
• Min alpha multiplier. Typical range 0.30 to 0.80. Lower values increase smoothing when the mix is weak.
• Max alpha multiplier. Typical range 1.2 to 3.0. Higher values shorten smoothing when the mix is strong.
• Normalization window. Typical range 100 to 300. Larger values reduce drift in the baseline.
• Normalization mode. Z score, percent rank, or MAD Z. Use MAD Z for outlier heavy symbols.
• Clamp level. Typical range 2.0 to 4.0. Lower clamps reduce the influence of extreme runs.
Filters
• Efficiency filter is implicit in the gain map. Raising efficiency gamma and the efficiency window increases the preference for clean trends.
• Micro versus macro relation is handled by the fast and slow spans. Increase separation for swing, reduce for scalping.
• Location filter is not included in v1.0. If you need distance gates from a reference such as VWAP or a moving mean, add them before publication of a new version.
Alerts
• This version does not include alertcondition lines to keep the core minimal. If you prefer alerts, add names Long Polarity Up, Short Polarity Down, Exit Short on Flux Cross Up in a later version and select on bar close for conservative workflows.
Strategy has been currently adapted for the QQQ asset with 30/60min timeframe.
For other assets may require new optimization
Properties visible in this publication
• Initial capital 25000
• Base currency Default
• Default order size method percent of equity with value 5
• Pyramiding 1
• Commission 0.05 percent
• Slippage 10 ticks
• Process orders on close ON
• Bar magnifier ON
• Recalculate after order is filled OFF
• Calc on every tick OFF
Honest limitations and failure modes
• Past results do not guarantee future outcomes
• Economic releases, circuit breakers, and thin books can break the assumptions behind intensity and efficiency
• Gap heavy symbols may benefit from the MAD Z normalization
• Very quiet regimes can reduce signal contrast. Use longer windows or higher guide span to stabilize context
• Session time is the exchange time of the chart
• If both stop and target can be hit in one bar, tie handling would matter. This strategy has no fixed stops or targets. It uses polarity flips for exits. If you add stops later, declare the preference
Open source reuse and credits
• None beyond public domain building blocks and Pine built ins such as EMA, SMA, standard deviation, RMA, and percent rank
• Method and fusion are original in construction and disclosure
Legal
Education and research only. Not investment advice. You are responsible for your decisions. Test on historical data and in simulation before any live use. Use realistic costs.
Strategy add on block
Strategy notice
Orders are simulated by the TradingView engine on standard candles. No request.security() calls are used.
Entries and exits
• Entry logic. Enter long when both the normalized flux and its guide line are above zero. Enter short when both are below zero
• Exit logic. When polarity flips from plus to minus, close any long and open a short. When the flux crosses above the guide line, close any short
• Risk model. No initial stop or target in v1.0. The model is a regime flipper. You can add a stop or trail in later versions if needed
• Tie handling. Not applicable in this version because there are no fixed stops or targets
Position sizing
• Percent of equity in the Properties panel. Five percent is the default for examples. Risk per trade should not exceed five to ten percent of equity. One to two percent is a common choice
Properties used on the published chart
• Initial capital 25000
• Base currency Default
• Default order size percent of equity with value 5
• Pyramiding 1
• Commission 0.05 percent
• Slippage 10 ticks
• Process orders on close ON
• Bar magnifier ON
• Recalculate after order is filled OFF
• Calc on every tick OFF
Dataset and sample size
• Test window Jan 2, 2014 to Oct 16, 2025 on QQQ one hour
• Trade count in sample 324 on the example chart
Release notes template for future updates
Version 1.1.
• Add alertcondition lines for long, short, and exit short
• Add optional table with component readouts
• Add optional stop model with a distance unit expressed as ATR or a percent of price
Notes. Backward compatibility Yes. Inputs migrated Yes.

TwinPulse Q Lead SPY x QQQ Intermarket Pulse 1HTwinPulse Q Lead is a concise one hour indicator for SPY and QQQ that converts three sources of market information into a single pulse line, a mode readout with BUY SELL WAIT, and compact alerts. It blends intermarket leadership between QQQ and SPY, intraday flow from the slope of session VWAP, and where the current price sits inside the regular trading hours range. The three components are normalized, fused, compressed to a stable range, and smoothed for clear thresholds. The aim is a readable intraday regime signal that helps you decide when to participate and when to stand aside.
The script is built with Pine v6, uses request security with lookahead off, and does not repaint. It is an indicator, not a strategy. It does not contain any solicitation, links, or outside references. The description is self contained and explains both logic and use so that any trader can understand the design without reading code.
What makes this original and useful
Intermarket leadership is measured directly from QQQ and SPY on your working timeframe using a Z score of the return spread. When growth is leading value heavy large caps, leadership turns positive. When it lags, leadership turns negative. This gives a real time read of the Nasdaq versus S and P tug of war that most day traders watch informally.
Intraday flow is taken from the slope of the session VWAP. A linear regression of VWAP over a short window captures whether value is rising or falling inside the day. Dividing by ATR normalizes slope by typical movement so that the signal is comparable across weeks.
Session position places price inside the current regular hours high to low. It answers whether the day is trading in the top half, the bottom half, or the middle. This is a simple but powerful context filter for breakouts and fades.
The three components are fused into one pulse, compressed with either hyperbolic tangent or softsign to keep values bounded, and then smoothed by a short EMA. This yields a stable range with a zero line so the eye can read shifts quickly.
The panel shows a human readable mode with reasons and a strength score. Traders who do not want to read lines can rely on a simple state and a compact justification that explains why the state is set.
This is not a mashup that simply overlays unrelated indicators. Each component was chosen to answer a distinct question that is common to SPY and QQQ intraday decision making. Leadership answers who is in charge, flow answers whether value inside the session is building or leaking, and position answers if price is pressing the extremes or circling the middle. The pulse ties the three together and prevents any single component from dominating.
How the calculations work
Leadership. Compute a short rate of change for SPY and QQQ. Subtract SPY from QQQ to get spread returns, then compute a rolling Z score over a longer window. Positive values mean QQQ is leading. Negative values mean SPY is leading.
Flow. Compute session VWAP on the active symbol. Regress VWAP over a short window to obtain a slope estimate. Divide by ATR to scale slope by current volatility so that a small rise on a quiet day is not treated the same as a small rise on a wild day.
Position. Track the highest high and lowest low since the start of regular hours. Place the current close inside that range on a zero to one scale, then recenter to a minus one to plus one scale. Positive means the top half of the day, negative means the bottom half.
Fusion. Multiply each component by a weight so users can emphasize or de emphasize leadership, flow, or position. Sum to a raw pulse.
Compression. Pass the raw pulse through a bounded function. Hyperbolic tangent is smooth and has natural saturation near the extremes. Softsign is faster and behaves like a smoother version of sign near zero. Compression avoids unbounded excursions and makes thresholds meaningful across days.
Smoothing. Apply a short EMA to the compressed pulse to reduce noise. This creates the main line called TwinPulse in the plot.
Thresholds. You can use static symmetric levels or adaptive levels. The adaptive option computes a mean and a standard deviation of the smoothed pulse over a user window, then sets upper and lower thresholds as mean plus or minus sigma times standard deviation. This allows thresholds to adjust across regimes. Static levels are still available for traders who want repeatable levels.
Events and mode. A long event fires when the smoothed pulse crosses the upper threshold with positive flow and any optional filters agree. A short event fires on the symmetric condition. The mode reads the current state rather than fire and forget. It returns BUY when the smoothed pulse is above the upper threshold with positive flow, SELL when the smoothed pulse is below the lower threshold with negative flow, otherwise WAIT. A cooldown controls how often events can fire so alerts do not spam during choppy periods.
Inputs and default values
The script ships with defaults chosen for SPY and QQQ on one hour charts.
Symbols. SPY and QQQ by default. You can switch to any pair. Many users may test IWM versus SPY for small cap reads.
Regular hours selector. On by default. This restricts the position factor to New York regular hours. Turn it off if you prefer full session behavior.
ROC length is three bars. Z score length is fifty bars. VWAP slope window is ten bars. ATR length is fourteen bars. Pulse smoothing length is three bars.
Compression mode. Choose hyperbolic tangent or softsign. Hyperbolic tangent is default.
Weights. Leadership and flow are one by default. Position is set to zero point seven to give a modest influence to where price sits inside the day.
Thresholds. Adaptive thresholds are on by default with a lookback of one hundred bars and a sigma width of zero point eight. Static levels at plus or minus zero point six are ready if you disable adaptive mode.
Filters. ADX filter is off by default. If you enable it, the script requires ADX above a user minimum before it will signal. Higher time frame confirmation is off by default. When enabled it compares the smoothed pulse on the confirm timeframe to zero and requires alignment for longs or shorts.
Cooldown. Three bars by default so that alerts do not trigger too frequently.
UI. Bar coloring is on by default. The panel is on by default and sits at the top right.
All request security calls use lookahead off and will not request future data. All persistent state variables are assigned in a way that prevents repainting. The indicator does not use non standard chart types in its logic.
How to use the indicator
Load a one hour chart of SPY or QQQ. Keep a clean chart so that the script output is easy to read.
Turn on regular hours if you want the session position to reflect the cash session. This is recommended for SPY and QQQ.
Watch the panel. Mode reads BUY or SELL or WAIT. The strength value is a simple vote based score that ranges from zero to one hundred. It counts leadership, flow, ADX if enabled, and higher time frame confirmation if enabled. You can use strength to filter weak states.
Consider action only when mode is BUY or SELL and the signal has not just fired on the last bar. The triangles mark where an event fired. Alerts use the same logic as the events. WAIT means stand aside.
To slow the system, enable ADX and set a higher minimum or enable higher time frame confirmation. To speed it up, disable the filters, disable adaptive thresholds, or tighten the sigma width.
When publishing, use a clean chart with only this indicator. Show the symbol and timeframe clearly and make sure the plot legend is visible. If you add drawings on the chart, only include ones that help readers understand the output.
Publication notes and compliance
This description is written in English. The title uses ASCII and only uses capital letters for common abbreviations. The script is original and explains how and why the components work together. There are no links or promotional material. The script does not claim performance. It does not use lookahead. The panel and alerts exist to help a human read and act with discipline. The indicator can be published as open source or as protected. If you choose protected, the description still allows readers to understand how the logic works without access to the code.
If you later convert the logic into a strategy for publication, use realistic commission and slippage, risk no more than a small share of equity per trade, and choose a dataset that yields a large enough sample. Explain any deviations from these default recommendations in your strategy description. Do not publish results from non standard chart types since they can mislead readers on signal timing.
Limitations and risks
Intermarket leadership is a relative measure. There are hours when both SPY and QQQ fall while leadership remains positive. Treat leadership as a context, not a stand alone trigger.
VWAP slope is a path measure inside the session. It can flip several times on a choppy day. That is why the script uses a short smoothing and an optional cooldown. Use ADX or higher time frame confirmation to avoid the worst chop.
Session position assumes a meaningful regular hours range. On half days or around openings with gaps the position factor can be less informative. If this bothers you, reduce the weight of position or turn it off.
Compression and smoothing introduce lag by design. The goal is stability and clarity. If you want earlier but noisier signals, reduce smoothing and weights, and use static thresholds.
No indicator guarantees future results. TwinPulse Q Lead is a decision aid. It should be combined with your risk rules, position size policy, and a clear exit plan. Past behavior is not a promise for the future.
Frequently asked questions
What symbols are supported. Any symbol can be used as the chart symbol. Leadership uses the two user symbols which default to SPY and QQQ. Many traders may try IWM versus SPY or DIA versus SPY.
Can I change the timeframe. Yes, but the design target is one hour. On very short timeframes the VWAP slope becomes very sensitive and you should consider stronger filters.
Does the script repaint. No. It uses request security with lookahead off and the panel updates on the last bar only. Events are based on bar close conditions unless you attach alerts on any alert function call which will still respect the logic without looking into the future.
How are the strength numbers built. The strength score is the share of aligned votes across leadership, flow, ADX if enabled, and higher time frame confirmation if enabled. A value near one hundred means many filters agree. A value near fifty means partial alignment. It is not a probability or an accuracy number.
Can I use non standard chart types. You can view the indicator on them but do not publish signals from non standard chart types because that can mislead readers about timing. Use classic candles or bars when you publish and when you test.
Why do I sometimes see BUY but the price is not moving. A BUY mode requires pulse above the upper threshold and positive flow. It does not require higher highs immediately. Treat BUY as a permission to look for entries using your own execution rules.

New Highs-Lows US (NYSE,NASDAQ,AMEX) New 52-weeks Highs vs. Lows US market (NYSE,NASDAQ,AMEX)
Enjoy ;)

Smart Money LITE — Daily Sweep → HQ Signals (VWAP • FVG • CHoCH) 🔗 PRO VERSION (VWAP + FVG + CHoCH — full confirmations, all timeframes):
chartedgepro.gumroad.com/l/rmnbhw
Daily liquidity sweep → confluence signals with VWAP, FVG & CHoCH. Works on all timeframes & markets (Indices, Forex, Crypto).
WHAT IT DOES
Smart Money LITE+ highlights high-quality LONG/SHORT signals only after daily liquidity is swept (previous day high/low) with confluence from VWAP, FVG and structure (BOS/CHoCH).
Works on all timeframes and across markets: indices, forex, crypto.
KEY FEATURES (Lite)
• Daily sweep logic (PDH/PDL) + previous day zones
• VWAP + deviation bands (optional) and proximity filter
• 3-bar FVG boxes (visual) with adjustable extension
• ATR/volatility filter, optional HTF trend filter
• Anti-spam cooldown, clean LONG/SHORT labels
• Alerts: HQ LONG / HQ SHORT
HOW TO USE
1. Wait for price to sweep PDH/PDL → indicator opens “signal window”.
2. Look for confluence: VWAP touch/proximity + CHoCH or BOS in direction.
3. Enter with proper risk management (stop beyond swing/zone, partials).
SETTINGS TIPS
• Enable “Require VWAP Confluence?” for strictest setups.
• Use “HTF Trend Filter?” to align with higher-timeframe EMA trend.
• Adjust “After sweep (bars)” to define signal validity window.
• FVGs are visual in Lite — advanced filtering and confirmation are in Pro.
WHO IT'S FOR
Scalpers, intraday, and swing traders looking for objective, visual signals based on liquidity sweeps and VWAP/FVG confluence.
PRO VERSION (full confirmations)
Adds advanced FVG/iFVG logic, more confluence filters, dynamic risk tools and extended alert packages — optimized for all timeframes.
👉 chartedgepro.gumroad.com/l/rmnbhw
NOTES
• For educational purposes only. No financial advice.
• “Lite” is open-source; redistribution of code follows TradingView rules.

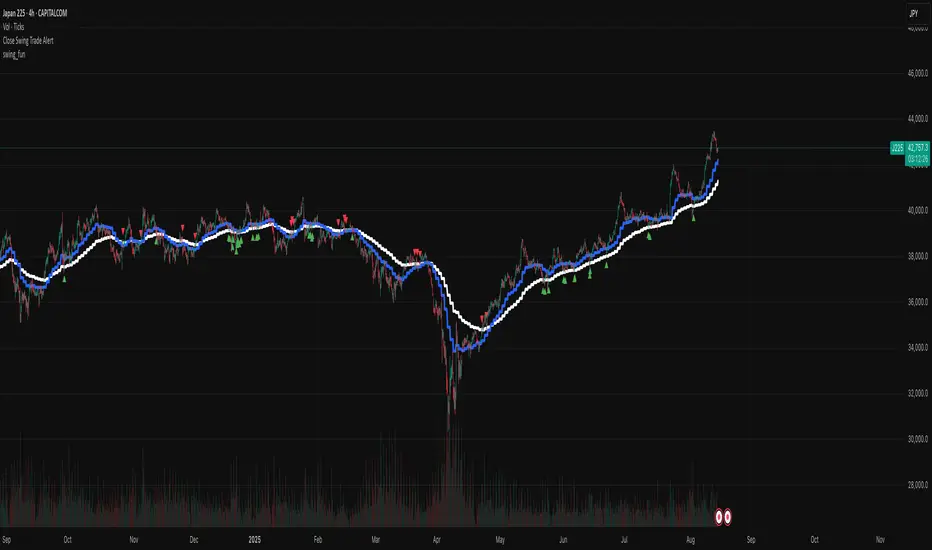
swing_funThis is a very simple swing trading entry point indicator, design to be used on the indexes with the 4hr chart. It gives alerts whenever a long or short signal is found.
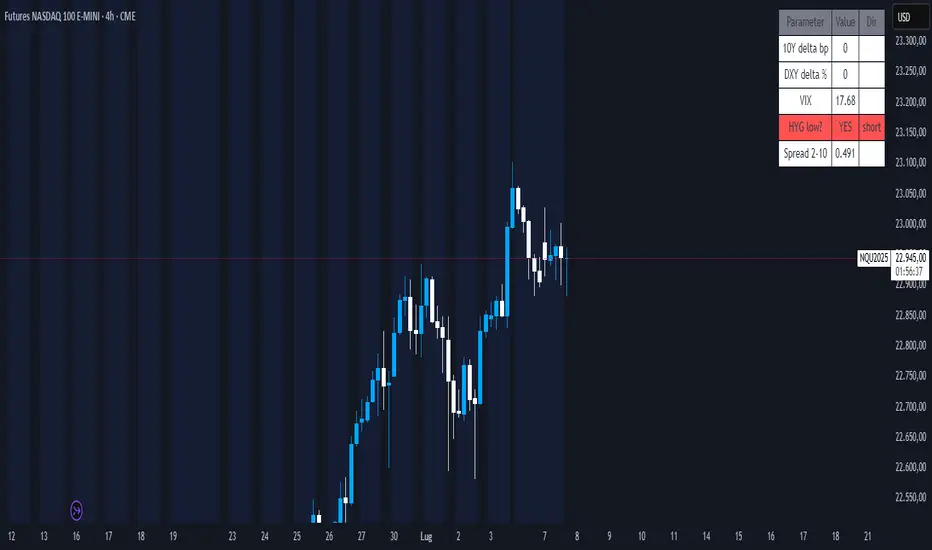
Nasdaq Macro Radar 3.5Nasdaq Macro Radar is an intraday tool that condenses five macro-drivers of the Nasdaq-100 into a single color-coded table:
• real-time moves in the 10- and 2-year Treasury yields
• dollar strength via the Dollar Index
• equity volatility level (VIX)
• risk tone in high-yield credit (HYG ETF)
• dynamic slope of the 2-10-year curve
Each cell flips from neutral to “long” or “short” on the fly, letting you see at a glance whether the macro backdrop is helping trend continuation or signalling a potential reversal.
• No extra pane – the table sits directly on your price chart and can be parked in any corner.
• All sensitivity thresholds are user-adjustable from Settings.
• Built-in alerts for the most critical levels.
Designed for scalpers and day-traders who need an instant macro check without juggling multiple charts
Nasdaq Macro Radar è un indicatore intraday che sintetizza, in un’unica tabella color-code, cinque motori macro-finanziari chiave per il Nasdaq-100:
• movimento dei rendimenti Treasury a 10 a & 2 a
• variazioni del Dollar Index
• livello della volatilità implicita (VIX)
• tono del mercato credito high-yield (ETF HYG)
• pendenza dinamica della curva 2-10 a
Ogni cella passa dal neutro a “long” o “short” in tempo reale, consentendo di valutare a colpo d’occhio se il contesto macro favorisce prosecuzioni o inversioni del trend di prezzo.
• Nessuna finestra separata: la tabella resta sovrapposta al grafico e può essere spostata in qualsiasi angolo.
• Parametri di sensibilità completamente regolabili dal pannello Settings.
• Alert integrati per le soglie critiche più importanti.
Pensato per chi fa scalping o day-trading sul Nasdaq e vuole un check macro immediato senza aprire dieci grafici di supporto.
QQQ Strategy v2 ESL | easy-peasy-x This is a strategy optimized for QQQ (and SPY) for the 1H timeframe. It significantly outperforms passive buy-and-hold approach. With settings adjustments, it can be used on various assets like stocks and cryptos and various timeframes, although the default out of the box settings favor QQQ 1H.
The strategy uses various triggers to take both long and short trades. These can be adjusted in settings. If you try a different asset, see what combination of triggers works best for you.
Some of the triggers employ LuxAlgo's Ultimate RSI - shoutout to him for great script, check it out here .
Other triggers are based on custom signed standard deviation - basically the idea is to trade Bollinger Bands expansions (long to the upside, short to the downside) and fade or stay out of contractions.
There are three key moving averages in the strategy - LONG MA, SHORT MA, BASIC MA. Long and Short MAs are guides to eyes on the chart and also act as possible trend filters (adjustable in settings). Basic MA acts as guide to eye and a possible trade trigger (adjustable in settings).
There are a few trend filters the strategy can use - moving average, signed standard deviation, ultimate RSI or none. The filters act as an additional condition on triggers, making the strategy take trades only if both triggers and trend filter allows. That way one can filter out trades with unfavorable risk/reward (for instance, don't long if price is under the MA200). Different trade filters can be used for long and short trades.
The strategy employs various stop loss types, the default of which is a trailing %-based stop loss type. ATR-based stop loss is also available. The default 1.5% trailing stop loss is suitable for leveraged trading.
Lastly, the strategy can trigger take profit orders if certain conditions are met, adjustable in settings. Also, it can hold onto winning trades and exit only after stop out (in which case, consecutive triggers to take other positions will be ignored until stop out).
Let me know if you like it and if you use it, what kind of tweaks would you like to see.
With kind regards,
easy-peasy-x

Market Sentiment Index US Top 40 [Pt]▮Overview
Market Sentiment Index US Top 40 [Pt} shows how the largest US stocks behave together. You pick one simple measure—High Low breakouts, Above Below moving average, or RSI overbought/oversold—and see how many of your chosen top 10/20/30/40 NYSE or NASDAQ names are bullish, neutral, or bearish.
This tool gives you a quick view of broad-market strength or weakness so you can time trades, confirm trends, and spot hidden shifts in market sentiment.
▮Key Features
► Three Simple Modes
High Low Index: counts stocks making new highs or lows over your lookback period
Above Below MA: flags stocks trading above or below their moving average
RSI Sentiment: marks overbought or oversold stocks and plots a small histogram
► Universe Selection
Top 10, 20, 30, or 40 symbols from NYSE or NASDAQ
Option to weight by market cap or treat all symbols equally
► Timeframe Choice
Use your chart’s timeframe or any intraday, daily, weekly, or monthly resolution
► Histogram Smoothing
Two optional moving averages on the sentiment bars
Markers show when the faster average crosses above or below the slower one
► Ticker Table
Optional on-chart table showing each ticker’s state in color
Grid or single-row layout with adjustable text size and color settings
▮Inputs
► Mode and Lookback
Pick High Low, Above Below MA, or RSI Sentiment
Set lookback length (for example 10 bars)
If using Above Below MA, choose the moving average type (EMA, SMA, etc.)
► Universe Setup
Market: NYSE or NASDAQ
Number of symbols: 10, 20, 30, or 40
Weights: on or off
Timeframe: blank to match chart or pick any other
► Moving Averages on Histogram
Enable fast and slow averages
Set their lengths and types
Choose colors for averages and markers
► Table Options
Show or hide the symbol table
Select text size: tiny, small, or normal
Choose layout: grid or one-row
Pick colors for bullish, neutral, and bearish cells
Show or hide exchange prefixes
▮How to Read It
► Sentiment Bars
Green means bullish
Red means bearish
Near zero means neutral
► Zero Line
Separates bullish from bearish readings
► High Low Line (High Low mode only)
Smooth ratio of highs versus lows over your lookback
► MA Crosses
Fast MA above slow MA hints rising breadth
Fast MA below slow MA hints falling breadth
► Ticker Table
Each cell colored green, gray, or red for bull, neutral, or bear
▮Use Cases
► Confirm Market Trends
Early warning when price makes highs but breadth is weak
Catch rallies when breadth turns strong while price is flat
► Spot Sector Rotation
Switch between NYSE and NASDAQ to see which group leads
Watch tech versus industrial breadth to track money flow
► Filter Trade Signals
Enter longs only when breadth is bullish
Consider shorts when breadth turns negative
► Combine with Other Indicators
Use RSI Sentiment with trend tools to spot overextended moves
Add volume indicators in High Low mode for breakout confirmation
► Timeframe Analysis
Daily for big-picture bias
Intraday (15-min) for precise entries and exits

TICK+ [Pt]█ TICK+ – Advanced US Market Internals & TICK Distribution Tool
TICK+ is a comprehensive indicator that decodes US market internals by leveraging the TICK index—the net difference between stocks ticking up and those ticking down. Unlike many standard TICK tools that only plot raw values, TICK+ provides multiple visualization modes, dynamic moving averages, an independent MA Ribbon, a detailed distribution profile, divergence and pivot analysis, and real-time data tables. This integrated approach offers both visual and quantitative insights into intraday market breadth, trend sustainability, and potential reversals—making it an indispensable tool for trading US indices, futures, and blue‑chip stocks.
Market internals enthusiasts often consider the TICK index indispensable for trading these markets. By offering an immediate snapshot of sentiment and confirming trends through additional analytics, TICK+ gives traders a decisive edge—helping to determine whether a rally is truly supported by broad participation or if caution is warranted.
--------------------------------------------------------------------------------------------------------
█ Key Features:
► Market Internal – Multiple Display Modes:
Line Mode: Plots the TICK index as a continuous line for a clear view of real‑time values and trend direction.
Bar Mode: Uses traditional bar charts to represent the TICK index, emphasizing the magnitude of changes.
Heikin Ashi Mode: Applies the Heikin Ashi technique to smooth out fluctuations, making the underlying trend easier to discern.
Iceberg TICK Mode: Fills the area between zero and the highs in green, and between zero and the lows in red—highlighting how long the market remains in positive versus negative territory.
How It Works & Usage:
These display modes enable traders to select the visualization that best fits their analysis style. For instance, Iceberg TICK Mode highlights the duration of market strength or weakness, a critical factor for intraday directional assessment.
Comparison of Display Modes
► Dual Moving Average – Fast & Slow:
Computes two moving averages on the TICK index:
• Fast MA – reacts quickly to recent changes.
• Slow MA – confirms the overall trend.
Crossovers provide clear signals:
• Fast MA crossing above the slow MA indicates rising bullish momentum.
• Fast MA crossing below the slow MA indicates increasing bearish pressure.
How It Works & Usage:
These dual moving averages assist in detecting momentum shifts. Crossover signals can be used to time entries and exits to align with prevailing market sentiment.
Dual MA Crossover Example
► Moving Average / Smoothed MA – Smoothed & Base Moving Averages:
Calculates a Base MA and a Smoothed MA on the TICK index to reduce short‑term volatility.
Helps clarify the prevailing trend, providing additional confirmation alongside the dual moving averages.
How It Works & Usage:
These averages filter out noise and offer extra validation of the current trend, enhancing the reliability of trading signals.
Base and Smoothed MA Example
► Moving Average Ribbon – MA Ribbon:
Independently plots several moving averages together as a “ribbon,” each line customizable in length and type.
Visually reflects overall market directional strength:
• Consistent green color indicate sustained bullish conditions.
• Uniform red color indicate prevailing bearish sentiment.
How It Works & Usage:
The MA Ribbon provides a layered perspective on market internals. It enables traders to quickly gauge the robustness of a trend or identify early signs of a potential reversal.
MA Ribbon Trend and Shading
► Divergence - Pivot based – Divergence & Pivot Analysis:
Integrates divergence detection with pivot-based trendline analysis.
Identifies instances when the TICK index and price action diverge, serving as an early warning of a weakening trend.
How It Works & Usage:
Divergence signals help refine trade entries and exits by indicating potential trend reversals or adjustments in market sentiment.
Divergence Analysis
► TICK Distribution Profile – TICK Distribution Profile:
Divides the TICK index range into multiple bins to create a profile of how TICK values are distributed.
Identifies the point of control—the level where most TICK readings concentrate—relative to zero.
Allows adjustment of the lookback period to detect shifts in market bias, such as a move from a neutral zone toward extreme levels.
How It Works & Usage:
By visualizing the distribution of TICK readings, traders can monitor changes in market internals that may precede significant trend changes.
TICK Distribution Profile
► ZigZag – ZigZag:
Applies a zigzag algorithm to filter out minor fluctuations and identify significant swing highs and lows.
Highlights trend extremities and potential reversal points.
Offers an optional extension to the last bar for dynamic trend tracking.
How It Works & Usage:
The ZigZag feature helps traders focus on the major price swings that define market structure, eliminating the noise of insignificant movements.
ZigZag Example
► Pivot Trendline – Pivot Trendline:
Draws trendlines connecting pivot highs and pivot lows.
Provides settings to display only the most recent trendline or extend the last trendline.
Assists in identifying evolving support and resistance levels.
How It Works & Usage:
Pivot trendlines offer clear visual cues for key price levels and potential reversal zones, aiding in the timing of trades.
Pivot Trendline Example
► TICK Levels – TICK Levels:
Defines key thresholds for the TICK index, including neutral levels, trend zones, and overbought/oversold (OB/OS) extremes.
Highlights these levels to assist in identifying conditions that may trigger caution or present opportunities.
How It Works & Usage:
Marking these levels provides an immediate reference for assessing when the TICK index enters critical zones, guiding risk management and trade planning.
TICK Levels
► Background Color – Background Color:
Optionally changes the chart background based on TICK or moving average thresholds.
Provides additional visual cues regarding shifts in market sentiment.
How It Works & Usage:
Background color changes help reinforce key signals by immediately indicating shifts in market internals, enhancing overall situational awareness.
Background Color Example
► Data Tables – Data Table:
Displays essential market data in a single, easy-to-read table, including the TICK index source, market sentiment (e.g. Bullish, Bearish, or Neutral), trend status (such as Accelerating ⇗ or Retracing ⇘), and the current TICK value with color-coded strength.
Consolidates numerical data for a quick and precise assessment of market internals.
How It Works & Usage:
The data tables provide live, numerical feedback that complements the visual analysis, making it easy to monitor market sentiment and trend changes at a glance.
Data Table Display with Metrics
--------------------------------------------------------------------------------------------------------
█ Customization & Input Flexibility:
TICK+ offers extensive input options organized into feature‑specific groups, enabling traders to tailor the tool to various strategies:
► Market Internals Group:
Selects the primary TICK index source (with an optional custom override).
Provides a choice of display modes (Line, Bar, Heikin Ashi, Iceberg TICK) with configurable color schemes.
Includes options for iceberg overlays and highlighting.
► Moving Averages Groups (Dual, Smoothed/Base, MA Ribbon):
Dual MA group: Settings for fast and slow moving averages, including type, length, color, and crossover alerts.
Smoothed/Base MA group: Additional methods to filter out short‑term noise and confirm trends.
MA Ribbon group: Independently plots multiple moving averages as a ribbon, with full customization for each line.
► Divergence & Profile Groups:
Includes inputs for divergence detection (source, pivot lookback) and customization of the TICK Distribution Profile (lookback period, color thresholds, layout details).
► ZigZag & Pivot Trendline Groups:
Allows customization of zigzag parameters to highlight trend extremities.
Provides settings for pivot trendline appearance and behavior.
► TICK Levels & Background Colors:
Defines thresholds for neutral, trend, and extreme levels.
Offers color selections for level markers and optional background shading.
► Data Table Configuration:
Enables setting of table location, lookback intervals, and font size to present essential TICK metrics in a user‑friendly format.
--------------------------------------------------------------------------------------------------------
█ Additional Insights:
► TICK Index Fundamentals:
Monitors the net difference between stocks ticking up and down.
A positive reading indicates broader market participation, while a negative reading suggests increased selling pressure.
Understanding how long the TICK stays above or below zero is crucial for gauging intraday momentum.
► Role of Moving Averages:
Smooth out short‑term fluctuations, helping to highlight the prevailing trend.
Crossovers between fast and slow MAs can serve as clear signals for market momentum shifts.
► Interpreting the MA Ribbon:
Provides a layered perspective on market direction.
Consistent color and alignment confirm a strong trend, while variations may hint at reversals.
► Utility of the Distribution Profile:
Breaks down the TICK index into bins, identifying the point of control.
Changes in this control zone—particularly over different lookback periods—can signal potential trend changes.
► Precision of Data Tables:
Supplies live numerical feedback on key market internals, ensuring trading decisions are based on precise, real‑time measurements.
► Comparative Advantage:
Unlike many TICK tools that simply plot raw values, TICK+ provides an integrated, multidimensional analysis of market internals.
Its advanced features—ranging from unique display modes to sophisticated analytical components—make it indispensable for trading US indices, futures, and blue‑chip stocks.
--------------------------------------------------------------------------------------------------------
Disclaimer
This indicator is provided for educational and research purposes only and does not constitute financial advice. Trading involves risk, and thorough testing on historical data is recommended before applying any strategy using TICK+ in live markets.

Simple APF Strategy Backtesting [The Quant Science]Simple backtesting strategy for the quantitative indicator Autocorrelation Price Forecasting. This is a Buy & Sell strategy that operates exclusively with long orders. It opens long positions and generates profit based on the future price forecast provided by the indicator. It's particularly suitable for trend-following trading strategies or directional markets with an established trend.
Main functions
1. Cycle Detection: Utilize autocorrelation to identify repetitive market behaviors and cycles.
2. Forecasting for Backtesting: Simulate trades and assess the profitability of various strategies based on future price predictions.
Logic
The strategy works as follow:
Entry Condition: Go long if the hypothetical gain exceeds the threshold gain (configurable by user interface).
Position Management: Sets a take-profit level based on the future price.
Position Sizing: Automatically calculates the order size as a percentage of the equity.
No Stop-Loss: this strategy doesn't includes any stop loss.
Example Use Case
A trader analyzes a dayli period using 7 historical bars for autocorrelation.
Sets a threshold gain of 20 points using a 5% of the equity for each trade.
Evaluates the effectiveness of a long-only strategy in this period to assess its profitability and risk-adjusted performance.
User Interface
Length: Set the length of the data used in the autocorrelation price forecasting model.
Thresold Gain: Minimum value to be considered for opening trades based on future price forecast.
Order Size: percentage size of the equity used for each single trade.
Strategy Limit
This strategy does not use a stop loss. If the price continues to drop and the future price forecast is incorrect, the trader may incur a loss or have their capital locked in the losing trade.
Disclaimer!
This is a simple template. Use the code as a starting point rather than a finished solution. The script does not include important parameters, so use it solely for educational purposes or as a boilerplate.
