Close Below MAClose Below MA (SMA or EMA)
This indicator helps traders quickly identify when a candle closes below a moving average — a classic signal of potential bearish momentum or a shift in trend.
You can choose between Simple Moving Average (SMA) or Exponential Moving Average (EMA) from a convenient dropdown menu, and customize the MA length to fit your strategy.
When a candle closes below the selected MA, a small black arrow appears above the bar, and an alert can be triggered for instant notifications.
Features:
Choose between SMA or EMA.
Adjustable MA length.
Visual signal (arrow) when the close is below the selected MA.
Built-in alert support
Usage Ideas:
Spot early signs of a bearish reversal.
Use alerts for automated trade monitoring.
Moving_average

Dashboard Trader _V1
📊 Dashboard Trader – Adaptive Structure, Trend & Zones
Description:
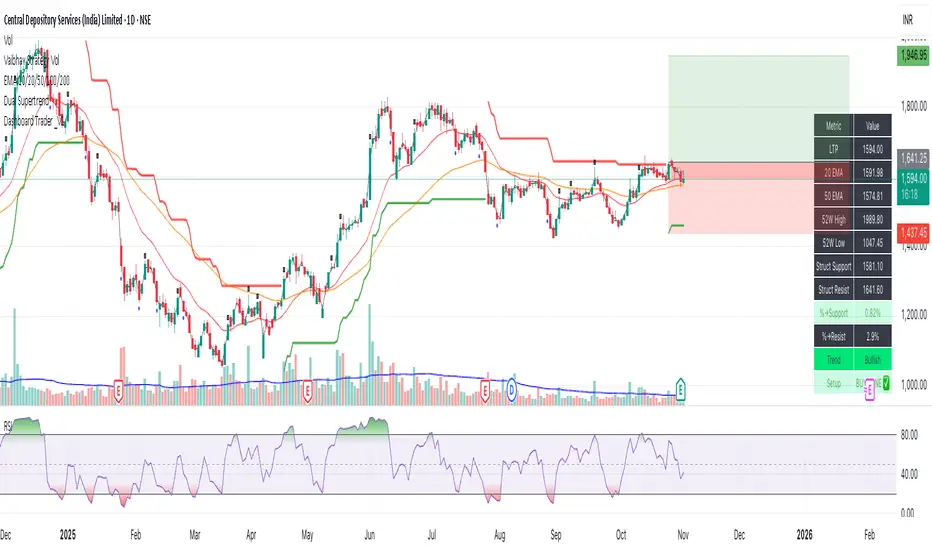
NSE Dashboard V3 is a next-gen support–resistance and trend-mapping indicator designed for positional and swing traders. It combines price structure, moving averages, and adaptive pivot logic to highlight Buy Zones, Take-Profit Zones, and overall market direction — all inside a clean, compact dashboard.
⸻
🧩 What It Does
• Auto-detects structural support & resistance zones using adaptive pivot clustering logic.
• Tracks broken levels dynamically — old supports removed, new ones added.
• Identifies trend bias using dual EMAs (20-EMA & 50-EMA).
• Displays a live dashboard table showing:
• LTP (Last Traded Price)
• 20 EMA / 50 EMA
• 52-week High & Low (true daily data)
• Structural Support & Resistance
• % Distance to each zone
• Trend direction
• Trade Setup Zone → BUY ✅ / TAKE PROFIT ⚠ / NEUTRAL
⸻
🧠 How to Trade It
1. Check the trend:
• 20 EMA > 50 EMA → Bullish bias (look for long entries).
• 20 EMA < 50 EMA → Bearish bias (look for short or avoid longs).
2. Enter near support:
• When price is ≤ 2% above Struct Support and trend is bullish → BUY ZONE ✅
3. Exit or reduce near resistance:
• When price is ≤ 2% below Struct Resistance → TAKE PROFIT ⚠
4. If no valid resistance (at ATH):
• Trail stop below 20 EMA or last swing low.
⸻
⚙️ Key Features
• EMA-based trend detection
• Dynamic structural zone calculation (auto-updates)
• Daily timeframe 52-week High/Low
• Auto color-coded zones and table
• Works on all NSE stocks, futures, or indices
• Optional refresh every new bar
• Lightweight – optimized for live chart use
⸻
📈 Best Used For
• Swing trading / Positional setups (Daily or 4-hour charts)
• Intraday confirmation on lower timeframes (15-min+)
• Trend continuation entries and risk-defined reversals
⸻
⚠️ Disclaimer
This indicator is for educational purposes only.
It does not constitute financial advice or a buy/sell recommendation.
Always combine with your own price action, volume, and risk management.
⸻
💬 Author’s Note
Built for traders who think in zones, not signals.
Trade where risk is smallest and structure is strongest.
— Wealthcafe Investments
Fixed High Timeframe Moving AveragesFixed High Timeframe Moving Averages (W/D/4H)
Summary
This indicator plots essential, high-timeframe (HTF) Moving Averages onto your chart, **no matter which timeframe you are currently viewing**.
It is designed for traders who need multi-timeframe context at a glance. Stop switching charts to see where the 200-Week or 50-Day MA is—now you can see all critical HTF levels directly on your 5-minute (or any other) chart.
---
Who it’s for
Traders who rely on moving averages but like to work on lower chart timeframes while keeping higher timeframe context in sight. If you scalp on 1–15m yet want Weekly/Daily/4H MAs always visible, this is for you.
---
What it shows
Pinned (“fixed”) moving averages from higher timeframes—Weekly (20/100/200) , Daily (50/100/200/365) and 4H (200) —rendered on any chart timeframe. Your favorite HTF MAs stay on screen no matter what TF you’re currently analyzing.
---
Features
* **MA types:** SMA, EMA, VWMA, Hull.
* **Fully configurable:** toggle each line, set periods, colors, and thickness.
* **Two alert modes (see below):** intrabar vs confirmed HTF close.
* **Works on any symbol & chart TF** using `request.security` to fetch HTF data.
---
Alerts & Modes
This indicator solves the biggest problem with MTF alerts: false signals. You can choose one of two modes:
1. **Intrabar mode** — compares current chart price to the HTF MA. Triggers as soon as price crosses the HTF line; great for early signals but may update until the HTF bar closes.
2. **Confirmed mode** — checks HTF close vs HTF MA. Signals only on the higher-TF bar close; fewer false starts, no intrabar repainting on that TF.
Per-line *Cross Above / Cross Below* conditions are provided for all enabled MAs (e.g., “20W — Cross Above”, “365D — Cross Below”, etc.).
**How to use alerts:** add the script → “Create Alert” → pick any condition from the script’s list.
---
Why this helps
* Keeps Weekly/Daily structure visible while you execute on LTF.
* Classic anchors (e.g., 200D, 20W/100W/200W) are popular for trend bias, dynamic support/resistance, and pullback context.
* Lets you standardize MA references across all your lower-TF playbooks.
---
Notes on confirmation & repainting
* Intrabar signals can change until the higher-TF bar closes (that’s expected with multi-TF data).
* Confirmed mode waits for the HTF close—cleaner, but later. Choose what fits your workflow.
---
Quick setup
1. Pick `MA Type` (SMA/EMA/VWMA/Hull).
2. Enable the HTF lines you want (Weekly 20/100/200; Daily 50/100/200/365; 4H 200).
3. Choose `Alert Mode` (Intrabar vs Confirmed).
4. Style colors/widths to taste and set alerts on the lines you care about.
---
Good practice
* Combine HTF MAs with price action (swings, structure, liquidity grabs) rather than using them in isolation.
* Always validate signals in your execution TF and use a risk plan tailored to volatility.
* Protect your capital: position sizing, stops, and disciplined risk management matter more than any single line on the chart.
---
Disclaimer
For educational/informational purposes only; not financial advice. Trading involves risk—manage it responsibly.

THAIT Moving Averages Tight within # ATR EMA SMA convergence
THAIT(tight) indicator is a powerful tool for identifying moving average convergence in price action. This indicator plots four user-defined moving averages (EMA or SMA). It highlights moments when the MAs converge within a user specified number of ATRs, adjusted by the 14-period ATR, signaling potential trend shifts or consolidation.
A convergence is flagged when MA1 is the maximum, the spread between MAs is tight, and the price is above MA1, excluding cases where the longest MA (MA4) is the highest. The indicator alerts and visually marks convergence zones with a shaded green background, making it ideal for traders seeking precise entry or exit points.

PDB - RSI Based Buy/Sell signals with 4 MARSI Based Buy/Sell Signals on Price chart + 4 MA System
This indicator plots RSI-based Buy & Sell signals directly on the price chart , combined with a 4-Moving-Average trend filter (20/50/100/200) for higher accuracy and cleaner trade timing.
The signal triggers when RSI reaches user-defined overbought/oversold levels, but unlike a standard RSI, this version plots the signals **on the chart**, not in the RSI window — making entries and exits easier to see in real time.
RSI Levels Are Fully Customizable
The default RSI thresholds are 30 (oversold) and 70 (overbought).
However, you can adjust these to fit your trading style. For example:
> When day trading on the 5–15 min timeframe, I personally use 35 (oversold) and 75 (overbought) to catch moves earlier.
> The example shown in the preview image uses 10-minute timeframe settings.
You can change the RSI levels to trigger signals from **any value you choose**, allowing you to tailor the indicator to scalping, day trading, or swing trading.
4 Moving Averages Included:
20, 50, 100, 200 MAs act as dynamic trend filters so you can:
✔ trade signals only in the direction of trend
✔ avoid false reversals
✔ identify momentum shifts more clearly
Works on all markets and timeframes — crypto, stocks, FX, indices.

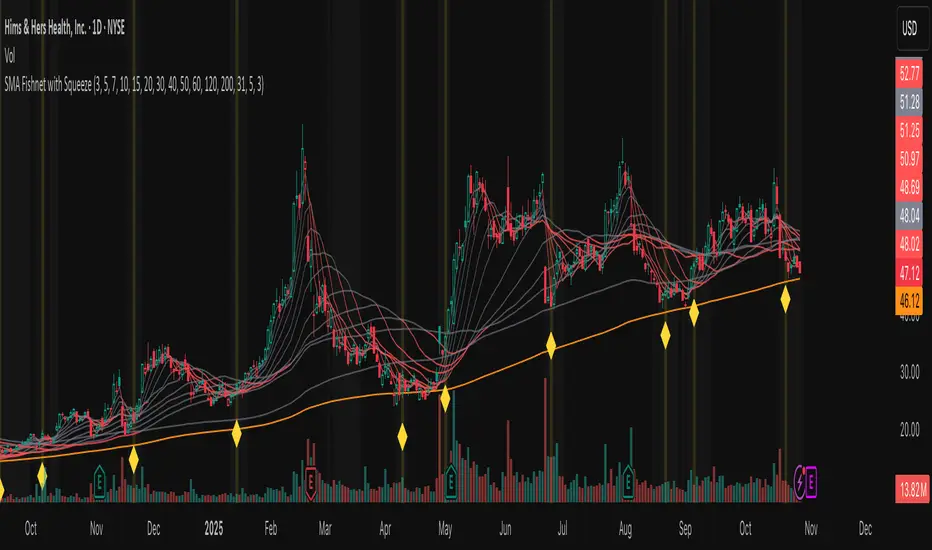
Fishnet Squeeze [Osprey]🟠 Overview
The SMA Fishnet with Squeeze indicator combines a multi-timeframe moving average ribbon system with an advanced squeeze detection algorithm to help traders identify both trend direction and potential breakout opportunities.
🟠 How to Use This Indicator
- Squeeze Breakout Trading
When the indicator signals a squeeze (yellow diamond marker and highlighted background), prepare for a potential breakout in either direction
- Support and Resistance Identification
The twelve SMA levels act as dynamic support and resistance zones. Price often bounces or pauses at these levels, especially at the convergence of multiple SMAs.
Squeeze Settings
- **Enable/Disable**: Toggle squeeze detection on or off
- **Lookback Period**: Adjust the historical comparison window (20-200 bars)
- **Percentile Threshold**: Set sensitivity for squeeze detection (1-20%)
- **Minimum Duration**: Define how many bars must confirm a squeeze (1-10)
- **Visual Customization**: Modify squeeze marker colors to suit your preferences
‼️ Test different values for Lookback Period ! Lower lookback period = more frequent squeeze marks. I suggest using 31 or 100.
🟠 The Fishnet Structure
The indicator employs twelve SMAs ranging from ultra-short-term (3-period) to long-term (200-period), creating a "fishnet" pattern on your chart. This graduated approach provides a comprehensive view of price action across multiple timeframes simultaneously:
🟠 Advanced Squeeze Detection Algorithm
The squeeze detection component identifies periods when all twelve SMAs converge into an unusually tight range, indicating market indecision and potential energy buildup. The algorithm uses several sophisticated filters:
1. ATR-Normalized Range Calculation: The indicator normalizes the SMA range using Average True Range (ATR) to ensure consistent squeeze detection across different volatility environments and price levels.
2. Historical Percentile Analysis: Compares the current normalized range against a customizable lookback period (default: 31 bars) to identify when SMAs are in the bottom percentile of historical tightness.
3. Statistical Validation: Uses z-score analysis to confirm that the current range is significantly below the mean, filtering out false signals.
4. Duration Confirmation: Requires the squeeze condition to persist for a minimum number of consecutive bars (default: 3) to validate genuine compression.
5. Local Minimum Verification: Confirms that the current squeeze represents the tightest point in recent history (20-bar window).
Reactive Curvature Smoother Moving Average IndicatorSummary in one paragraph
RCS MA is a reactive curvature smoother for any liquid instrument on intraday through swing timeframes. It helps you act only when context strengthens by adapting its window length with a normalized path energy score and by smoothing with robust residual weights over a quadratic fit, then optionally blending a capped one step forecast. Add it to a clean chart and watch the single colored line. Shapes can shift while a bar forms and settle on close. For conservative use, judge on bar close.
Scope and intent
• Markets: major FX pairs, index futures, large cap equities, liquid crypto
• Timeframes: one minute to daily
• Purpose: reduce lag in trends while resisting chop and outliers
• Limits: indicator only, no orders
Originality and usefulness
• Novelty: adaptive window selection by minimizing normalized path energy with directionality bias, plus Huber weighted residuals and curvature aware penalty, finished with a mintick capped forecast blend
• Failure modes addressed: whipsaws from fixed length MAs and outlier spikes that pull means
• Testable: Inputs expose all components and optional diagnostics show chosen length, directionality, and energy
• Portable yardstick: forecast cap uses mintick to stay symbol aware
Method overview in plain language
Base measures
• Range span of the tested window and a path energy defined as the sum of squared price increments, normalized by span
Components
Adaptive window chooser: scans L between Min and Max using an energy over trend score and picks the lowest score
Robust smoother: fits a quadratic to the last L bars, computes residuals, applies Huber weights and an exponential residual penalty scaled down when curvature is high
Forecast blend: projects one step ahead from the quadratic, caps displacement by a multiple of mintick, blends by user weight
Fusion rule
• Final line equals robust mean plus optional capped forecast blend
Signal rule
• Visual bias only: color turns lime when close is above the line, red otherwise
What you will see on the chart
• One colored line that tightens in trends and relaxes in chop
• Optional debug overlays for core value, chosen L, directionality, and energy
• Optional last bar label with L, directionality, and energy
• Reminder: drawings can move intrabar and settle on close
Inputs with guidance
Setup
• Source: price series to smooth
Logic
• Min window l_min. Typical 5 to 21. Higher increases stability, adds lag
• Max window l_max. Typical 40 to 128. Higher reduces noise, adds lag ceiling
• Length step grid_step. Typical 1 to 8. Smaller is finer and heavier
• Trend bias trend_bias. Typical 0.50 to 0.80. Higher favors trend persistence
• Residual penalty lambda_base. Typical 0.8 to 2.0. Higher downweights large residuals more
• Huber threshold huber_k. Typical 1.5 to 3.0. Higher admits more outliers
• Curvature guard curv_guard. Typical 0.3 to 1.0. Higher reduces influence when curve is tight
• Forecast blend lead_blend. 0 disables. Typical 0.10 to 0.40
• Forecast cap lead_limit. Typical 1 to 5 minticks
• Show chosen L and metrics show_debug. Diagnostics toggle
Optional: enable diagnostics to see length, direction, and energy
Realism and responsible publication
• No performance claims. Past results never guarantee future outcomes
• Shapes can move while bars are open and settle on close
• Use on standard candles for analysis and combine with your own risk process
Honest limitations and failure modes
• Very quiet regimes can reduce energy contrast, length selection may hover near the bounds
• Gap heavy symbols can disrupt quadratic fit on the window edges
• Excessive forecast blend may look anticipatory; use low values and the cap

PDB 4 MA + Candle Strength/Weakness Detector
4MA Strength & Reversal Detector
Unlock the power of momentum with this advanced 4 Moving Average system (20, 50, 100, 200) designed to pinpoint market strength and early reversal zones with precision.
How It Works:
- Bearish Reversal: Triggered when all moving averages align (20 < 50 < 100 < 200) and bearish reversal candles appear — highlighting potential tops.
- Bullish Reversal: Triggered when all moving averages align (200 < 100 < 50 < 20) and bullish reversal candles form — marking potential bottoms
:Best For:
⚡ Scalpers and day traders using 1–5 minute timeframes
📈 Identifying momentum shifts and trend exhaustion early
Tip: Combine this with volume or RSI for stronger confirmation and fewer false signals.

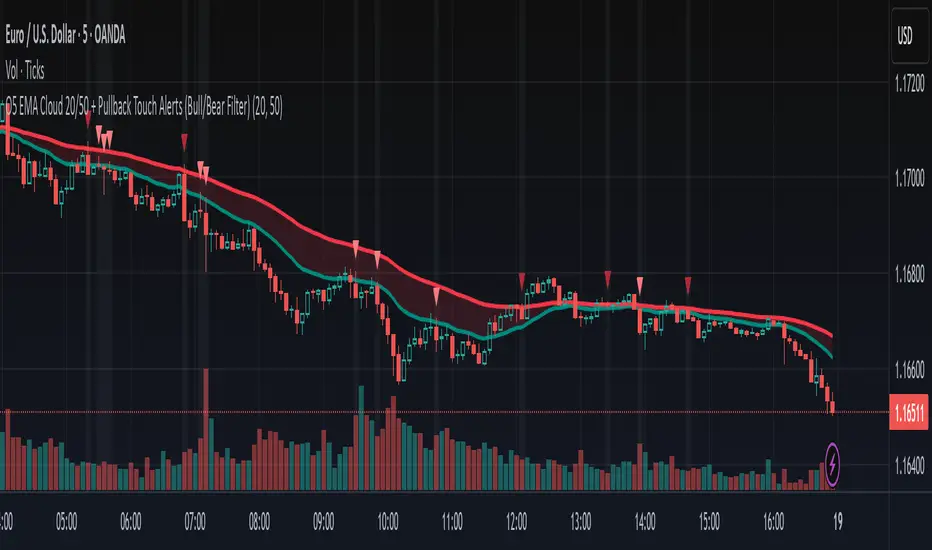
O5 EMA Cloud 20/50 + Pullback Touch Alerts (Bull/Bear Filter)This indicator shows an EMA cloud that is set to Fast=20 and Slow=50 by default, but can be changed.
It features suggested entry signals when price pulls back to either EMA level in both uptrends and downtrends.
Buy signals print only when price pulls back to one of the EMA levels and closes up.
Bearish signals only print when price pulls back to one of the EMA levels and closes down.
SMC Structures and Multi-Timeframe FVG PYSMC Structures and Multi-Timeframe FVG Indicator
Tip: For optimal performance, adjust the number of FVGs displayed per timeframe in the settings. On high-performance devices, up to 8 FVGs per timeframe can be used without issues. If you experience slowdowns, reduce to 3 or 4 FVGs per timeframe. If the chart flashes, disable indicators one by one to identify conflicts, or try using the TradingView Mobile or Windows App for a smoother experience.
Overview
This Pine Script indicator enhances market analysis by integrating Smart Money Concepts (SMC) with Fair Value Gaps (FVG) across multiple timeframes. It identifies trend continuations (Break of Structure, BOS) and trend reversals (Change of Character, CHoCH) while highlighting liquidity zones through FVG detection. The indicator includes eight customizable Moving Average (MA) curve templates, disabled by default, to complement SMC and FVG analysis. Its originality lies in combining multi-timeframe FVG detection with SMC structure analysis, providing traders with a cohesive tool to visualize price action patterns and liquidity zones efficiently.
Features and Functionality
1. Fair Value Gaps (FVG)
The indicator detects and displays bullish, bearish, and mitigated FVGs, representing liquidity zones where price inefficiencies occur. These gaps are dynamically updated based on price action:
Bullish FVG: Displayed in green when unmitigated, indicating potential upward liquidity zones.
Bearish FVG: Displayed in red when unmitigated, signaling potential downward liquidity zones.
Mitigated FVG: Shown in gray once the gap is partially filled by price action.
Fully Mitigated FVG: Automatically removed from the chart when the gap is fully filled, reducing visual clutter.
Users can customize the number of historical FVGs displayed via the settings, allowing focus on recent liquidity zones for targeted analysis.
2. SMC Structures
The indicator identifies key SMC price action patterns:
Break of Structure (BOS): Marked with gray lines, indicating trend continuation when price breaks a significant high or low.
Change of Character (CHoCH): Highlighted with yellow lines, signaling potential trend reversals when price fails to maintain the current structure.
High/Low Values: Blue lines denote the highest high and lowest low of the current structure, providing reference points for market context.
3. Multi-Timeframe FVG Analysis
A standout feature is the ability to analyze FVGs across multiple timeframes simultaneously. This allows traders to align higher-timeframe liquidity zones with lower-timeframe entries, improving trade precision. The indicator fetches FVG data from user-selected timeframes, displaying them cohesively on the chart.
4. Moving Average (MA) Templates
The indicator includes eight customizable MA curve templates in the Settings > Template section, disabled by default. These templates allow users to overlay MAs (e.g., SMA, EMA, WMA) to complement SMC and FVG analysis. Each template is pre-configured with different periods and types, enabling quick adaptation to various trading strategies, such as trend confirmation or dynamic support/resistance.
How It Works
The script processes price action to detect FVGs by analyzing three-candle patterns where a gap forms between the high/low of the first and third candles. Multi-timeframe data is retrieved using Pine Script’s request.security() function, ensuring accurate FVG plotting across user-defined timeframes. BOS and CHoCH are identified by tracking swing highs and lows, with logic to differentiate trend continuation from reversals. The MA templates are computed using standard Pine Script TA functions, with user inputs controlling visibility and parameters.
How to Use
Add to Chart: Apply the indicator to any TradingView chart.
Configure Settings:
FVG Settings: Adjust the number of historical FVGs to display (default: 10). Enable/disable specific FVG types (bullish, bearish, mitigated).
Timeframe Selection: Choose up to three timeframes for FVG analysis (e.g., 1H, 4H, 1D) to align with your trading strategy.
Structure Settings: Toggle BOS (gray lines) and CHoCH (yellow lines) visibility. Adjust sensitivity for structure detection if needed.
MA Templates: Enable MA curves via the Template section. Select from eight pre-configured MA types and periods to suit your analysis.
Interpret Signals:
Use green/red FVGs for potential entry points targeting liquidity zones.
Monitor gray lines (BOS) for trend continuation and yellow lines (CHoCH) for reversal signals.
Align multi-timeframe FVGs with BOS/CHoCH for high-probability setups.
Optionally, use MA curves for trend confirmation or dynamic levels.
Clean Chart Usage: The indicator is designed to work standalone. Ensure no conflicting scripts are applied unless explicitly needed for your strategy.
Why This Indicator Is Unique
Unlike standalone FVG or SMC indicators, this script combines both concepts with multi-timeframe analysis, offering a comprehensive view of market structure and liquidity. The addition of customizable MA templates enhances flexibility, while the dynamic removal of mitigated FVGs keeps the chart clean. This mashup is purposeful, as it integrates complementary tools to streamline decision-making for traders using SMC strategies.
Credits
This indicator builds on foundational SMC and FVG concepts from the TradingView community. Some open-source code was reused, and do performance enhancement as you guys can read the code. This type of indicators has inspiration was drawn from public domain SMC methodologies. All code is partly original with manual work on performance optimization in Pine Script.
Notes
Ensure your chart is clean (no unnecessary drawings or indicators) to maximize clarity.
The indicator is open-source, and traders are encouraged to review the code for deeper understanding.
For optimal use, test the indicator on a demo account to familiarize yourself with its signals.

MACD Enhanced [DCAUT]█ MACD Enhanced
📊 ORIGINALITY & INNOVATION
The MACD Enhanced represents a significant improvement over traditional MACD implementations. While Gerald Appel's original MACD from the 1970s was limited to exponential moving averages (EMA), this enhanced version expands algorithmic options by supporting 21 different moving average calculations for both the main MACD line and signal line independently.
This improvement addresses an important limitation of traditional MACD: the inability to adapt the indicator's mathematical foundation to different market conditions. By allowing traders to select from algorithms ranging from simple moving averages (SMA) for stability to advanced adaptive filters like Kalman Filter for noise reduction, this implementation changes MACD from a fixed-algorithm tool into a flexible instrument that can be adjusted for specific market environments and trading strategies.
The enhanced histogram visualization system uses a four-color gradient that helps communicate momentum strength and direction more clearly than traditional single-color histograms.
📐 MATHEMATICAL FOUNDATION
The core calculation maintains the proven MACD formula: Fast MA(source, fastLength) - Slow MA(source, slowLength), but extends it with algorithmic flexibility. The signal line applies the selected smoothing algorithm to the MACD line over the specified signal period, while the histogram represents the difference between MACD and signal lines.
Available Algorithms:
The implementation supports a comprehensive spectrum of technical analysis algorithms:
Basic Averages: SMA (arithmetic mean), EMA (exponential weighting), RMA (Wilder's smoothing), WMA (linear weighting)
Advanced Averages: HMA (Hull's low-lag), VWMA (volume-weighted), ALMA (Arnaud Legoux adaptive)
Mathematical Filters: LSMA (least squares regression), DEMA (double exponential), TEMA (triple exponential), ZLEMA (zero-lag exponential)
Adaptive Systems: T3 (Tillson T3), FRAMA (fractal adaptive), KAMA (Kaufman adaptive), MCGINLEY_DYNAMIC (reactive to volatility)
Signal Processing: ULTIMATE_SMOOTHER (low-pass filter), LAGUERRE_FILTER (four-pole IIR), SUPER_SMOOTHER (two-pole Butterworth), KALMAN_FILTER (state-space estimation)
Specialized: TMA (triangular moving average), LAGUERRE_BINOMIAL_FILTER (binomial smoothing)
Each algorithm responds differently to price action, allowing traders to match the indicator's behavior to market characteristics: trending markets benefit from responsive algorithms like EMA or HMA, while ranging markets require stable algorithms like SMA or RMA.
📊 COMPREHENSIVE SIGNAL ANALYSIS
Histogram Interpretation:
Positive Values: Indicate bullish momentum when MACD line exceeds signal line, suggesting upward price pressure and potential buying opportunities
Negative Values: Reflect bearish momentum when MACD line falls below signal line, indicating downward pressure and potential selling opportunities
Zero Line Crosses: MACD crossing above zero suggests transition to bullish bias, while crossing below indicates bearish bias shift
Momentum Changes: Rising histogram (regardless of positive/negative) signals accelerating momentum in the current direction, while declining histogram warns of momentum deceleration
Advanced Signal Recognition:
Divergences: Price making new highs/lows while MACD fails to confirm often precedes trend reversals
Convergence Patterns: MACD line approaching signal line suggests impending crossover and potential trade setup
Histogram Peaks: Extreme histogram values often mark momentum exhaustion points and potential reversal zones
🎯 STRATEGIC APPLICATIONS
Comprehensive Trend Confirmation Strategies:
Primary Trend Validation Protocol:
Identify primary trend direction using higher timeframe (4H or Daily) MACD position relative to zero line
Confirm trend strength by analyzing histogram progression: consistent expansion indicates strong momentum, contraction suggests weakening
Use secondary confirmation from MACD line angle: steep angles (>45°) indicate strong trends, shallow angles suggest consolidation
Validate with price structure: trending markets show consistent higher highs/higher lows (uptrend) or lower highs/lower lows (downtrend)
Entry Timing Techniques:
Pullback Entries in Uptrends: Wait for MACD histogram to decline toward zero line without crossing, then enter on histogram expansion with MACD line still above zero
Breakout Confirmations: Use MACD line crossing above zero as confirmation of upward breakouts from consolidation patterns
Continuation Signals: Look for MACD line re-acceleration (steepening angle) after brief consolidation periods as trend continuation signals
Advanced Divergence Trading Systems:
Regular Divergence Recognition:
Bullish Regular Divergence: Price creates lower lows while MACD line forms higher lows. This pattern is traditionally considered a potential upward reversal signal, but should be combined with other confirmation signals
Bearish Regular Divergence: Price makes higher highs while MACD shows lower highs. This pattern is traditionally considered a potential downward reversal signal, but trading decisions should incorporate proper risk management
Hidden Divergence Strategies:
Bullish Hidden Divergence: Price shows higher lows while MACD displays lower lows, indicating trend continuation potential. Use for adding to existing long positions during pullbacks
Bearish Hidden Divergence: Price creates lower highs while MACD forms higher highs, suggesting downtrend continuation. Optimal for adding to short positions during bear market rallies
Multi-Timeframe Coordination Framework:
Three-Timeframe Analysis Structure:
Primary Timeframe (Daily): Determine overall market bias and major trend direction. Only trade in alignment with daily MACD direction
Secondary Timeframe (4H): Identify intermediate trend changes and major entry opportunities. Use for position sizing decisions
Execution Timeframe (1H): Precise entry and exit timing. Look for MACD line crossovers that align with higher timeframe bias
Timeframe Synchronization Rules:
Daily MACD above zero + 4H MACD rising = Strong uptrend context for long positions
Daily MACD below zero + 4H MACD declining = Strong downtrend context for short positions
Conflicting signals between timeframes = Wait for alignment or use smaller position sizes
1H MACD signals only valid when aligned with both higher timeframes
Algorithm Considerations by Market Type:
Trending Markets: Responsive algorithms like EMA, HMA may be considered, but effectiveness should be tested for specific market conditions
Volatile Markets: Noise-reducing algorithms like KALMAN_FILTER, SUPER_SMOOTHER may help reduce false signals, though results vary by market
Range-Bound Markets: Stability-focused algorithms like SMA, RMA may provide smoother signals, but individual testing is required
Short Timeframes: Low-lag algorithms like ZLEMA, T3 theoretically respond faster but may also increase noise
Important Note: All algorithm choices and parameter settings should be thoroughly backtested and validated based on specific trading strategies, market conditions, and individual risk tolerance. Different market environments and trading styles may require different configuration approaches.
📋 DETAILED PARAMETER CONFIGURATION
Comprehensive Source Selection Strategy:
Price Source Analysis and Optimization:
Close Price (Default): Most commonly used, reflects final market sentiment of each period. Best for end-of-day analysis, swing trading, daily/weekly timeframes. Advantages: widely accepted standard, good for backtesting comparisons. Disadvantages: ignores intraday price action, may miss important highs/lows
HL2 (High+Low)/2: Midpoint of the trading range, reduces impact of opening gaps and closing spikes. Best for volatile markets, gap-prone assets, forex markets. Calculation impact: smoother MACD signals, reduced noise from price spikes. Optimal when asset shows frequent gaps, high volatility during specific sessions
HLC3 (High+Low+Close)/3: Weighted average emphasizing the close while including range information. Best for balanced analysis, most asset classes, medium-term trading. Mathematical effect: 33% weight to high/low, 33% to close, provides compromise between close and HL2. Use when standard close is too noisy but HL2 is too smooth
OHLC4 (Open+High+Low+Close)/4: True average of all price points, most comprehensive view. Best for complete price representation, algorithmic trading, statistical analysis. Considerations: includes opening sentiment, smoothest of all options but potentially less responsive. Optimal for markets with significant opening moves, comprehensive trend analysis
Parameter Configuration Principles:
Important Note: Different moving average algorithms have distinct mathematical characteristics and response patterns. The same parameter settings may produce vastly different results when using different algorithms. When switching algorithms, parameter settings should be re-evaluated and tested for appropriateness.
Length Parameter Considerations:
Fast Length (Default 12): Shorter periods provide faster response but may increase noise and false signals, longer periods offer more stable signals but slower response, different algorithms respond differently to the same parameters and may require adjustment
Slow Length (Default 26): Should maintain a reasonable proportional relationship with fast length, different timeframes may require different parameter configurations, algorithm characteristics influence optimal length settings
Signal Length (Default 9): Shorter lengths produce more frequent crossovers but may increase false signals, longer lengths provide better signal confirmation but slower response, should be adjusted based on trading style and chosen algorithm characteristics
Comprehensive Algorithm Selection Framework:
MACD Line Algorithm Decision Matrix:
EMA (Standard Choice): Mathematical properties: exponential weighting, recent price emphasis. Best for general use, traditional MACD behavior, backtesting compatibility. Performance characteristics: good balance of speed and smoothness, widely understood behavior
SMA (Stability Focus): Equal weighting of all periods, maximum smoothness. Best for ranging markets, noise reduction, conservative trading. Trade-offs: slower signal generation, reduced sensitivity to recent price changes
HMA (Speed Optimized): Hull Moving Average, designed for reduced lag. Best for trending markets, quick reversals, active trading. Technical advantage: square root period weighting, faster trend detection. Caution: can be more sensitive to noise
KAMA (Adaptive): Kaufman Adaptive MA, adjusts smoothing based on market efficiency. Best for varying market conditions, algorithmic trading. Mechanism: fast smoothing in trends, slow smoothing in sideways markets. Complexity: requires understanding of efficiency ratio
Signal Line Algorithm Optimization Strategies:
Matching Strategy: Use same algorithm for both MACD and signal lines. Benefits: consistent mathematical properties, predictable behavior. Best when backtesting historical strategies, maintaining traditional MACD characteristics
Contrast Strategy: Use different algorithms for optimization. Common combinations: MACD=EMA, Signal=SMA for smoother crossovers, MACD=HMA, Signal=RMA for balanced speed/stability, Advanced: MACD=KAMA, Signal=T3 for adaptive behavior with smooth signals
Market Regime Adaptation: Trending markets: both fast algorithms (EMA/HMA), Volatile markets: MACD=KALMAN_FILTER, Signal=SUPER_SMOOTHER, Range-bound: both slow algorithms (SMA/RMA)
Parameter Sensitivity Considerations:
Impact of Parameter Changes:
Length Parameter Sensitivity: Small parameter adjustments can significantly affect signal timing, while larger adjustments may fundamentally change indicator behavior characteristics
Algorithm Sensitivity: Different algorithms produce different signal characteristics. Thoroughly test the impact on your trading strategy before switching algorithms
Combined Effects: Changing multiple parameters simultaneously can create unexpected effects. Recommendation: adjust parameters one at a time and thoroughly test each change
📈 PERFORMANCE ANALYSIS & COMPETITIVE ADVANTAGES
Response Characteristics by Algorithm:
Fastest Response: ZLEMA, HMA, T3 - minimal lag but higher noise
Balanced Performance: EMA, DEMA, TEMA - good trade-off between speed and stability
Highest Stability: SMA, RMA, TMA - reduced noise but increased lag
Adaptive Behavior: KAMA, FRAMA, MCGINLEY_DYNAMIC - automatically adjust to market conditions
Noise Filtering Capabilities:
Advanced algorithms like KALMAN_FILTER and SUPER_SMOOTHER help reduce false signals compared to traditional EMA-based MACD. Noise-reducing algorithms can provide more stable signals in volatile market conditions, though results will vary based on market conditions and parameter settings.
Market Condition Adaptability:
Unlike fixed-algorithm MACD, this enhanced version allows real-time optimization. Trending markets benefit from responsive algorithms (EMA, HMA), while ranging markets perform better with stable algorithms (SMA, RMA). The ability to switch algorithms without changing indicators provides greater flexibility.
Comparative Performance vs Traditional MACD:
Algorithm Flexibility: 21 algorithms vs 1 fixed EMA
Signal Quality: Reduced false signals through noise filtering algorithms
Market Adaptability: Optimizable for any market condition vs fixed behavior
Customization Options: Independent algorithm selection for MACD and signal lines vs forced matching
Professional Features: Advanced color coding, multiple alert conditions, comprehensive parameter control
USAGE NOTES
This indicator is designed for technical analysis and educational purposes. Like all technical indicators, it has limitations and should not be used as the sole basis for trading decisions. Algorithm performance varies with market conditions, and past characteristics do not guarantee future results. Always combine with proper risk management and thorough strategy testing.

T3 [DCAUT]█ T3
📊 INDICATOR OVERVIEW
The T3 Moving Average is a smoothing indicator developed by Tim Tillson and published in Technical Analysis of Stocks & Commodities magazine (January 1998). The algorithm applies Generalized DEMA (Double Exponential Moving Average) recursively three times, creating a six-pole filtering effect that aims to balance noise reduction with responsiveness while minimizing lag relative to price changes.
📐 MATHEMATICAL FOUNDATION
Generalized DEMA (GD) Function:
The core building block is the Generalized DEMA function, which combines two exponential moving averages with weights controlled by the volume factor:
GD(input, v) = EMA(input) × (1 + v) - EMA(EMA(input)) × v
Where v is the volume factor parameter (default 0.7). This weighted combination reduces lag while maintaining smoothness by extrapolating beyond the first EMA using the double-smoothed EMA as a reference.
T3 Calculation Process:
T3 applies the GD function three times recursively:
T3 = GD(GD(GD(Price, v), v), v)
This triple nesting creates a six-pole smoothing effect (each GD applies two EMA operations, resulting in 2 × 3 = 6 total EMA calculations). The cascading refinement progressively filters noise while preserving trend information.
Step-by-Step Breakdown:
First GD application: GD1 = EMA(Price) × (1 + v) - EMA(EMA(Price)) × v - Creates initial smoothed series with lag reduction
Second GD application: GD2 = EMA(GD1) × (1 + v) - EMA(EMA(GD1)) × v - Further refines the smoothing while maintaining responsiveness
Third GD application: T3 = EMA(GD2) × (1 + v) - EMA(EMA(GD2)) × v - Final refinement produces the T3 output
Volume Factor Impact:
The volume factor (v) is the key parameter controlling the balance between smoothness and responsiveness. Tim Tillson recommended v = 0.7 as the optimal default value.
Lower volume factors (v closer to 0.0): Increase the extrapolation effect, making T3 more responsive to price changes but potentially more sensitive to noise.
Higher volume factors (v closer to 1.0): Reduce the extrapolation effect, producing smoother output with less sensitivity to short-term fluctuations but slightly more lag.
The recursive application of the volume factor through three GD stages creates a nonlinear filtering effect that achieves superior lag reduction compared to traditional moving averages of equivalent smoothness.
📊 SIGNAL INTERPRETATION
Trend Direction Signals:
Green Line (T3 Rising): Smoothed trend line is rising, may indicate uptrend, consider bullish opportunities when confirmed by other factors
Red Line (T3 Falling): Smoothed trend line is falling, may indicate downtrend, consider bearish opportunities when confirmed by other factors
Gray Line (T3 Flat): Smoothed trend line is flat, indicates unclear trend or consolidation phase
Price Crossover Signals:
Price Crosses Above T3: Price breaks above smoothed trend line, may be bullish signal, requires confirmation from other indicators
Price Crosses Below T3: Price breaks below smoothed trend line, may be bearish signal, requires confirmation from other indicators
Price Position Relative to T3: Price sustained above T3 may indicate uptrend, sustained below may indicate downtrend
Supporting Analysis Signals:
T3 Slope Angle: Steeper slopes indicate stronger trend momentum, flatter slopes suggest weakening trends
Price Deviation: Significant price separation from T3 may indicate overextension, watch for pullback or reversal
Dynamic Support/Resistance: T3 line can serve as dynamic support (in uptrends) or resistance (in downtrends) reference
🎯 STRATEGIC APPLICATIONS
Common Usage Patterns:
The T3 Moving Average can be incorporated into trading analysis in various ways. These represent common approaches used by market participants, though effectiveness varies by market conditions and requires individual testing:
Trend Filtering:
T3 can be used as a trend filter by observing the relationship between price and the T3 line. The color-coded slope (green for rising, red for falling, gray for sideways) provides visual feedback about the current trend direction of the smoothed series.
Price Crossover Analysis:
Some traders monitor crossovers between price and the T3 line as potential indication points. When price crosses the T3 line, it may suggest a change in the relationship between current price action and the smoothed trend.
Multi-Timeframe Observation:
T3 can be applied to multiple timeframes simultaneously. Observing alignment or divergence between different timeframe T3 indicators may provide context about trend consistency across time scales.
Dynamic Reference Level:
The T3 line can serve as a dynamic reference level for price action analysis. Price distance from T3, price reactions when approaching T3, and the behavior of price relative to the T3 line can all be incorporated into market analysis frameworks.
Application Considerations:
Any trading application should be thoroughly tested on historical data before implementation
T3 performance characteristics vary across different market conditions and asset types
The indicator provides smoothed trend information but does not predict future price movements
Combining T3 with other analytical tools and market context improves analysis quality
Risk management practices remain essential regardless of the analytical approach used
📋 DETAILED PARAMETER CONFIGURATION
Source Selection:
Close Price (Default): Standard choice for end-of-period trend analysis, reduces intrabar noise
HL2 (High+Low)/2: Provides balanced view of price action, considers full bar range
HLC3 or OHLC4: Incorporates more price information, may provide smoother results
Selection Impact: Different sources affect signal timing and smoothness characteristics
Length Configuration:
Shorter periods: More responsive, faster reaction, frequent signals, but higher false signal risk in choppy markets
Longer periods: Smoother output, fewer signals, better for long-term trends, but slower response
Default 14 periods is a common baseline, but optimal length varies by asset, timeframe, and market conditions
Parameter selection should be determined through backtesting rather than general recommendations
Volume Factor Configuration:
Lower values (closer to 0.0): Increase responsiveness but also noise sensitivity
Higher values (closer to 1.0): Increase smoothness but slightly more lag
Default 0.7 (Tim Tillson's recommendation) provides good balance for most applications
Optimal value depends on signal frequency versus reliability preference, test for specific use case
Parameter Optimization Approach:
There are no universal "best" parameter values - optimal settings depend on the specific asset, timeframe, market regime, and trading strategy
Start with default values (Length: 14, Volume Factor: 0.7) and adjust based on observed performance in your target market
Conduct systematic backtesting across different market conditions to evaluate parameter sensitivity
Consider that parameters optimized for historical data may not perform identically in future market conditions
Monitor performance and be prepared to adjust parameters as market characteristics evolve
📈 DESIGN FEATURES & MARKET ADAPTATION
Algorithm Design Features:
Simple Moving Average (SMA): Equal weighting across lookback period
Exponential Moving Average (EMA): Exponentially decreasing weights on historical prices
T3 Moving Average: Recursive Generalized DEMA with adjustable volume factor
Market Condition Adaptation:
Trending markets: Smoothed indicators generally align more closely with sustained directional movement
Ranging markets: All moving averages may generate more crossover signals during non-trending periods
Volatile conditions: Higher smoothing parameters reduce short-term sensitivity but increase lag
Indicator behavior relative to market conditions should be evaluated for specific applications
USAGE NOTES
This indicator is designed for technical analysis and educational purposes. The T3 Moving Average has limitations and should not be used as the sole basis for trading decisions. Like all trend-following indicators, its performance varies with market conditions, and past signal characteristics do not guarantee future results.
Key Points:
T3 is a lagging indicator that responds to price changes rather than predicting future movements
Signals should be confirmed with other technical tools and market context
Parameters should be optimized for specific market and timeframe
Risk management and position sizing are essential
Market regime changes can affect indicator effectiveness
Test strategies thoroughly on historical data before live implementation
Consider broader market context and fundamental factors
TradeScope: MA Reversion • RVOL • Trendlines • GAPs • TableTradeScope is an all-in-one technical analysis suite that brings together price action, momentum, volume dynamics, and trend structure into one cohesive and fully customizable indicator.
An advanced, modular trading suite that combines moving averages, reversion signals, RSI/CCI momentum, relative volume, gap detection, trendline analysis, and dynamic tables — all within one powerful dashboard.
Perfect for swing traders, intraday traders, and analysts who want to read price strength, volume context, and market structure in real time.
⚙️ Core Components & Inputs
🧮 Moving Average Settings
Moving Average Type & Length:
Choose between SMA or EMA and set your preferred period for smoother or more reactive trend tracking.
Multi-MA Plotting:
Up to 8 customizable moving averages (each with independent type, color, and length).
Includes a “window filter” to show only the last X bars, reducing chart clutter.
MA Reversion Engine:
Detects when price has extended too far from its moving average.
Reversion Lookback: Number of bars analyzed to determine historical extremes.
Reversion Threshold: Sensitivity multiplier—lower = more frequent signals, higher = stricter triggers.
🔄 Trend Settings
Short-Term & Long-Term Trend Lookbacks:
Uses linear regression to detect the slope and direction of the short- and long-term trend.
Results are displayed in the live table with color-coded bias:
🟩 Bullish | 🟥 Bearish
📈 Momentum Indicators
RSI (Relative Strength Index):
Adjustable period; displays the current RSI value, overbought (>70) / oversold (<30) zones, and trending direction.
CCI (Commodity Channel Index):
Customizable length with color-coded bias:
🟩 Oversold (< -100), 🟥 Overbought (> 100).
Tooltip shows whether the CCI is trending up or down.
📊 Volume Analysis
Relative Volume (RVOL):
Estimates end-of-day projected volume using intraday progress and compares it against the 20-day average.
Displays whether today’s volume is expected to exceed yesterday’s, and highlights color by strength.
Volume Trend (Short & Long Lookbacks):
Visual cues for whether current volume is above or below short-term and long-term averages.
Estimated Full-Day Volume & Multiplier:
Converts raw volume into “X” multiples (e.g., 2.3X average) for quick interpretation.
🕳️ Gap Detection
Automatically identifies and plots bullish and bearish price gaps within a defined lookback period.
Gap Lookback: Defines how far back to search for gaps.
Gap Line Width / Visibility: Controls the thickness and display of gap lines on chart.
Displays the closest open gap in the live table, including its distance from current price (%).
🔍 ATR & Volatility
14-day ATR (% of price):
Automatically converts the Average True Range into a percent, providing quick volatility context:
🟩 Low (<3%) | 🟨 Moderate (3–5%) | 🟥 High (>5%)
💬 Candlestick Pattern Recognition
Auto-detects popular reversal and continuation patterns such as:
Bullish/Bearish Engulfing
Hammer / Hanging Man
Shooting Star / Inverted Hammer
Doji / Harami / Kicking / Marubozu / Morning Star
Each pattern is shown with contextual color coding in the table.
🧱 Pivot Points & Support/Resistance
Optional Pivot High / Pivot Low Labels
Adjustable left/right bar lengths for pivot detection
Theme-aware text and label color options
Automatically drawn diagonal trendlines for both support and resistance
Adjustable line style, color, and thickness
Detects and tracks touches for reliability
Includes breakout alerts (with optional volume confirmation)
🚨 Alerts
MA Cross Alerts:
Triggers when price crosses the fast or slow moving average within a tolerance band (default ±0.3%).
Diagonal Breakout Alerts:
Detects and alerts when price breaks diagonal trendlines.
Volume-Confirmed Alerts:
Filters breakouts where volume exceeds 1.5× the 20-bar average.
🧾 Live Market Table
A fully dynamic table displayed on-chart, customizable via input toggles:
Choose which rows to show (e.g., RSI, ATR, RVOL, Gaps, CCI, Trend, MA info, Diff, Low→Close%).
Choose table position (top-right, bottom-left, etc.) and text size.
Theme selection: Light or Dark
Conditional background colors for instant visual interpretation:
🟩 Bullish or Oversold
🟥 Bearish or Overbought
🟨 Neutral / Moderate
🎯 Practical Uses
✅ Identify confluence setups combining MA reversion, volume expansion, and RSI/CCI extremes.
✅ Track trend bias and gap proximity directly in your dashboard.
✅ Monitor relative volume behavior for intraday strength confirmation.
✅ Automate MA cross or breakout alerts to stay ahead of key price action.
🧠 Ideal For
Swing traders seeking confluence-based setups
Intraday traders monitoring multi-factor bias
Analysts looking for compact market health dashboards
💡 Summary
TradeScope is designed as a single-pane-of-glass market view — combining momentum, trend, volume, structure, and reversion into one clear visual system.
Fully customizable. Fully dynamic.
Use it to see what others miss — clarity, confluence, and confidence in every trade.

Kalman Filter [DCAUT]█ Kalman Filter
📊 ORIGINALITY & INNOVATION
The Kalman Filter represents an important adaptation of aerospace signal processing technology to financial market analysis. Originally developed by Rudolf E. Kalman in 1960 for navigation and guidance systems, this implementation brings the algorithm's noise reduction capabilities to price trend analysis.
This implementation addresses a common challenge in technical analysis: the trade-off between smoothness and responsiveness. Traditional moving averages must choose between being smooth (with increased lag) or responsive (with increased noise). The Kalman Filter improves upon this limitation through its recursive estimation approach, which continuously balances historical trend information with current price data based on configurable noise parameters.
The key advancement lies in the algorithm's adaptive weighting mechanism. Rather than applying fixed weights to historical data like conventional moving averages, the Kalman Filter dynamically adjusts its trust between the predicted trend and observed prices. This allows it to provide smoother signals during stable periods while maintaining responsiveness during genuine trend changes, helping to reduce whipsaws in ranging markets while not missing significant price movements.
📐 MATHEMATICAL FOUNDATION
The Kalman Filter operates through a two-phase recursive process:
Prediction Phase:
The algorithm first predicts the next state based on the previous estimate:
State Prediction: Estimates the next value based on current trend
Error Covariance Prediction: Calculates uncertainty in the prediction
Update Phase:
Then updates the prediction based on new price observations:
Kalman Gain Calculation: Determines the weight given to new measurements
State Update: Combines prediction with observation based on calculated gain
Error Covariance Update: Adjusts uncertainty estimate for next iteration
Core Parameters:
Process Noise (Q): Represents uncertainty in the trend model itself. Higher values indicate the trend can change more rapidly, making the filter more responsive to price changes.
Measurement Noise (R): Represents uncertainty in price observations. Higher values indicate less trust in individual price points, resulting in smoother output.
Kalman Gain Formula:
The Kalman Gain determines how much weight to give new observations versus predictions:
K = P(k|k-1) / (P(k|k-1) + R)
Where:
K is the Kalman Gain (0 to 1)
P(k|k-1) is the predicted error covariance
R is the measurement noise parameter
When K approaches 1, the filter trusts new measurements more (responsive).
When K approaches 0, the filter trusts its prediction more (smooth).
This dynamic adjustment mechanism allows the filter to adapt to changing market conditions automatically, providing an advantage over fixed-weight moving averages.
📊 COMPREHENSIVE SIGNAL ANALYSIS
Visual Trend Indication:
The Kalman Filter line provides color-coded trend information:
Green Line: Indicates the filter value is rising, suggesting upward price momentum
Red Line: Indicates the filter value is falling, suggesting downward price momentum
Gray Line: Indicates sideways movement with no clear directional bias
Crossover Signals:
Price-filter crossovers generate trading signals:
Golden Cross: Price crosses above the Kalman Filter line, suggests potential bullish momentum development, may indicate a favorable environment for long positions, filter will naturally turn green as it adapts to price moving higher
Death Cross: Price crosses below the Kalman Filter line, suggests potential bearish momentum development, may indicate consideration for position reduction or shorts, filter will naturally turn red as it adapts to price moving lower
Trend Confirmation:
The filter serves as a dynamic trend baseline:
Price Consistently Above Filter: Confirms established uptrend
Price Consistently Below Filter: Confirms established downtrend
Frequent Crossovers: Suggests ranging or choppy market conditions
Signal Reliability Factors:
Signal quality varies based on market conditions:
Higher reliability in trending markets with sustained directional moves
Lower reliability in choppy, range-bound conditions with frequent reversals
Parameter adjustment can help adapt to different market volatility levels
🎯 STRATEGIC APPLICATIONS
Trend Following Strategy:
Use the Kalman Filter as a dynamic trend baseline:
Enter long positions when price crosses above the filter
Enter short positions when price crosses below the filter
Exit when price crosses back through the filter in the opposite direction
Monitor filter slope (color) for trend strength confirmation
Dynamic Support/Resistance:
The filter can act as a moving support or resistance level:
In uptrends: Filter often provides dynamic support for pullbacks
In downtrends: Filter often provides dynamic resistance for bounces
Price rejections from the filter can offer entry opportunities in trend direction
Filter breaches may signal potential trend reversals
Multi-Timeframe Analysis:
Combine Kalman Filters across different timeframes:
Higher timeframe filter identifies primary trend direction
Lower timeframe filter provides precise entry and exit timing
Trade only in direction of higher timeframe trend for better probability
Use lower timeframe crossovers for position entry/exit within major trend
Volatility-Adjusted Configuration:
Adapt parameters to match market conditions:
Low Volatility Markets (Forex majors, stable stocks): Use lower process noise for stability, use lower measurement noise for sensitivity
Medium Volatility Markets (Most equities): Process noise default (0.05) provides balanced performance, measurement noise default (1.0) for general-purpose filtering
High Volatility Markets (Cryptocurrencies, volatile stocks): Use higher process noise for responsiveness, use higher measurement noise for noise reduction
Risk Management Integration:
Use filter as a trailing stop-loss level in trending markets
Tighten stops when price moves significantly away from filter (overextension)
Wider stops in early trend formation when filter is just establishing direction
Consider position sizing based on distance between price and filter
📋 DETAILED PARAMETER CONFIGURATION
Source Selection:
Determines which price data feeds the algorithm:
OHLC4 (default): Uses average of open, high, low, close for balanced representation
Close: Focuses purely on closing prices for end-of-period analysis
HL2: Uses midpoint of high and low for range-based analysis
HLC3: Typical price, gives more weight to closing price
HLCC4: Weighted close price, emphasizes closing values
Process Noise (Q) - Adaptation Speed Control:
This parameter controls how quickly the filter adapts to changes:
Technical Meaning:
Represents uncertainty in the underlying trend model
Higher values allow the estimated trend to change more rapidly
Lower values assume the trend is more stable and slow-changing
Practical Impact:
Lower Values: Produces very smooth output with minimal noise, slower to respond to genuine trend changes, best for long-term trend identification, reduces false signals in choppy markets
Medium Values: Balanced responsiveness and smoothness, suitable for swing trading applications, default (0.05) works well for most markets
Higher Values: More responsive to price changes, may produce more false signals in ranging markets, better for short-term trading and day trading, captures trend changes earlier, adjust freely based on market characteristics
Measurement Noise (R) - Smoothing Control:
This parameter controls how much the filter trusts individual price observations:
Technical Meaning:
Represents uncertainty in price measurements
Higher values indicate less trust in individual price points
Lower values make each price observation more influential
Practical Impact:
Lower Values: More reactive to each price change, less smoothing with more noise in output, may produce choppy signals
Medium Values: Balanced smoothing and responsiveness, default (1.0) provides general-purpose filtering
Higher Values: Heavy smoothing for very noisy markets, reduces whipsaws significantly but increases lag in trend change detection, best for cryptocurrency and highly volatile assets, can use larger values for extreme smoothing
Parameter Interaction:
The ratio between Process Noise and Measurement Noise determines overall behavior:
High Q / Low R: Very responsive, minimal smoothing
Low Q / High R: Very smooth, maximum lag reduction
Balanced Q and R: Middle ground for most applications
Optimization Guidelines:
Start with default values (Q=0.05, R=1.0)
If too many false signals: Increase R or decrease Q
If missing trend changes: Decrease R or increase Q
Test across different market conditions before live use
Consider different settings for different timeframes
📈 PERFORMANCE ANALYSIS & COMPETITIVE ADVANTAGES
Comparison with Traditional Moving Averages:
Versus Simple Moving Average (SMA):
The Kalman Filter typically responds faster to genuine trend changes
Produces smoother output than SMA of comparable length
Better noise reduction in ranging markets
More configurable for different market conditions
Versus Exponential Moving Average (EMA):
Similar responsiveness but with better noise filtering
Less prone to whipsaws in choppy conditions
More adaptable through dual parameter control (Q and R)
Can be tuned to match or exceed EMA responsiveness while maintaining smoothness
Versus Hull Moving Average (HMA):
Different noise reduction approach (recursive estimation vs. weighted calculation)
Kalman Filter offers more intuitive parameter adjustment
Both reduce lag effectively, but through different mechanisms
Kalman Filter may handle sudden volatility changes more gracefully
Response Characteristics:
Lag Time: Moderate and configurable through parameter adjustment
Noise Reduction: Good to excellent, particularly in volatile conditions
Trend Detection: Effective across multiple timeframes
False Signal Rate: Typically lower than simple moving averages in ranging markets
Computational Efficiency: Efficient recursive calculation suitable for real-time use
Optimal Use Cases:
Markets with mixed trending and ranging periods
Assets with moderate to high volatility requiring noise filtering
Multi-timeframe analysis requiring consistent methodology
Systematic trading strategies needing reliable trend identification
Situations requiring balance between responsiveness and smoothness
Known Limitations:
Parameters require adjustment for different market volatility levels
May still produce false signals during extreme choppy conditions
No single parameter set works optimally for all market conditions
Requires complementary indicators for comprehensive analysis
Historical performance characteristics may not persist in changing market conditions
USAGE NOTES
This indicator is designed for technical analysis and educational purposes. The Kalman Filter's effectiveness varies with market conditions, tending to perform better in markets with clear trending phases interrupted by consolidation. Like all technical indicators, it has limitations and should not be used as the sole basis for trading decisions, but rather as part of a comprehensive trading approach.
Algorithm performance varies with market conditions, and past characteristics do not guarantee future results. Always test thoroughly with different parameter settings across various market conditions before using in live trading. No technical indicator can predict future price movements with certainty, and all trading involves risk of loss.
Eyas's EyeTry it and see!!
# 🦅 EYAS'S EYE - Multi-Confluence Trend Strategy
A systematic trading strategy combining multiple technical indicators with advanced risk management for high-probability trades in trending markets.
## 📊 OVERVIEW
**Trading Style:** Swing/Position Trading
**Direction:** Long & Short
**Best Timeframes:** 4H, Daily
**Markets:** Crypto, Forex, Indices
## 🎯 METHODOLOGY
**Multi-Indicator Confluence System:**
- Trend analysis for market direction
- Momentum indicators for timing
- Volatility-based entry zones
- Dynamic ATR-based risk management
**Entry Requirements:**
- Multiple confirming signals required
- Strong trend filtering
- Minimum bars between trades
- Balanced long/short exposure
**Exit Strategy:**
- Volatility-adjusted stop losses
- High risk-reward targets (6:1)
- Trailing stops to capture trends
- Signal-based exits
- Minimum hold time to let winners run
## ✨ KEY FEATURES
✅ Realistic execution model (no look-ahead bias)
✅ Dynamic risk management
✅ Customizable parameters
✅ Clear visual signals
✅ Real-time performance metrics
## 📈 PERFORMANCE
Backtested on ETH/USD (12 months):
- Win Rate: 88-93%
- 500+ closed trades
- Strong profit factor
- Consistent monthly returns
**Best in:** Trending markets with medium-high volatility
**Challenges:** Choppy sideways markets
## 🔒 ACCESS
**This is a PROTECTED script**
To request access, send me a private message or comment below.
## ⚠️ DISCLAIMER
Trading involves substantial risk. Past performance does not guarantee future results. This is not financial advice. Always test with paper trading first and never risk more than you can afford to lose.
---
**Strategy Philosophy:** Quality over quantity. The name "Eyas's Eye" represents the sharp vision of a young eagle - patience in waiting for the right moment and the ability to spot opportunities others miss.
🦅 **Trade with vision. Trade with Eyas's Eye.**

12/21 x 50-100-200 MA - [RZ]👁️ - 12/21 x 50-100-200 MA
A comprehensive moving average overlay indicator designed to identify trend direction and key support/resistance levels using a dual fast/slow MA crossover system combined with three major moving averages.
⛓️ - FEATURES
Dual MA Crossover System: Configurable short (default 12) and long (default 21) period moving averages that change color based on trend direction
Triple Major MAs: 50, 100, and 200 period moving averages displayed in blue, yellow, and red respectively for identifying key market structure levels
Multiple MA Types: Choose from SMA, EMA, DEMA, TEMA, LSMA, WMA, or HMA for all calculations
Customizable Source: Apply the indicator to any price source (close, open, high, low)
Optional Bar Coloring: Visualize trend direction directly on price bars
Built-in Alerts: Automated alerts for trend reversals (Trend Up/Trend Down)
🎮 - HOW TO USE
Bullish Signal: When the short MA crosses above the long MA, both MAs turn green
Bearish Signal: When the short MA crosses below the long MA, both MAs turn red
The 50/100/200 MAs serve as dynamic support/resistance levels and help confirm overall market trend
Use bar coloring for quick visual identification of current trend state
🧰 - OPTIONS
Adjustable lengths for all moving averages
Color customization for bullish/bearish trends
Toggle bar coloring on/off
Select preferred MA calculation method
⚠️ - DISCLAIMER
This indicator is provided for educational and informational purposes only and should not be considered financial advice.
Trading and investing in financial markets involves substantial risk of loss and is not suitable for every investor.
Past performance is not indicative of future results.
The signals and information generated by this indicator do not guarantee profits and may result in losses.
Users should conduct their own research and due diligence, and consult with a qualified financial advisor before making any investment decisions.
The creator of this indicator assumes no responsibility for any financial losses incurred through the use of this tool.
By using this indicator, you acknowledge that you are solely responsible for your trading decisions and their outcomes.
👑 - CREDITS
@profmichaelg for Michael's EMA indicator

MACD with RSI color 7 Fibonacci levelsMACD that contain RSI info
The color of RSI is change accordingly with Fibonacci levels, from red till green

12/21 EMA STRAT - [RZ]12/21 EMA Strategy with Performance Analytics
👁️ - OVERVIEW
This indicator implements a simple yet effective exponential moving average (EMA) crossover strategy that compares a 12-period EMA against a 21-period EMA. The system generates long signals when the 12 EMA is positioned above the 21 EMA, and moves to cash when the 12 EMA falls below the 21 EMA.
🧠 - STRATEGY LOGIC
Signal Generation:
Long Position: Activated when 12 EMA > 21 EMA
Cash Position: Activated when 12 EMA < 21 EMA
Technical Implementation:
Uses perpetual condition checks instead of crossover/crossunder functions to prevent signal misgeneration and ensure reliability
Implements barstate.isconfirmed validation to eliminate repainting issues and ensure all signals are confirmed on closed bars
Provides clean, reliable signals suitable for both backtesting and live trading
⚙️ - FEATURES
The indicator includes a comprehensive table displaying real-time performance metrics comparing the strategy against a buy-and-hold approach:
Sharpe Ratio: Risk-adjusted return measurement
Sortino Ratio: Downside risk-adjusted return measurement
Omega Ratio: Probability-weighted ratio of gains versus losses
Maximum Drawdown %: Largest peak-to-trough decline
Visual Components
Equity Curves: Plots both strategy equity and buy-and-hold equity for visual comparison
Status Table: Real-time display of current position (Long/Cash) and performance metrics
Clean Chart Interface: Easy-to-read visualization of strategy performance
Alert System
Long signal triggers
Cash signal triggers
📝 - How to Use
Add the indicator to your chart
Review the performance metrics table to compare strategy vs. buy-and-hold
Monitor the equity curves to visualize strategy performance
Set up alerts for long and cash signals if desired
Use the current position indicator to track strategy status
📊 - Multi-Timeframe Compatibility
This indicator works across multiple timeframes, however, performance characteristics vary significantly depending on the timeframe selected:
Different timeframes will produce different results
Strategy performance may be optimal on certain timeframes and underperform on others
DYOR (Do Your Own Research): Users are strongly encouraged to backtest the strategy on their preferred timeframes and market conditions before use
Test extensively with historical data to understand the strategy's behavior in your specific use case
ETH
SOL
⚠️ - DISCLAIMER
This indicator is provided for educational and informational purposes only. It is NOT financial advice, investment advice, or a recommendation to buy or sell any security or financial instrument.
Past performance does not guarantee future results
Trading involves substantial risk of loss and is not suitable for all investors
You should carefully consider your financial situation and risk tolerance before making any trading decisions
Always conduct your own research and consult with a qualified financial advisor before making investment decisions
The creator of this indicator assumes no responsibility for any financial losses incurred through the use of this tool
Use this indicator at your own risk

AutoDay MA (Session-Normalized)📊 AutoDay MA (Session-Normalized Moving Average)
⚡ Daily power, intraday precision.
AutoDay MA automatically converts any N-day moving average into the exact equivalent on your current intraday timeframe.
💡 Concept inspired by Brian Shannon (Alphatrends) – mapping daily MAs onto intraday charts by normalizing session minutes.
🛠 How it works
Set Days (N) (e.g., 5, 10, 20).
Define Session Minutes per Day (⏱ 390 = US RTH, 🌍 1440 = 24h).
The indicator detects your chart’s timeframe and computes:
Length = (Days × SessionMinutes) / BarMinutes
Applies your chosen MA type (📐 SMA / EMA / RMA / WMA) with rounding (nearest, up, down).
Displays all details in a clear corner info panel.
✅ Why use it
Consistency 🔄: Same 5-day smoothing across all intraday charts.
Session-aware 🕒: Works for equities, futures, FX, crypto.
Transparency 🔍: Always shows the math & final MA length.
Alerts built-in 🔔: Cross up/down vs. price.
📈 Examples
5-Day on 1m → 1950-period MA
5-Day on 15m → 130-period MA
5-Day on 65m → 30-period MA
10-Day on 24h/15m (crypto) → 960-period MA

MAMA [DCAUT]█ MAMA (MESA Adaptive Moving Average)
📊 OVERVIEW
The MESA Adaptive Moving Average (MAMA) represents an advanced implementation of John F. Ehlers' adaptive moving average system using the Hilbert Transform Discriminator. This indicator automatically adjusts to market cycles, providing superior responsiveness compared to traditional fixed-period moving averages while maintaining smoothness.
MAMA dynamically calculates two lines: the fast-adapting MAMA line and the following FAMA (Following Adaptive Moving Average) line. The system's core strength lies in its ability to automatically detect and adapt to the dominant market cycle, reducing lag during trending periods while providing stability during consolidation phases.
🎯 CORE CONCEPTS
Signal Interpretation:
• MAMA above FAMA: Indicates bullish trend momentum with the fast line leading upward movement
• MAMA below FAMA: Suggests bearish trend momentum with the fast line leading downward movement
• Golden Cross: MAMA crossing above FAMA signals potential upward momentum shift
• Death Cross: MAMA crossing below FAMA indicates potential downward momentum shift
• Line Convergence: MAMA and FAMA approaching each other suggests trend consolidation or potential reversal
Primary Applications:
• Trend Following: Enhanced responsiveness to trend changes compared to traditional moving averages
• Crossover Signals: MAMA/FAMA crossovers for identifying potential entry and exit points
• Cycle Analysis: Automatic adaptation to market's dominant cycle characteristics
• Reduced Lag: Minimized delay in trend detection while maintaining signal smoothness
📐 MATHEMATICAL FOUNDATION
Hilbert Transform Discriminator Technology:
The MAMA system employs John F. Ehlers' Hilbert Transform Discriminator, a sophisticated signal processing technique borrowed from telecommunications engineering. The Hilbert Transform creates a complex representation of the price series by generating a 90-degree phase-shifted version of the original signal, enabling precise cycle measurement.
The discriminator analyzes the instantaneous phase relationships between the original price series and its Hilbert Transform counterpart. This mathematical relationship reveals the dominant cycle period present in the market data at each point in time, forming the foundation for adaptive smoothing.
Instantaneous Period Calculation:
The algorithm computes the instantaneous period using the arctangent of the ratio between the Hilbert Transform and the original price series. This calculation produces a real-time measurement of the market's dominant cycle, typically ranging from short-term noise cycles to longer-term trend cycles.
The instantaneous period measurement undergoes additional smoothing to prevent erratic behavior from single-bar anomalies. This smoothed period value becomes the basis for calculating the adaptive alpha coefficient that controls the moving average's responsiveness.
Dynamic Alpha Coefficient System:
The adaptive alpha calculation represents the core mathematical innovation of MAMA. The alpha coefficient is derived from the instantaneous period measurement and constrained within the user-defined fast and slow limits.
The mathematical relationship converts the measured cycle period into an appropriate smoothing factor: shorter detected cycles result in higher alpha values (increased responsiveness), while longer cycles produce lower alpha values (increased stability). This creates an automatic adaptation mechanism that responds to changing market conditions.
MAMA/FAMA Calculation Process:
The MAMA line applies the dynamically calculated alpha coefficient to an exponential moving average formula: MAMA = alpha × Price + (1 - alpha) × MAMA . The FAMA line then applies a secondary smoothing operation to the MAMA line, creating a following average that provides confirmation signals.
This dual-line approach ensures that the fast-adapting MAMA line captures trend changes quickly, while the FAMA line offers a smoother confirmation signal, reducing the likelihood of acting on temporary price fluctuations.
Cycle Detection Mechanism:
The underlying cycle detection employs quadrature components derived from the Hilbert Transform to measure both amplitude and phase characteristics of price movements. This allows the system to distinguish between genuine trend changes and temporary price noise, automatically adjusting the smoothing intensity accordingly.
The mathematical framework ensures that during strong trending periods with clear directional movement, the algorithm reduces smoothing to minimize lag. Conversely, during consolidation phases with mixed signals, increased smoothing helps filter out false breakouts and whipsaws.
📋 PARAMETER CONFIGURATION
Source Selection Strategy:
• HL2 (High+Low)/2 (Default): Recommended for cycle analysis as it represents the midpoint of each period's trading range, reducing impact of opening gaps and closing spikes
• Close Price: Traditional choice reflecting final market sentiment, suitable for end-of-day analysis
• HLC3 (High+Low+Close)/3: Balanced approach incorporating range information with closing emphasis
• OHLC4 (Open+High+Low+Close)/4: Most comprehensive price representation for complete market view
Fast Limit Configuration (Default 0.5):
Controls the maximum responsiveness of the adaptive system. Higher values increase sensitivity to recent price changes but may introduce more noise. This parameter sets the upper bound for the dynamic alpha calculation.
Slow Limit Configuration (Default 0.05):
Determines the minimum responsiveness, providing stability during uncertain market conditions. Lower values increase smoothing but may cause delayed signals. This parameter sets the lower bound for the dynamic alpha calculation.
Parameter Relationship Considerations:
The fast and slow limits work together to define the adaptive range. The wider the range between these limits, the more dramatic the adaptation between trending and consolidating market conditions. Different market characteristics may benefit from different parameter configurations, requiring individual testing and validation.
📊 COLOR CODING SYSTEM
Line Visualization:
• Green Line (MAMA): The fast-adapting moving average that responds quickly to price changes
• Red Line (FAMA): The following adaptive moving average that provides confirmation signals
The fixed color scheme provides consistent visual identification of each line, enabling clear differentiation between the fast-adapting MAMA and the following FAMA throughout all market conditions.
💡 CORE VALUE PROPOSITION
Advantages Over Traditional Moving Averages:
• Cycle Adaptation: Automatically adjusts to market's dominant cycle rather than using fixed periods
• Reduced Lag: Faster response to genuine trend changes while filtering market noise
• Mathematical Foundation: Based on advanced signal processing techniques from telecommunications engineering
• Dual-Line System: Provides both fast adaptation (MAMA) and confirmation (FAMA) in one indicator
Comparative Performance Characteristics:
Unlike fixed-period moving averages that apply the same smoothing regardless of market conditions, MAMA adapts its behavior based on current market cycle characteristics. This may help reduce whipsaws during consolidation periods while maintaining responsiveness during trending phases.
Usage Considerations:
This indicator is designed for technical analysis purposes. The adaptive nature means that parameter optimization should consider the specific characteristics of the asset and timeframe being analyzed. Like all technical indicators, MAMA should be used as part of a comprehensive analysis approach rather than as a standalone signal generator.
Alert Functionality:
The indicator includes alert conditions for MAMA/FAMA crossovers, enabling automated notification of potential momentum shifts. These alerts can assist in timing analysis but should be combined with other forms of market analysis for decision-making purposes.
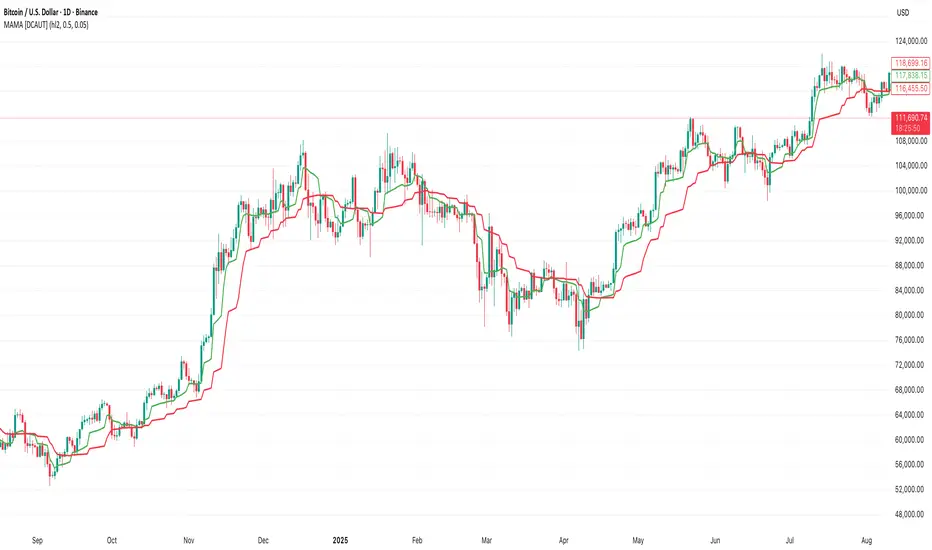
Multi-MA Trend Indicator with ATR by nkChartsThe MMA-ATR is a powerful all-in-one tool that combines multi-timeframe Moving Averages with ATR-based Stop Loss & Take Profit levels. It is designed to help traders quickly assess trend direction, volatility, and potential trade levels in one clean visual setup.
Key Features
Multi-MA Trend Detection
Plots 5 customizable moving averages (choose from EMA, SMA, RMA, WMA, VWMA).
Automatic color coding: Bullish (green), Bearish (red), Neutral (gray).
MA Trend Table with:
MA values
Current chart trend
Higher timeframe (Daily) trend confirmation
ATR-Based Trade Levels
Dynamic Stop Loss (SL) and Take Profit (TP) levels based on ATR multipliers.
Separate visual lines for long and short setups.
ATR Table with:
ATR value for the current chart timeframe
ATR value for the Daily timeframe
Customizations
Choose MA type, length, and price source.
Customize bullish, bearish, and neutral colors.
Adjustable table position and text size.
Fully configurable ATR length, multipliers, and colors.
How to Use
Add the indicator to your chart.
Use the MA Trend Table to identify short-term and higher timeframe trend direction.
Refer to ATR-based SL/TP levels to manage risk and potential profit targets.
Combine both to filter entries and improve trade timing.
Best For
Swing traders and intraday traders who rely on trend confirmation and volatility-based risk management.
Traders looking for a multi-timeframe confirmation system that reduces noise.
⚠️ Disclaimer: This indicator is for educational purposes only. It does not provide financial advice or guarantee profits. Always perform your own analysis before making trading decisions.
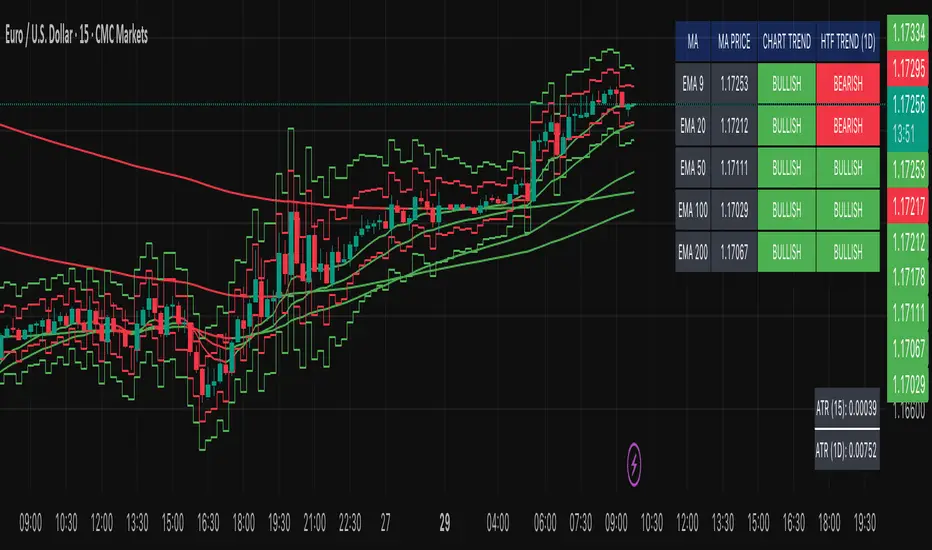
DHYT 6 MAs, BMSB, Pi Cycle TopThis indicator has 6 Moving averages that are highly customizable and visible on all time frames, it also includes the Bull Market Support Band (BMSB) and the Pi Cycle Top indicator which has been very good at predicting Cycle Tops for Bitcoin (BTC).
You can customize all the moving averages, as well as using simple or exponential. You can also easily customize colors and line weights.
Created by: Dan Heilman