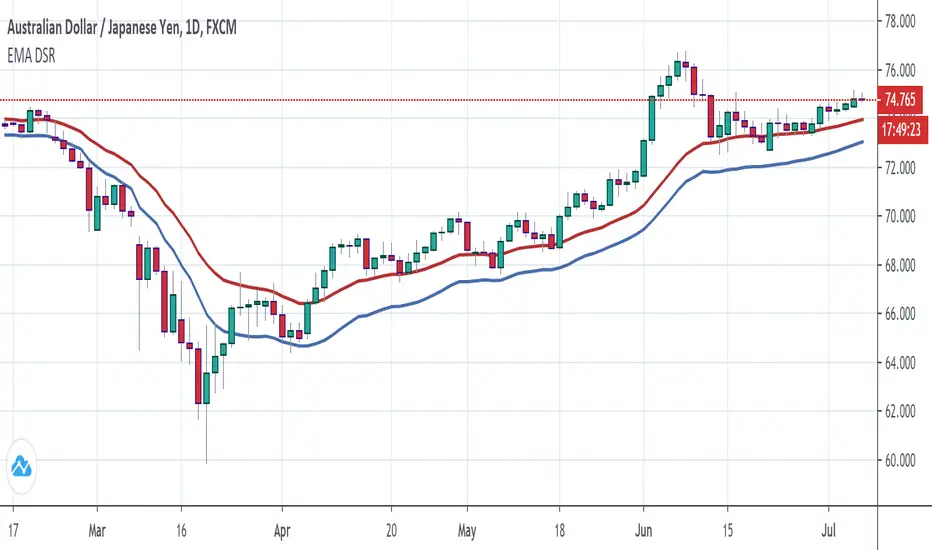
SIDD-Master-Moving-AverageSIDD-Master-Moving-Average is based on RSI average calculation Moving average plotted on chart.
This Moving Average is giving 2 signals Bullish and Bearish .
Whenever Bullish signals is coming price is doing crossover with moving average on upside and this indicate price will go up from current market price.
Whenever Bearish signals is coming price is doing cross-under with moving average on downside and this indicate price will go down from current market price.
Moving average color is changing based on upside movement or downside movement , for upside its green and for downside its orange color.
This indicator i have created with stop loss line means any price close below cross line for bullish position then that trade should be closed and take the stop loss. similarly for Bearish trade and candle close above stop loss line means trade should be closed and take the stop loss.
Stop loss i have taken care with ATR and Super trend you can see the settings.
I have defined setting for general use of indicator if any modification on setting then result may vary.
Its multi time frame moving average. And I have given time frame for indicator as well so if any trending move need to capture then that setting need to be increased with respect to chart time frame else keep it same.
I have added commission and slippages as well in indicator.
Ping me or DM me to subscribe this indicator.
I have given all my indicator details below link (Signature URL). You can check indicators and call me on given number or email me on given email to access the scripts and indicators. Telegram link is also given you can ping me there.
--------------------------------------------------------------------------------------------------------------------------------------
Disclaimer : Past performance of the indicator is not giving guarantee for future performance as well, it may change as per market condition.
-------------------------------------------------------------------------------------------------------------------------------------
Moving

Harmonic MADsNo, it's not a new saturation plugin for your fruity loops.
...
These are Mean Average Deviations calculated from Harmonic Mean.
...
In my previous research I tried to develop "Harmonic Average Deviations", since applying stdevs on Harmonic Mean calculated from reciprocals ain't make sense. Din't work out, prolly cuz by definition stdevs doesn't like negatives. So in the end I ended up using Mean Average Deviations, and turned out it works great. Generally market data doesn't distribute normally, so t's a great tool, now weird kurtosis won't be a problem.

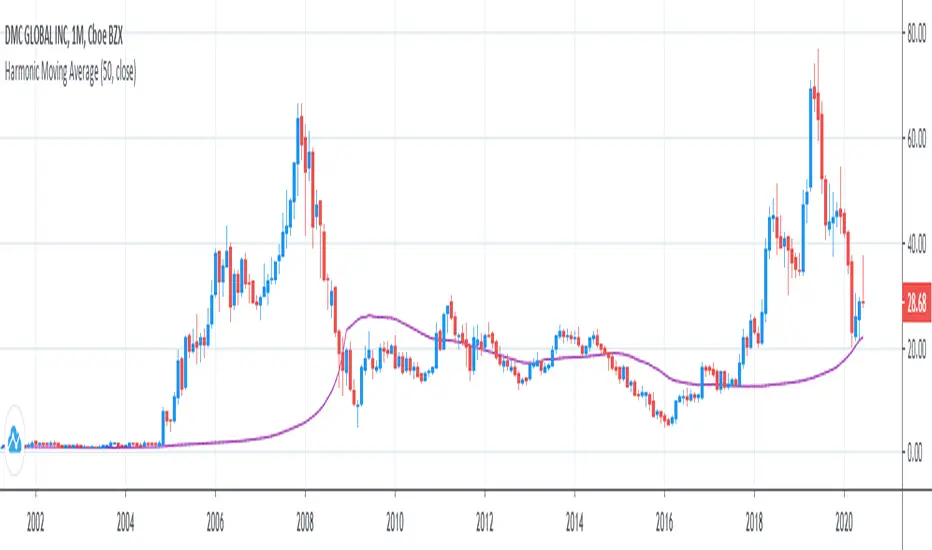
Harmonic Moving AverageI was legitimately surprised no1 has already coded it out on TradingView, but you guys can copypaste & include it in Pine 5 if your see this xd
Here is it.
I've checked and double checked everything, the calculations are right, it can be proved by plotting mean, geometric mean & harmonic mean together and noticing that geometric mean will be always between Harmonic mean, which is always below, and Mean, which is always above.
...
Other central tendency measures are also here as well for usability.
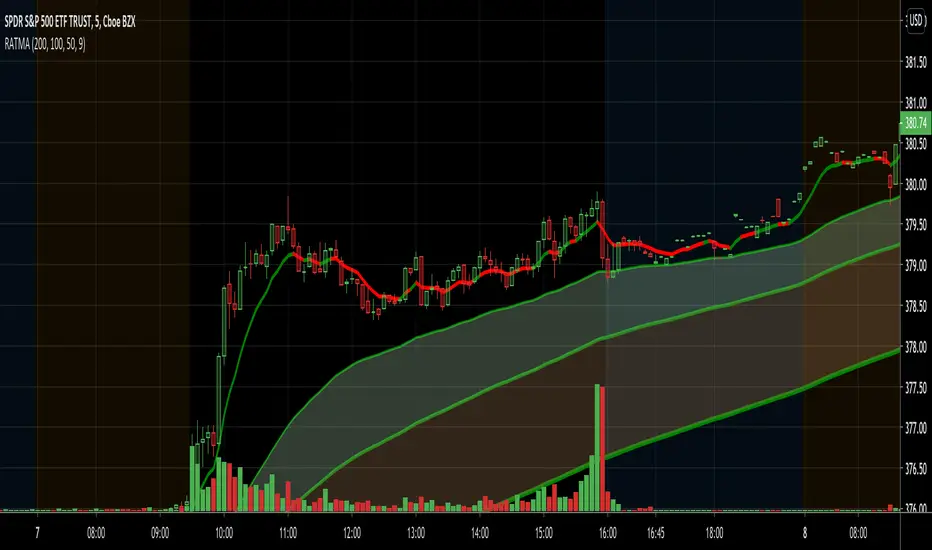
RAT Momentum Squeeze BETAV1.0
MAs are a great tool to measure the market's momentum. I created this indicator to graphically depict bullish and banishment movements with the moving averages.
Using the 50, 100, & 200 day MA in conjunction with the RSI we are able to find great swing setups. This is used best on the 30min & up to the daily chart.
[STRATEGY] Moving Average CrossoverHello friends,
This is a comprehensive backtesting engine for Moving Average crossover strategies, supporting over 63 types of moving averages and filters. It allows you to test, compare, and optimize crossover behaviors between any two moving averages with flexible profit and risk management tools.
Built upon the Moving Average Crossover foundation, this advanced version lets you manually backtest more than 4096 combinations of moving average types. When combined with customizable periods, take-profits, and stop-loss levels, the total number of possible configurations becomes virtually unlimited.
🛠 How It Works
The system tests crossovers between two selected moving averages, with full control over their types, lengths, and trading direction. Integrated bracket settings enable dynamic take-profit, stop-loss, and trailing-stop management using units such as % , ATR , points , pips , or ticks .
You can restrict backtesting to a custom date range for focused performance evaluation or run it across the instrument’s full history.
🔥 Key Features
Supports 63+ moving average and filter types — including algorithms by Ehlers , Jurik , Kaufman , Apirine , Tillson , and Dürschner
Customizable MA types, periods, and strategy direction
Full-featured bracket control: TP, SL, and TSL in ATR, %, points, pips, or ticks
Backtest window customization (start, end, or range)
Direction filter: Longs only, Shorts only, or Both
Dynamic trade labeling and color-coded visualization
Option to exit only at TP, SL, or TSL
If you'd like access or have any questions, feel free to reach out to me directly via DM.
👋 Good luck and happy trading!
Bezahltes Script

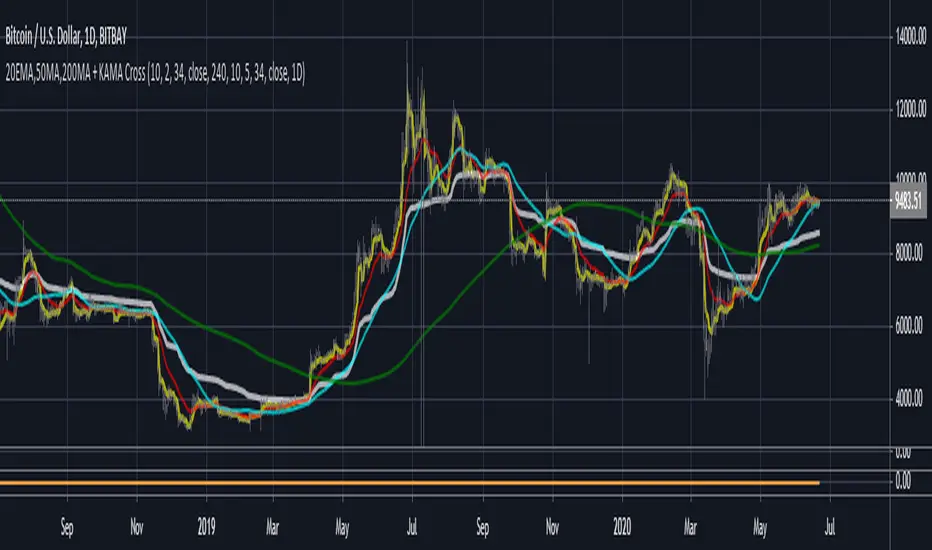
3MA'S + KAMA Trend (20EMA,50MA,200MA + KAMA Trend)This indicator, combines the traditional FOREX moving averages (20EMA, 50ma, 200ma) into a single indicator with
an adaptive moving average (AMA) taken from a user defined timeframe to show trend direction (by default, it plots
the daily 10/2/34 KAMA overlayed on any timeframe chart.
An AMA moves slowly when markets are sideways but swiftly during periods of volatility as a result it reacts much fast than
traditional options for moving average trends.
If the price is above the KAMA, trend is up. Below the KAMA, trend is down.
LoFi EMA version 1.3aLoFi EMA version 1.3a
The goal of this indicator is to plot rsi , ema values on any chart. You can also adjust it for larger time frames. Repainting issues have been fixed and updated to pine version 4.0
The script is currently under development and additional updates will be added based on performance from a 24/7 active bot that is using this on 1hr, 4hr, 12hr and daily time frames. This can also be used for degen trading on the 2 min chart. The output may vary slightly between different chart time frames for the same indicator settings.
This is an "Invite Only" script. Contact me for details.
User Interface/Detail Description:
- Green Bar= Buy
- Red BAR = Sell
This indicator can be easily used with popular bot trading platforms. Feel free to contact me for details.
Can be used for all Charts
Basic Entry Chart Layout:
BITMEX:
BITCOIN:
FOREX:
LEGACY:/ STOCKS:

Tradespot Quant Tradespot - Quant is an extensive trading algorithm, signal generator and technicals screener packed into one beautifully designed, functional indicator. The script is very customisable to not limit the trader using it but does have some very respectable settings for BTCUSD & ETHUSD on the 4H and 45M charts that we run in an automated fashion here a tradespot round the clock on Binance Futures.
What does Tradespot Quant do?
Trade following signals generated via our bespoke algorithm
Full customisation to allow a deeper use of the indicator across different assets
Beautifully illustrated 'Take Profit' and 'Stop Loss' levels that are configurable to easily see how successful the model can run
Presets for BTCUSD & ETHUSD on the 4H/45M timeframes avaliable instantly for your use.
Innovative trade panel that illustrates key information such as what trade the algorithm is looking for next? is altcoin trading deemed safe or risky right now? How are the technicals looking regarding the overal market trend?
More features being added all the time, we have great ideas and our only limitation is how fast we can program it!
Do you do a free trial?
Yes! Get in touch for a complimentary 48 hour free trial to the indicator, no strings attached.
Who are you?
Tradespot has been creating scripts for years on TradingView that we use to leverage our social trading and signal group offerings. We currently have over $200K in assets trading with our strategies across over 300 users.
You can learn more about us on our website. Please reach out to me or see the link on our profile.

TS - Trend Moving AveragesOverview
Simple trend indentification indicator based on a mix of SMA & WMA components.
Default settings built for the 1D chart with an optional 3rd fast MA that can be toggled.
Can be used alongside more advanced Tradespot indicators
Access
PM me, our indicators come as a wider package.

Daily Moving Averages on Intraday ChartsPrints exponential 8, 21, 50, 100 and 200-day moving averages on intraday charts. For example, if you are on a 5 minute chart, you will see a magenta "X" making the current value of the 8-day EMA with an "8" label above it.
This is NOT a Strat script and it follows more closely the way Scott Redler from T3Live looks at charts. If you acknowledge that the vast majority of the time, price does have some sort of reaction to these daily EMAs (whether just a short relative pause or the beginning of a reversal), this script may be helpful.
The Strat and Rob Smith DO NOT support the use of moving averages. This adds more data to your chart which you may or may not find extraneous.

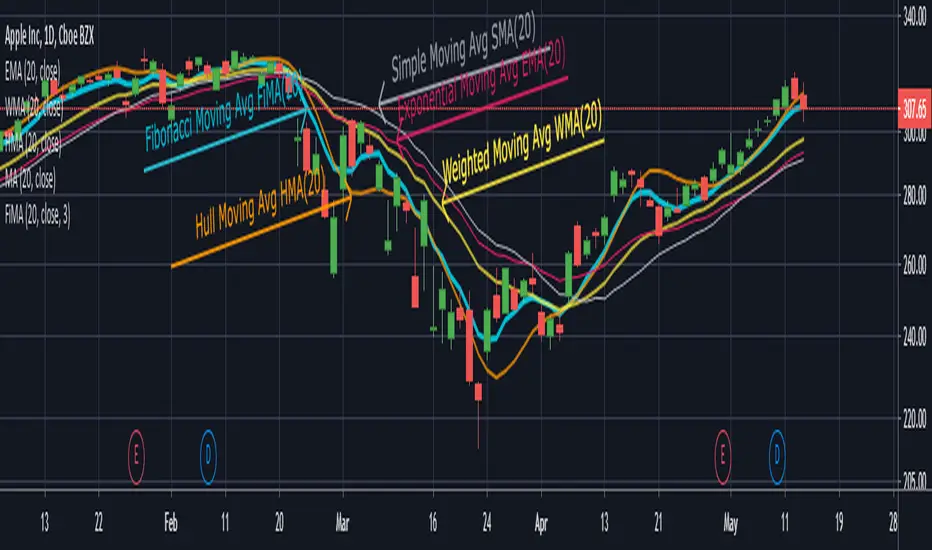
TA Basics: Creating a Fibonacci Weighted Moving AverageIn the previous 2 posts in this series, we played around with simple math concepts to create a zero-lag moving average that can deliver fast response and less lag - that we can use to enable better trend following, or as filter / signal.
here we take a step further - instead of using equal weight for the moving average (as in the Simple moving average) or linear weights (as in the weighted moving average), we get to pick THE MAGIC SEQUENCE, Fibonacci.
we will use the Fibonacci Sequence as weights to produce our moving average - so practically, we create a "Fibonacci Weighted Moving Average" (let's call it FiMA) - and compare the result with other commonly-used moving averages of the same length
in a Fibonacci moving average, the data will be weighted based on the Fibonacci Series starting from 1 (for the furthest data point)
so for example, if we use a length of 10, the weights will be 1, 1, 2, 3, 5, 8, 13, 21, 34, 55 with the 55 being the weight applied to the most recent / current bar's selected value (close, hl2, hc3..etc) and moving backward
before i posted this script, i searched around to see if someone else has already wrote this - i found a couple, but the approach we use here in this code is different - i can't claim it to be more efficient - i honestly don't know - but the resulting code here, IMHO, is more compact and easier to integrate in other studies that you may like to put together to leverage this idea, to create your own indicators and strategies.
the reason the code here is more compact, is that it utilizes a shorter formula to calculate the FIb(n) - i included the source where i found that formula, and i tested it before using it in the code.
i also added an optional "extra smoothing" for the resulting MA, by simply calling the fima() function a second time (so like doing a 2-pass filter), with a smaller length on the result of the 1st pass. keep this smoothing small not to produce too much lag.
i like the outcome when compared to other moving averages - it has a fast response to data/trend change and less overshoot - but honesty i didn't see any real "Fibonacci Magic" :) .. but i'll leave the final judgement to those who use it - this is more of an experimental code in all cases - please feel free to use, change and share feedback.
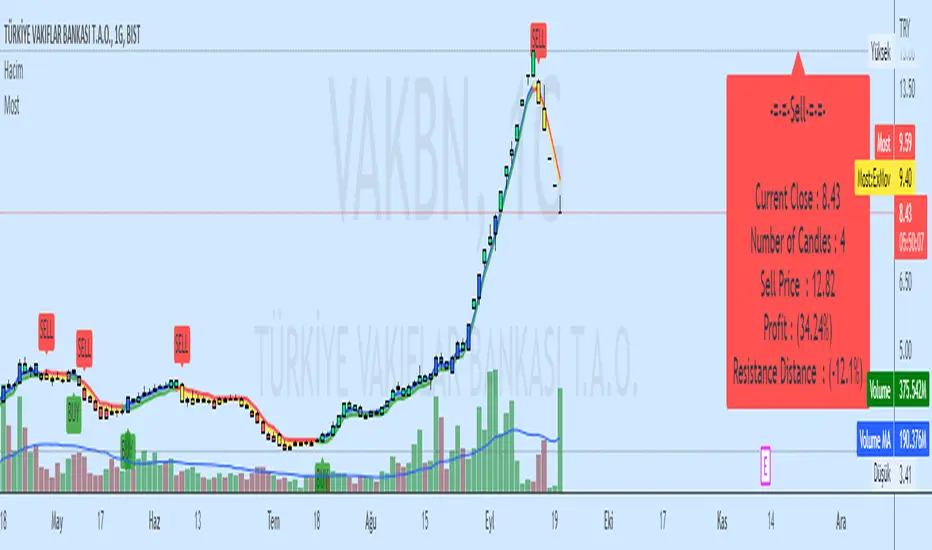
Moving Stop Loss (Most) by ceyhunATR is an indicator that has been removed and replaced with a moving average.Bar colors and infopanel have been added.
//Barcolor
Green = ExMov > Most and close > Most and low > Most
Blue = ExMov > Most and close > Most and low < Most
Red = Most > ExMov and close < Most and high < Most
Yellow = Most > ExMov and close < Most and high > Most
//It gives White color where there is deterioration.
//InfoPanel
Buy Price = Blue draws the circles at the purchase price.
Profit Long>20 = Risk level taken as a percentage, I got the highest 20%, you can determine as you wish.
Sell Price = Red draws the circles at the purchase price.
Profit Short>20 = Risk level taken as a percentage, I got the highest 20%, you can determine as you wish.
==Atr Original Code==
CDC ATR Trailing Stop V2.1 (2013)
==Most Code==
MOST by Anıl ÖZEKŞİ
Barcolor
Barcolor
TS - Long Term Trading Algorithm - StrategyStrategy to the bespoke TS - Trading Algorithm. Highly profitable cryptocurrency trading model.
This script is long only profitable strategy- there is a script coming in the next few days for shorter timeframe long & short trading.
- Backtesting is from 2017.
- 0.05% commission
- 100% capital allocation per trade.
Access to both the backtesting strategy & indicator is paid - PM me for details.

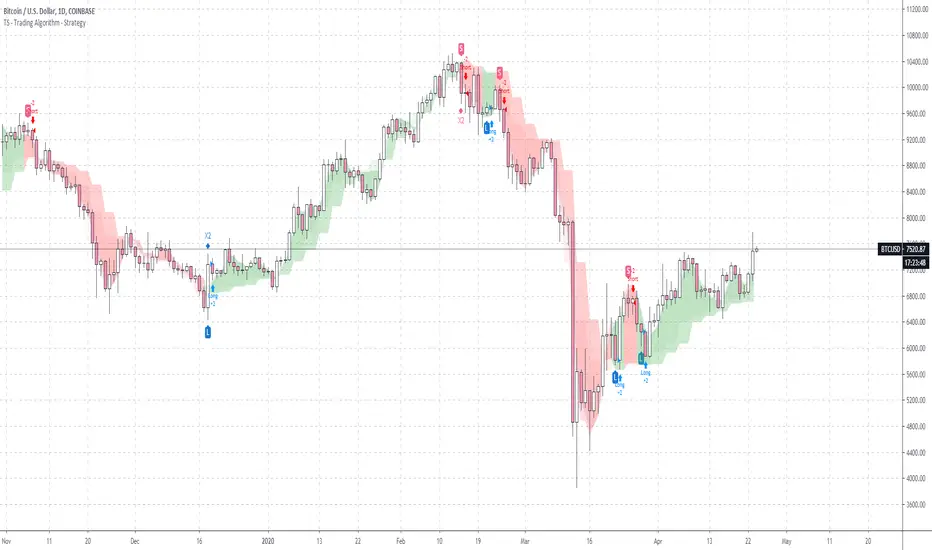
TS - Trading Algorithm - StrategyStrategy to the bespoke TS - Trading Algorithm . Highly profitable cryptocurrency trading model.
Access to both the backtesting strategy & indicator is paid - PM me for details.
Indicator does not repaint and has no discretionary approach - you can follow blindly and take advantage of the performance.
Moving Average Compendium===========
Moving Average Compendium (16 MA Types)
===========
A selection of the most popular, widely used, interesting and most powerful Moving Averages we can think of. We've compiled 16 MA's into this script, and allowed full access to the source code so you can use what you need, as you need it.
-----------
From very simple moving averages using built-in functions, all the way through to Fractal Adaptive Averages, we've tried to cover as much as we can think of! BUT, if you would like to make a suggestion or recommendation to be added to this compendium of MA's please let us know! Together we can get a complete list of many dozens of types of Moving Average.
Full List (so far)
---
SMA - Simple Moving Average
EMA - Exponential Moving Average
WMA - Weighted Moving Average
VWMA - Volume Weighted Moving Average
DEMA - Double Exponential Moving Average
TEMA - Triple Exponential Moving Average
SMMA - Smoothed Moving Average
HMA - Hull Moving Average
ZLEMA - Zero-Lag Exponential Moving Average
KAMA - Kaufman Adaptive Moving Average
JMA - Jurik Moving Average
SWMA - Sine-Weighted Moving Average
TriMA - Triangular Moving Average
MedMA - Moving Median Average
GeoMA - Geometric Mean Moving Average
FRAMA - Fractal Adaptive Moving Average
Line color changes from green (upward) to red (downward) - some of the MA types will "linger" without moving up or down and when they are in this state they should appear gray in color.
Thanks to all involved -
Good Luck and Happy Trading!

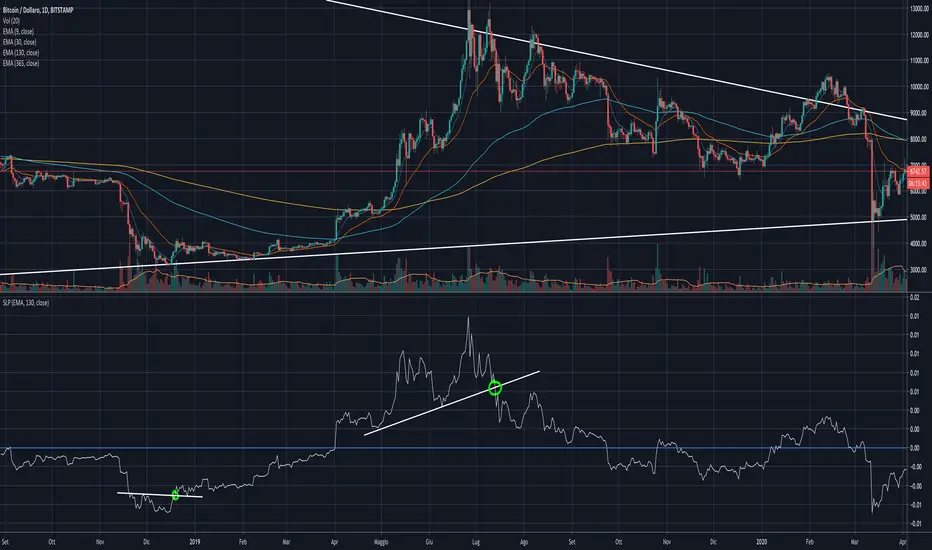
Moving Average SlopeA simple calculation and plotting of the slope of a Moving Average.
You'll be amazed looking at how accurate it is signaling early entries and exits from trend follower positions, just by applying some basic TA to it (support, resistance, trend lines).
Have a look:
In the settings, you can choose to use it on EMA on SMA, and the length of the MA involved.
I recommend using it on a medium-long sampling MA, to minimize noise.
Smooth HA / Hull MA / MTF===========
Smooth HA / Hull MA / MTF
===========
A combination of a Smoothed Heikin Ashi Chart Line and a Hull MA Line, paints a "Long" or "Short" alert when the Hull MA changes color - editable settings for the smoothing of HA data and Hull MA Length; you can also change the time frame used (must be the same or longer as the chart).
-----------
This indicator does a real good job at finding highs and lows (otherwise known as entry and exit points!) picking up on just about every large, decent swing and making the most from those big moves! The disadvantage of all Smoothed HA strategies are when times are choppy or ranging - given the natural lag of the indicator you can be sure in choppy times you'd be buying at the top and selling at the bottom almost every time ~ No indicator is perfect!
This Smooth HA/Hull MA indicator also has a built in MTF function (Multi-Time-Frame). This means you can be using a 1hr chart and set the indicator to a 4hr chart - generally any movements on a greater time frame will overcome any movements of the smaller time frame, so this is where you should be gathering data about which direction the market is moving - as always, follow the trend.
Hope (like always) this is of at least some use to some people.
Good Luck and Happy Trading!

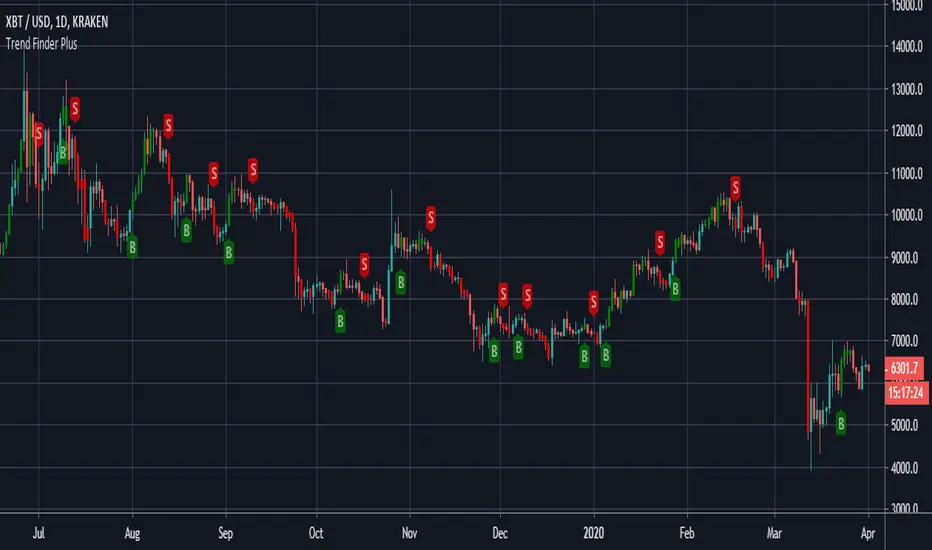
Trend Finder Plus - theCrypster===========
Trend Finder Plus
===========
A combination of various trend analysis techniques - MA's, pivotal breakouts, and Stochastics - Combined to make one super handy indicator!
-----------
Editable settings include a custom "Trend Finder" length and the usual settings for utilizing a "Stochastic RSI" .
This is a really useful tool for catching the very start of potentially bigger swings and movements - but it can get easily and display false signals during choppy periods - use with other indicators for a true sense of what can be achieved with this.
Good Luck and Happy Trading!
Superstock 10-30 WMA Band script I was reading Jesse Stine's Insider Buy Superstocks book, and one of the technical traits he mentioned of a superstock (read the book, seriously, very strongly recommended) was a breakout above the 30 weekly moving average. He goes on to mention that after breakout, the 10 WMA often acts as a support line where you can add to your position. This script is inspired by the visual direction of Chris Moody's slingshot system, and how it displays MA's. The skinny line is the 10 WMA and the bigger line is the 30.

Strategy - WMAs based - By SandeepThis script is based on the Moving averages.
When Blue candle is generated, please see the cross over by Red/Green moving averages.
Strategy Long:
Blue Candle+ Green cross over red - Long
Blue Candle + Red Cross over green - Short.
For confirmation, please use RSI14 or Stochastic momentum indicator over sold and over brought zones.

Multiple Timeframe Five Moving AveragesThis allows you to plot up to 5 moving averages on your chart at once. You can either use the chart's current timeframe or select a custom timeframe for your 5 moving averages (for example, you can see the 200DMA on your 4h chart without having to adjust the moving average length). You can also choose amongst SMA , EMA , and HULLMA for each MA.

Recursive Median Filter by Jhon EhlersEN: Impulsive noise spikes or extreme price or volume data are not unusual in the financial markets and these extreme values can throw off your averaging calculations. Ehlers thinks, How can you set up a data filter to remove these extreme price movements? This Stocks & Commodities Contributing Editor shows you a way to handle this by using a filter that discards all data except the median value.
TR: Dürtüsel fiyat hareketleri, aşırı fiyatlamalar yada hacim artışları finansal piyasalarda olağan dışı değildir ve bu hareketler genelde ortalama hesaplarımızın savrulmasına sebep olur. Ehlers bu aşırı fiyat hareketliliklerinin neden olduğu ortalamalardaki bu savrulmanın nasıl kaldırıcağını düşünür ve medyan değer hariç tüm verileri silen bir filtre kullanarak bunu halletmenin bir yolunu bulur.
