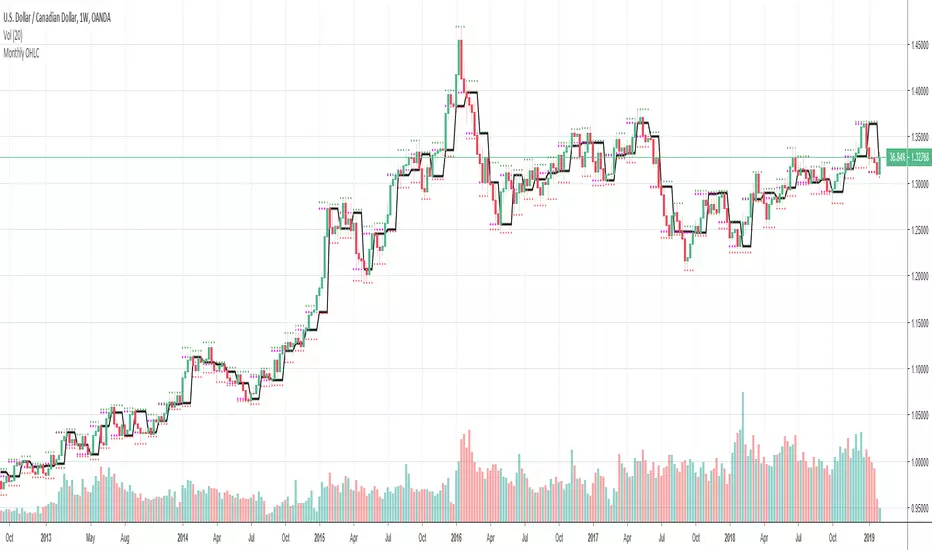
InfoPanel - SeasonalityThis panel will show which is the best month to buy a stock, index or ETF or even a cryptocurrency in the past 5 years.
Script to use only with MONTHLY timeframe.
Thanks to: RicardoSantos for his hard work.
Please use comment section for any feedback.
Monatliche Charts

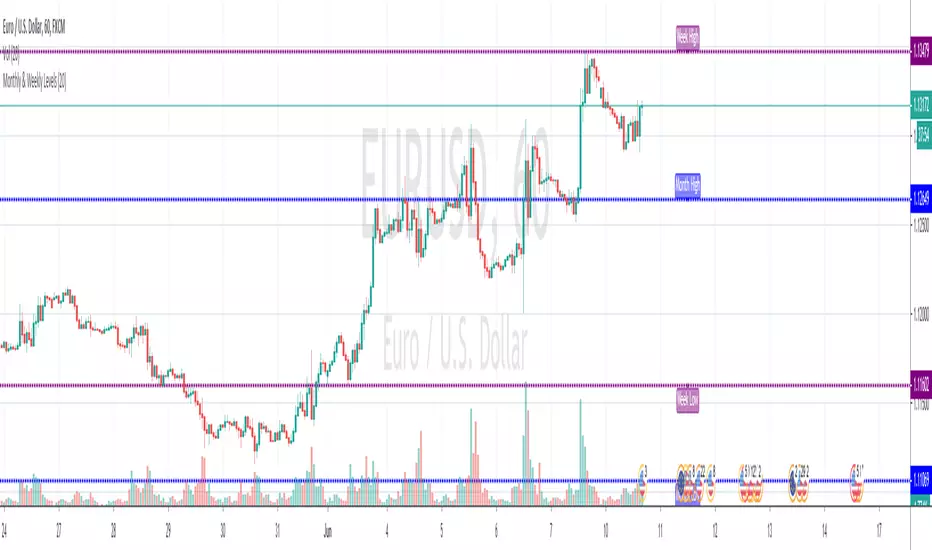
Monthly & Weekly LevelsShows and labels the previous monthly and weekly highs and lows, which are generally great areas to trade off. Loads quick and there's an option to hide the labels if they don't float your boat
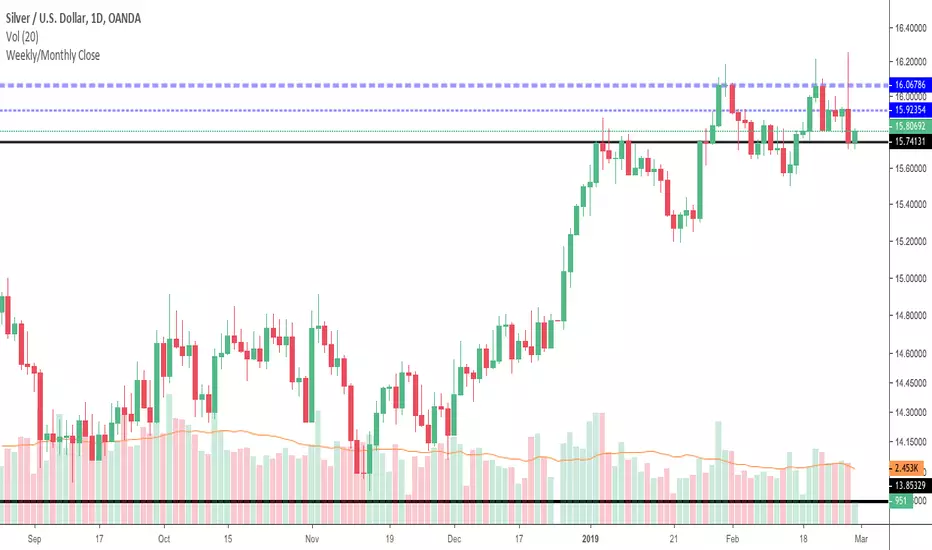
Weekly/Monthly CloseJust a simple support/resistance indicator that display weekly/monthly close price and it is configurable to work in two modes:
tracking mode - to display last week/month's close
history mode - to display weekly/monthly close prices
See how last month's close (ticker blue line) provides nice resistance and the price forms a double top then it consolidates under last week's close line (thiner blue line).
It also works on intraday charts and displays history close prices, see below how last month's close (ticker blue line) provides support over and over and also how price bounces off weekly close history prices (thiner blue line).
Weekly OHLC Plus 3 Weekly TF EMAsPlots weekly OHLC (with option to turn on monthly Open and Close) and 3 Weekly resolution EMAs (customizable).
This indicator is a combination of a few I've created/updated here on TV.
First part plots Weekly OHLC with an option to plot monthly open and close.
This indicator also plots on your chart 3 EMAs (customizable) from the Weekly timeframe (resolution).
The default settings (all EMAs)
200 - Orange
50 - Purple
20 - Black
There is no smoothing so the EMA line will appear jagged.

Monthly OHLCThis indicator displays the monthly Open, High, Low and Close price on a chart.
Very helpful indicator for starting your trading week (I use it every week in FOREX, Crypto, and Equities).
In conjunction using this on the Weekly & Daily timerfame with a 200, 10 and 5 EMA you can start your week off with a probable bull or bear bias.
Earnings Support and Resistance Levels [NeoButane]Inspired by @LazyBear's/@timwest's script:
Usage: support and resistance levels based on averaging price around earnings and quarterly opens.
What it is plotting:
1. A horizontal level whenever earnings occur. If actual earnings is higher than estimated, the line turns green, else red.
2. A horizontal level every quarterly open, colored black.
3. An average between the two mentioned above, colored orange.
4. 5% moves away from 3M open and earnings
5. Misc: 5% move away from that 5% move away, then 10% move away from the 2nd 5% move away.
By default, 4 and 5 are off to reduce visual noise.
Idea: Traders panic around certain dates that always happen, and traders always panic in the wrong direction. The market is composed of traders trading in the wrong direction at the same time, all the time. That means price will bounce back and forth as the gambling dens colloquially known as 'forex brokerages' or 'stock exchanges' take your money in the form of fees, time, and liquidations. So I put two lines on the chart and put one right in between, because it always goes back. I hope you can find it useful!
Note: This was a part of the old fundamental data indicators and is not officially for use, so while it should work on most U.S. stocks and a couple of other exchanges, it is not perfect.


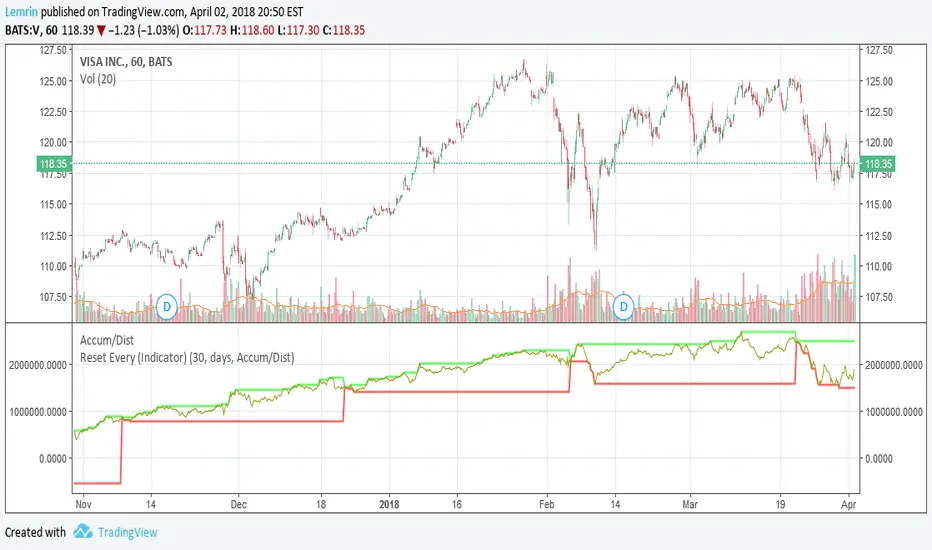
Reset Every (Indicator)Nearly identical to the price version , this configurable indicator retains the max and min value of a chart for the time duration you specify. The difference with this one is that it can be applied to any other indicator, not just price.
Applied to volume:
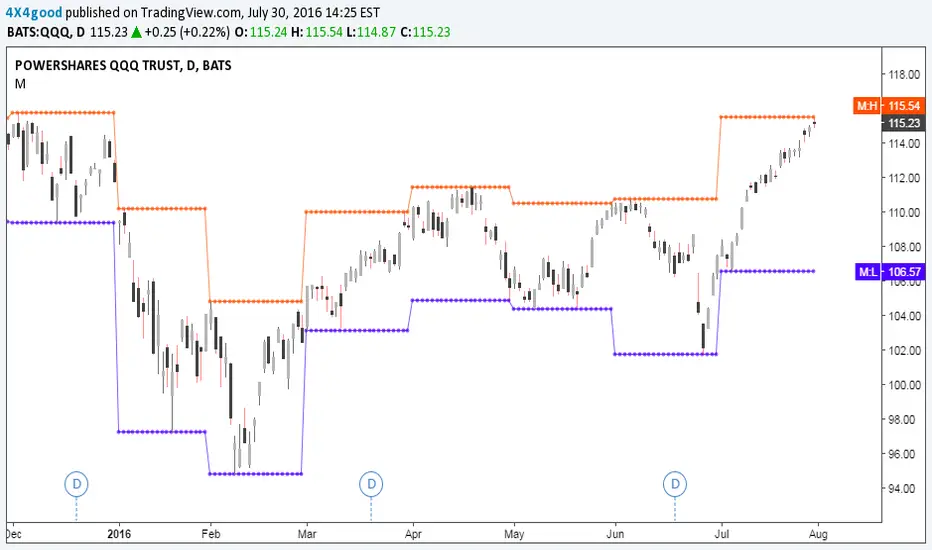
Reset Every (Price)Someone requested a high/low price indicator that would reset the "remembered" prices daily. I started out doing just that, and then decided to make it much more configurable.
Choose the units (minutes, hours, days, weeks, months) and the number of those units, and this will reset the highest/lowest value remembered to the current values on your chosen time interval.
This should work with any time interval you desire, within reason...asking for resets every 4000 hours on a monthly chart will probably not work.
GE, monthly, every 7 months:
Ford, weekly, every 18 months:
Dow Jones Industrial Average, weekly, every 90 days:
LTCBTC, daily, every 10 days:
ETHUSD, 30 minutes, every 10 days:
BTCUSD, 1 minute, every 10 hours:
EURUSD, 1 minute, every 50 minutes:
Also, I am about to publish another version of this with just one source input that can be applied to any indicator...stay tuned!

Close of relevant previous periodThis indicator puts the previous close value of a higher relevant time frame on the chart, it adepts to the period of the chart. Relevant means that it puts:
Close of previous year in monthly chart
Close of previous month in weekly chart
Close of either previous month of week in daily chart, default setting is week
Close of previous week in 4hourly and 3hourly charts
Close of previous day in 30minute and higher intraday charts
Not bother the user below 30 minutes.

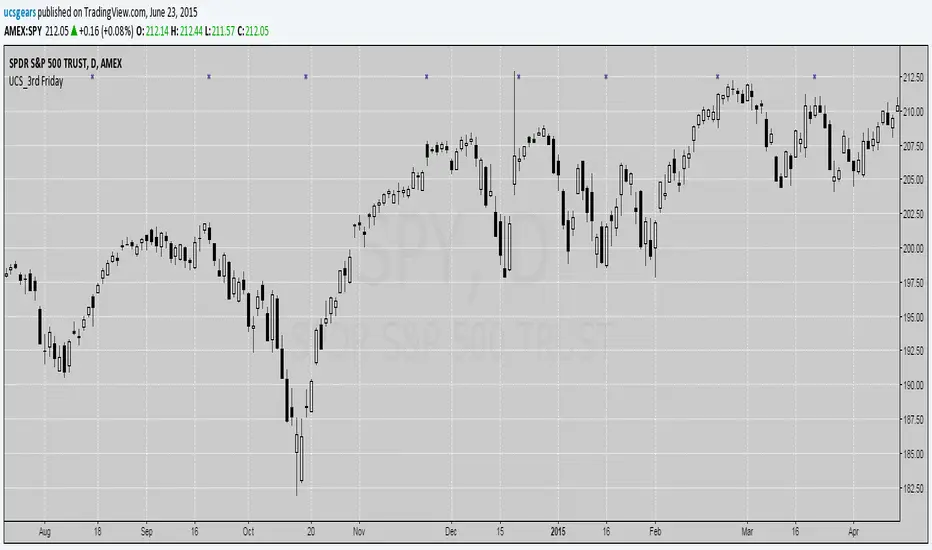
UCS_3rd FridaySimple script to show you a way to find 3rd Fridays (Monthly Options Expiry)
If that friday is a holiday, then it doesn't generate a signal. Futures & Forex trader need not to worry. I will fix it for the stock traders as well. Time is all I need.
as usual Good Luck for those who believe in it. Practice for those who believe in hard work. Think for those who believe in smart work. ;)
High and LowsSimple script used to show the previous day/week/month high and low as an overlay on the chart