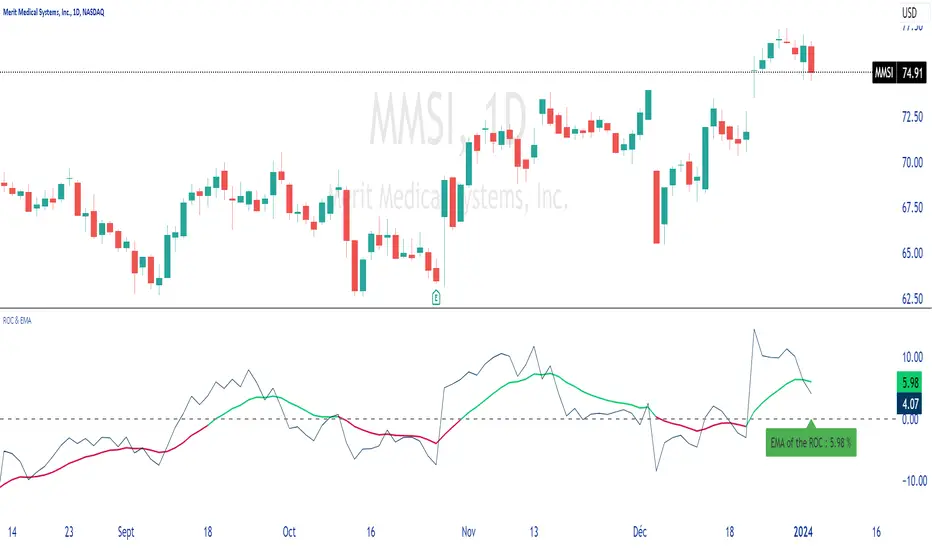
ROC & EMAIn summary, this allows you to plot the ROC, its EMA, and dynamically display the value of this EMA on the chart.
You can configure different lengths and colors.
Unpretentious code, just for the pleasure of sharing.
Thank you for sharing your comments with me, which will be welcome.
Momentum Indicator (MOM)
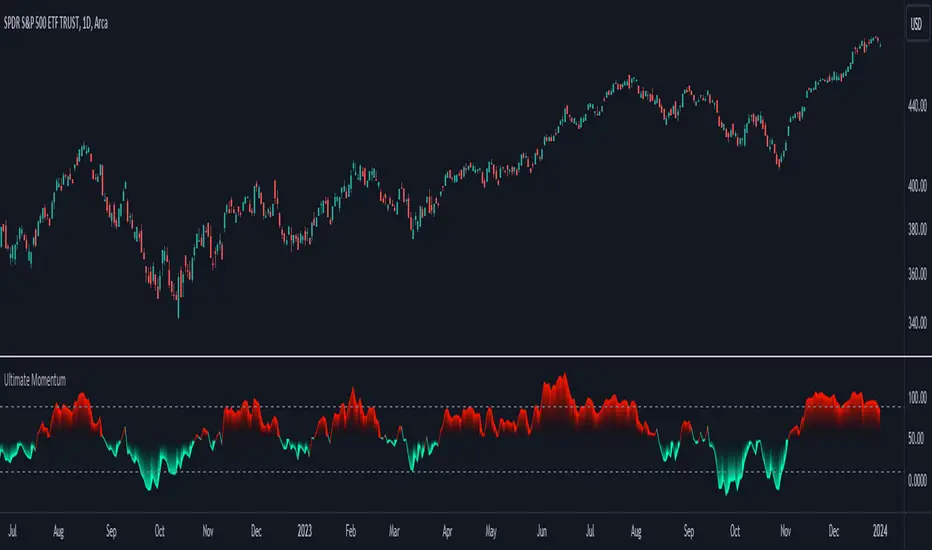
Ultimate Momentum"Ultimate Momentum" – Elevating Your Momentum Analysis
Experience a refined approach to momentum analysis with "Ultimate Momentum," a sophisticated indicator seamlessly combining the strengths of RSI and CCI. This tool offers a nuanced understanding of market dynamics with the following features:
1. Harmonious Fusion: Witness the dynamic interplay between RSI and CCI, providing a comprehensive understanding of market nuances.
2. Optimized CCI Dynamics: Delve confidently into market intricacies with optimized CCI parameters, enhancing synergy with RSI for a nuanced perspective on trends.
3. Standardized Readings: "Ultimate Momentum" standardizes RSI and CCI, ensuring consistency and reliability in readings for refined signals.
4. Native TradingView Integration: Immerse yourself in the reliability of native TradingView codes for RSI and CCI, ensuring stability and compatibility.
How RSI and CCI Work Together:
RSI (Relative Strength Index): Captures price momentum with precision, measuring the speed and change of price movements.
CCI (Commodity Channel Index): Strategically integrated to complement RSI, offering a unique perspective on price fluctuations and potential trend reversals.
Why "Ultimate Momentum"?
In a crowded landscape, "Ultimate Momentum" stands out, redefining how traders interpret momentum. Gain a profound understanding of market dynamics, spot trend reversals, and make informed decisions.
Your Insights Matter:
Share your suggestions to enhance "Ultimate Momentum" in the comments. Your feedback is crucial as we strive to deliver an unparalleled momentum analysis tool.
EXOFADEEXOFADE is an incredible trading indicator designed help give traders a visual clue of price momentum by combining Linear regression calculations with volume.
Overview:
ExoFade is a unique and dynamic trading indicator designed for both beginner and professional traders. At its core, it uses a sophisticated blend of multiple linear regression analysis, incorporating price, time, and volume-weighted moving average (VWMA) to predict potential price movements. By analyzing these key factors, EXOFade offers an innovative approach to understanding market trends and identifying trade opportunities.
Why It Works:
ExoFade works by calculating a regression line that adapts to market conditions, factoring in both price trends and trading volumes. This approach provides a more nuanced view of market momentum, going beyond traditional price-only indicators. The inclusion of time as a variable offers unique insights into market dynamics, making ExoFade a valuable tool for various trading strategies.
Key Features to Look Out For:
Regression Line: The heart of ExoFade, offering visual cues about the market's direction.
ATR-Based Fade Levels: Utilizes Average True Range (ATR) to set dynamic levels that signal potential reversals or continuation. The indicator comes with three fade levels, which are described below
Alert Conditions: You can set up for alerts for when any of the fade levels have been been reached, indicating potential entry points.
What Are Fade Levels And How To Use The Enter Trades:
The exofade line always moves with price, this indicates that the current volume is moving in the same direction.
When you see the exofade start to move ahead of price. For example, in an Uptrend, if price stops making new highs and you see the exofade line continue moving up ahead of price as price stagnates, this is the first time that you should be expecting pull back or reversal. When the line starts to visibly curve, this when you want to enter the trade.
Sometimes, the exofade line will move just a little bit ahead of price, and sometimes it will move a clear distance ahead of price.
From my experience, the further ahead it moves from price without price keeping up, the higher the probability of a pullback or reversal.
The actual pullback then starts when the exofade line starts to curve, which signifies the start if the actual pullback.
Since we cannot sit and watch for when the line has either moved further ahead enough or started to curve, thats why i figured to use ATR as the best way to measure the distance the exofade line moves ahead of price and the ATR also happens to measure Volatility, which makes it a perfect match.
From forward testing this for months, i have found the pullbacks typically start when the exofade line has moved ahead of price by atleast 2 ATR's. A distance of 2 ATR and above are the ones i consider the best setups. This also marks the point for your stop loss, since 2 ATR is generally used stoploss level.
To catch and sell a pullback in an uptrend, you can set alert for one or both of these alerts
Fade Level 2 abv price - This alert will trigger once Exofade line reached 2 ATR ABOVE price (Just means it has reached 2 atr, dosent mean it has started curving yet)
Curve lvl 2 - SELL - This alert means the exofade line has started to curve at 2 ATR
To buy pullbacks in a downtrend you set the opposite alerts of the one above for curve below price
There are also same alerts for level 3 as well, which is 2.5 ATR
IMPORTANT NOTES - DONT SKIP THIS
For daily and intra-day swings - Use this on 1hr trend upwards - The exofade line much slower on higher timeframe, so when you get a curve on a high time frame, like the 4HR or Daily timeframe, those are excellent signals
For scalpers trading 1hr below - The exofade moves faster on lower timeframes, so more caution should be used with these on lower timeframes , you this with other confluences like a good momentum oscillator oversold/overbought regions StochRSI, MACD etc
EXTRA TIPS
- Since the curve forms slower on higher time frames, it means getting a curve the on daily and weekly chart can help in your trend analysis to detect early signs of potential trend reversals
-I typically pair this with my customized version of Nadaraya watsons envelope ( a free indicator on tradingview) It will further improve your entry and winrate. Biggest advantage is for setting a profit target. In a buy trade for example, you buy the curve below price and set your profit target for the top band of the nadaraya watson envelope. Very efficient for scalping
- Unique areas were you want to pay attention to the exofade is when price enters points of interest, this depending on your trading style could be a
-FVG - fair value gaps
-Order blocks
- Supply / Demand areas
-Volume profile Value area High and Value area Low
The are two scenarios i would like you to be cautious of
1. As with every indicator and strategy, i most definitely wouldn't use this during high impact news.
2. If price is trending very strongly in one direction only, such that even barely gives any decent pull backs at all. Most especially if that strong push is happening between the 4hr to Daily time frame. Do not attempt to counter those trends unless you know what you are doing. Its not advisable.
Instead i'll recommend using the Exofade to catch an entry in the direction of the trade for a continuation.
And Lastly
Since this indicator uses VOLUME data as part of its calculations. It will not work on any pairs that tradingview does not provide volume data for, like Gold. But it will work normally on Gold Futures, since that has volume data

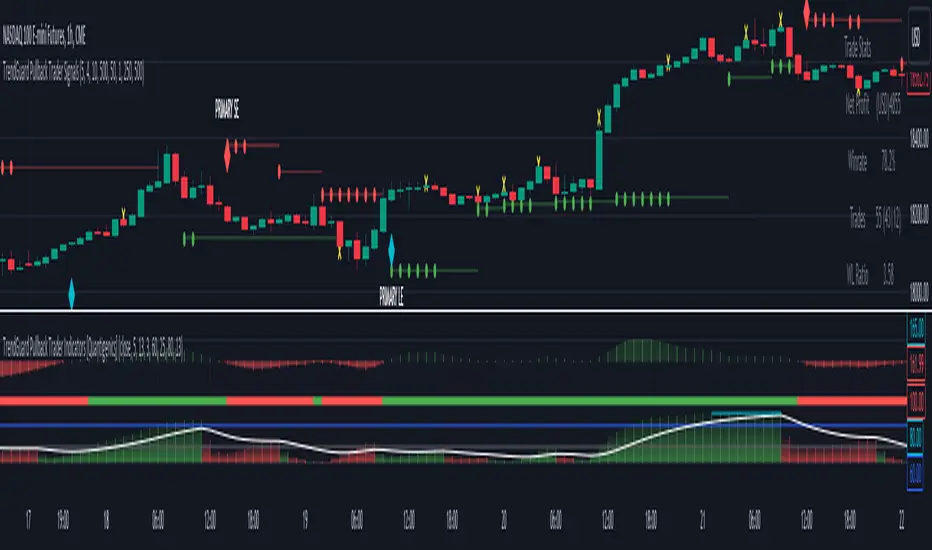
TrendGuard Pullback Trader Signals [Quantigenics]The "TrendGuard Pullback Trader Signals" script, integral to the "TrendGuard Pullback Trader" system, offers a sophisticated suite of trading tools for nearly any market or time frame. Designed to be used alongside the "TrendGuard Pullback Trader Indicators" script, this script is pivotal for identifying Buy/Sell Signals, Profit Target Signals, and Stop Loss Levels.
As with all of our scripts, the "TrendGuard Pullback Trader Signals" script, is designed to work on ANY symbol and time frame. The input parameters can be adjusted to fit your specific trading style.
Methodology and Application:
The script's core methodology lies in identifying primary signals at the onset of a trend and secondary signals during pullbacks or dips. It focuses on pinpointing optimal entry points during market pullbacks, enhancing the "TrendGuard Pullback Trader Indicators" script with well-timed signals for profit targets and stop loss levels.
Technical Composition:
The "TrendGuard Pullback Trader Signals" script combines various technical analysis tools to generate comprehensive trading signals. It calculates stop levels by assessing the highest and lowest bars over a chosen period, defining the market range. Primary signals are derived using a triple exponential moving average (EMA) of logarithmic closing prices, identifying trend changes with stop level plots and directional arrows. For secondary signals, the script uses a sequence of EMAs applied to the average price (HLC3) and an oscillator that measures the extremity of recent price movements, pinpointing potential entry points. The script also incorporates a sideways exit mechanism, comparing short-term and long-term EMAs of the average price to detect significant deviations, suggesting exit opportunities. This layered strategy offers a detailed perspective on market trends, momentum, and possible entry and exit points.
EMA-Based Trend Analysis Algorithm :
Utilizes an advanced algorithm that incorporates exponential moving averages (EMA) with specific length parameters. This algorithm analyzes the slope and direction of EMA lines to identify significant shifts in market trends.
Primary Signal Generation : Logarithmic and Triple EMA Function:
Primary signals are derived from a unique logarithmic function applied to price data, which is then processed through a series of three EMAs with distinct period settings. This combination targets potential trend initiation points by detecting shifts in the logarithmic trend curve.
Dynamic Stop Level Determination :
Employs a methodology involving the calculation of recent high and low price bars, adjusted by a factor that considers market volatility. This factor dynamically alters the sensitivity of the stop levels, aligning them with current market conditions.
Secondary Signal Identification During Pullbacks :
Secondary signals are identified through a complex comparison of the market's relative position to its moving averages. This involves calculating the divergence between price and moving averages, adjusted for the rate of change in the market, to flag strategic entry points during pullbacks.
Composite Market Trend Analysis for Signal Mechanism :
Signal generation integrates a composite of multiple technical indicators, each contributing unique mathematical calculations. This integration enhances the accuracy and reliability of entry and exit signals.
Practical Application in Trading :
> For trade initiation, primary signals are used to identify the start of potential trends, applying a specific mathematical threshold to confirm the trend change. Secondary signals focus on quantifying the pullback depth relative to recent market movements for additional entry opportunities.
> The script's dynamic stop loss adjustment incorporates a calculated moving average of recent highs and lows, providing a responsive and protective mechanism for open positions.
How to Use the Script:
Trade Initiation : Primary signals at trend onset can be used for potential entry points, or to simply establish a trend-bias, to watch for Strategic Entries signals.
Strategic Entries on Pullbacks : Secondary signals provide opportunities for additional entries or scaling into positions during pullbacks within the main trend.
Profit Targets and Exit Strategy : Profit target signals serve as potential exit points. For larger positions, consider partial exits at these targets while adjusting stop loss levels to secure profits, and hold the remaining position for further potential gains.
Dynamic Risk Management : Regularly adjust stop loss levels based on the script's dynamic stop level determination to protect against market reversals and lock in profits.
Integration with TrendGuard Pullback Trader Indicators:
The script is designed and intended to be used in conjunction with the "TrendGuard Pullback Trader Indicators ". This integration ensures a holistic approach to market analysis, combining the strengths of both scripts for a comprehensive understanding of market trends, momentum, and entry points.
Note: The lower indicators are from the 'TrendGuard Pullback Trader Indicators' script, complementing the 'TrendGuard Pullback Trader Signals' script seen here, which generates the 'cloud' and signals on the price chart.
The 'TrendGuard Pullback Traders Indicators” script can be found here :
Input Parameter Settings:
Important Usage Guidance: For seamless integration with its counterpart, the "TrendGuard Pullback Trader Indicators" script, it's crucial to align the input parameter settings across both scripts. When adjusting values from their defaults, ensure that corresponding parameters in both scripts are identically set. This synchronization is key to achieving a cohesive and accurate representation on your charts.
Intra-Bar Order Generation (IntraBar): Determines whether signals are generated within the current bar or only after it closes, enhancing flexibility in signal timing.
Stop Level Strength (StopLvlStr): Sets the strength for calculating stop levels, impacting the sensitivity of the script to market highs and lows for stop placement.
Primary Signal Display (PrimON_OFF): Toggles the visibility of primary signals on the chart, aiding in identifying trend initiation points.
Secondary Signal Display (SecON_OFF): Controls the display of secondary signals for opportunities during pullbacks, allowing traders to capitalize on additional entry points.
Stop Loss Level Display (StopLossLvls): Enables or disables the visualization of stop loss levels, crucial for risk management strategies.
Trend Length (TrendLen): Adjusts the length parameter for the EMA calculations, influencing how the script interprets trend duration and strength.
These parameters allow traders to customize the script’s functionality according to their trading style and preferences, ensuring a tailored approach to signal generation and risk management.
Trade Alerts:
The script includes an advanced alert system designed to notify traders of crucial trading signals. This can Especially be useful when using larger time frames where trade setups can take a longer period of time to develop:
Primary Buy/Sell Alerts: Alerts are triggered at primary signals, indicating potential trend initiation points for entering trades.
Secondary Buy/Sell Alerts: These alerts activate during secondary signals, highlighting opportunities within ongoing trends for strategic entries or exits.
Stop Loss Level Alerts: The script can alert traders when the price reaches or crosses the script-determined stop loss levels, aiding in timely decision-making for risk management.
Sideways Exit Alerts: Alerts for potential exits are generated in sideways market conditions, based on the script’s analysis of average price movements.
To set up these alerts, traders can use TradingView’s alert system to specify the conditions under which they receive notifications, such as when a certain shape (e.g., arrow up for buy, arrow down for sell) appears on the chart. This feature helps traders stay informed and react promptly to the dynamic market conditions.
The "TrendGuard Pullback Trader Signals " script is a meticulously crafted tool, essential for traders aiming to enhance their market analysis and decision-making across diverse trading environments. While the script offers advanced functionalities, it reaches its full potential when used alongside the "TrendGuard Pullback Trader Indicators" script. Traders are advised to familiarize themselves with both scripts for a well-rounded trading strategy.
As always, remember that trading involves risks and past performance is not indicative of future results.
You can see the “Author’s instructions" below to get immediate access to TrendGuard Pullback Trader Signals & the rest of the “Quantigenics Premium Indicator Suite”.
TrendGuard Pullback Trader Indicators [Quantigenics]The 'TrendGuard Pullback Trader Indicators' offers a synergistic representation of Trend Wave, Trend Pulse, and Trend Strength, each interrelated to provide intuitive and comprehensive market analysis—combining momentum, trend fluctuation insights, and trend strength in one cohesive tool.
The "TrendGuard Pullback Trader Indicators " utilize a novel approach in market trend analysis, distinctly combining multiple Exponential Moving Averages (EMA) layers for enhanced momentum tracking. This script employs a triple-layered EMA system for the Trend Wave component, adeptly filtering market noise and providing a refined view of underlying momentum. In parallel, the Trend Pulse feature contrasts current prices against a double-EMA of modified averages, offering granular insights into short-term market dynamics. This synergy is further enriched by the Trend Strength Identifier, which leverages the differential between fast and slow EMAs. This element is key in distinguishing significant market trends from minor fluctuations, thus offering a comprehensive gauge of market sentiment. These components, while advanced in their individual functionalities, are integrated to provide a holistic market analysis tool, far surpassing the capabilities of standard trend-following indicators. This sophisticated integration, underpinned by complex mathematical modeling, ensures that the "TrendGuard Pullback Indicators" script is not just a collection of indicators but a refined, cohesive system for strategic trading.
Integrated Analysis System: Trend Wave, Trend Pulse, and Trend Strength Identifier:
Trend Wave : Advanced Momentum Analysis
Calculation : Implements an advanced smoothing technique using a triple-layered Exponential Moving Average (EMA). This complex approach reduces market noise by refining the momentum tracking algorithm, thereby enhancing trend line smoothness.
Output : The output is visualized as a color-changing histogram, pivoting from green to red to indicate bullish and bearish momentum. This histogram is based on a scaled and adjusted Trend Wave value, providing a nuanced understanding of market momentum shifts.
Trend Pulse : Precision in Short-term Market Dynamics
Design : Contrasts a unique combination of high and low prices with their double EMA, diverging from standard closing price analysis. This results in a dynamic indicator sensitive to immediate market shifts.
Function : Acts as a vital complement to Trend Wave, offering fine-grained insights into short-term market behavior. It enhances the overall system by adding depth to the trend context set by the Trend Wave
Trend Strength Identifier: In-Depth Trend Viability Assessment Mechanism
Mechanism : Utilizes a sophisticated differential EMA strategy, comparing fast and slow EMA outputs. The script’s complexity extends beyond basic EMA differences, incorporating advanced trend/noise ratio calculations and trend quality assessments.
Indicator Dynamics : Generates a histogram that colors and positions itself based on the strength and direction of market trends, further informed by calculated trend quality metrics. It crucially differentiates between major trends and minor market noise.
System Synergy :
The three components are designed to operate in unison, forming an integrated trading system. Their interrelation is not merely additive but synergistic, where each element informs and enhances the others, making them indispensable to one another.
This interconnected functionality blends the indicators, as each component is tailored to contribute to a unified decision-making process, rather than functioning as standalone entities. The system's unique construction and its reliance on the interplay between its components underscore its distinctiveness and necessity for combined usage.
How to Trade with the "TrendGuard Pullback Trader Indicators"
Integration with "TrendGuard Pullback Signals" script :
The "TrendGuard Pullback Trader Indicators" script is an integral part of the "TrendGuard Pullback Trader" system, designed to operate in tandem with the "TrendGuard Pullback Trader Signals" script. This script amalgamates three sophisticated indicators, each contributing a unique perspective to market analysis.
This script, while useful as a standalone trading method, is one part of a two-part system. The “TrendGuard Pullback Trader Signals” script can be found below:
Integrated Trend Analysis: Aligning Wave, Pulse, and Strength :
Trend Wave & Trend Pulse Alignment : Look for moments when both the Trend Wave and Trend Pulse indicate a similar direction (both turning green for bullish or red for bearish). This alignment often marks the beginning of a new primary trend.
Confirmation with Trend Strength : Ensure that the Trend Strength histogram supports the new trend. A rising histogram above the lower threshold (white line) indicates growing trend strength.
Assessing Trend Strength and Potential Exhaustion :
Monitoring Threshold Lines : The upper (blue) and lower (white) threshold lines are crucial. When the Trend Strength histogram crosses these lines, it signals significant market conditions:
Above the Upper Threshold (Blue Line): Indicates a very strong trend but be cautious of potential trend exhaustion. A peak above this line may signal that the trend is overstretched.
Below the Lower Threshold (White Line): Suggests a weak or emerging trend, potentially signaling a trend reversal or consolidation phase.
Determining Trending or Ranging Market :
Above Lower Threshold : If the Trend Strength histogram consistently stays above the lower threshold, it suggests a trending market. Use this phase for trend-following strategies.
Below Lower Threshold : When the histogram frequently falls below this line, it may indicate a ranging or choppy market. In such conditions, consider adopting range-bound strategies or tightening stop losses.
Practical Application :
Entry Points : Trades can be initiated when there’s an alignment in Trend Wave and Pulse, coupled with supportive readings in Trend Strength. For instance, long positions during a green Trend Wave and Pulse, with the Trend Strength histogram rising above the lower threshold and vice versa for short entries.
Exit Points and Profit Taking : Consider exiting or taking profits when the Trend Strength crosses above the upper threshold, indicating potential trend exhaustion, especially if the trend strength histogram suddenly drops. Also, look for changes in the Trend Wave and Pulse for additional exit signals.
Alerts Setup : Utilize the provided alert features for key changes in the indicators, especially when the Trend Strength crosses threshold lines, to stay updated on significant market shifts.
Interpreting Indicator Interactions :
Refer to the accompanying images for visual examples of how these indicators interact and signal various market conditions. Understanding their synergy will enhance your ability to recognize key market phases and adjust your trading strategy accordingly.
The "TrendGuard Pullback Trader Indicators" script is intricately designed to be used in conjunction with the "TrendGuard Pullback Trader Signals" script, offering a cohesive and comprehensive trading strategy. Use both scripts together for a more robust trading method.
Adjustable Input Parameters
Each component in the script features customizable settings, designed to offer traders comprehensive control over the indicators. This flexibility allows for tailoring to specific trading styles, market conditions, and time frames. With options for adjusting visibility, selecting price types, modifying calculation lengths, and setting thresholds, these parameters ensure that the tool can be fine-tuned for a high degree of customization and precision, making it adaptable and effective for nearly all markets/symbols and time frames.
Important Usage Guidance: For seamless integration with its counterpart, the "TrendGuard Pullback Trader Signals" script, it's crucial to align the input parameter settings across both scripts. When adjusting values from their defaults, ensure that corresponding parameters in both scripts are identically set. This synchronization is key to achieving a cohesive and accurate representation on your charts.
Show Indicator Name (ShowName):
This parameter controls the display of the indicator's name on the chart. When enabled (`true`), it visually labels the indicator for ease of identification. Disabling (`false`) this feature offers a cleaner visual by removing the label.
Show Trend Wave Indicator (ShowTrendWave):
Activates or deactivates the Trend Wave indicator. When active (`true`), it displays a histogram based on the triple-layered exponential moving average (EMA) of the selected price type, providing a visual representation of market momentum trends. Deactivating (`false`) simplifies the chart by removing this histogram.
Trend Wave Price (TrendWavePrice):
Specifies the price data (close, open, high, low) used in calculating the Trend Wave. This choice affects how the Trend Wave responds to market movements, with each price type offering a different perspective on market momentum.
Trend Wave Length (TrendWaveLength):
Determines the overall calculation period for the triple-layered EMA in the Trend Wave, influencing its sensitivity. A higher value leads to a smoother, less volatile wave, focusing on longer-term market trends, whereas a lower value makes it more responsive to recent price actions.
Show Trend Pulse Indicator (ShowTrendPulse):
This parameter toggles the display of the Trend Pulse indicator, which analyzes the divergence between the current closing price and a double-EMA of a modified price average, providing insight into immediate market dynamics. Enabling (`true`) it adds this analysis to the chart, while disabling (`false`) removes it for focus on other trends.
Trend Pulse Length (TrendPulseLength):
Sets the length for the main double-EMA calculation in the Trend Pulse. A higher number smoothens the indicator, reducing sensitivity to minor price changes and highlighting more significant short-term trends.
Show Trend Strength Indicator (ShowTrendStrength):
Controls whether the Trend Strength indicator is displayed. This indicator uses a differential approach between fast and slow EMAs to assess the market's trend strength. Enabling it (`true`) provides a histogram view of the trend’s robustness, whereas disabling (`false`) omits this analysis.
Fast Average Length (FastAvgLen):
Specifies the period for the fast EMA in the Trend Strength indicator. Shorter periods make the EMA more sensitive to recent price changes, ideal for identifying new trend formations.
Slow Average Length (SlowAvgLen):
Determines the period for the slow EMA in the Trend Strength indicator. A longer period smoothens the EMA, useful for identifying sustained trend directions.
Threshold High (ThresholdHi):
This value sets a high threshold for the Trend Strength indicator. Values exceeding this threshold indicate a strong and established market trend, which can be critical for strategies focusing on trend continuity.
Threshold Low (ThresholdLow):
Defines a low threshold for the Trend Strength indicator. Values below this threshold suggest weak or emerging trends, signaling potential trend reversals or consolidations.
Threshold Trend (ThreshTrend):
Establishes a specific threshold within the Trend Strength indicator for identifying significant trends. Exceeding this threshold often suggests a trend with potential trading relevance.
Enable Threshold Low (ThresholdLowOnOff):
This option enables or disables the low threshold in the Trend Strength calculation. It allows traders to customize the indicator’s sensitivity to weaker trends.
Average Line (AvgLine):
Adjusts the period for an additional EMA line in the Trend Strength indicator. This line acts as a smoothing reference for the Trend Strength. This can also act as a threshold reference as when its below the ‘Threshold Low’ line this could identify sideways/choppy conditions.
Conclusion:
The "TrendGuard Pullback Trader Indicators" script provides a multidimensional analysis platform, combining in-depth momentum tracking, immediate market movement insights, and robust trend evaluation.
Remember, trading involves risk, and past performance is not indicative of future results.
You can see the “Author’s instructions" below to get immediate access to TrendGuard Pullback Trader Indicators & the rest of the “Quantigenics Premium Indicator Suite”.

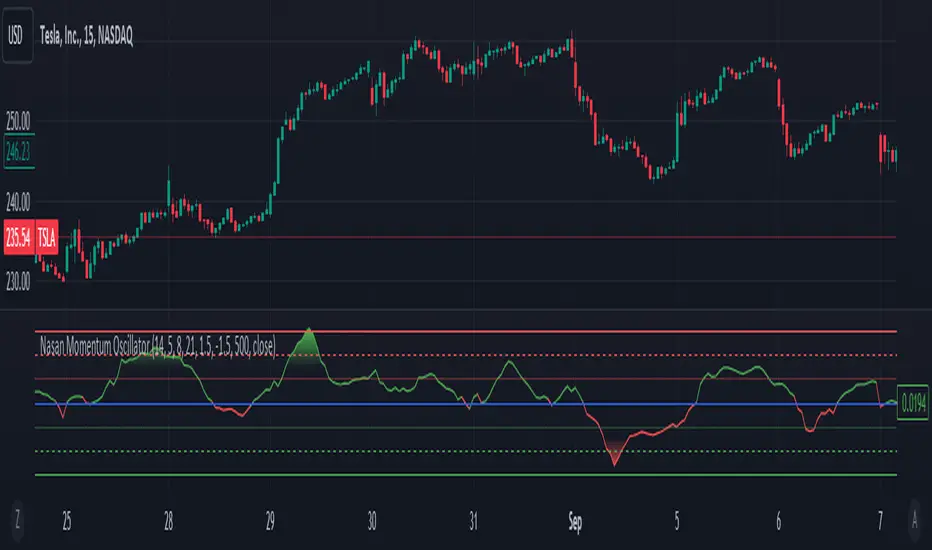
Dynamic Volume-Volatility Adjusted MomentumThis Indicator in a refinement of my earlier script PC*VC Moving average Old with easier to follow color codes, overbought and oversold zones. This script has converted the previous script into a standardized measure by converting it into Z-scores and also incorporated a volatility based dynamic length option. Below is a detailed Explanation.
The "Dynamic Volume-Volatility Adjusted Momentum" or "Nasan Momentum Oscillator" is designed to capture market momentum while accounting for volume and volatility fluctuations. It leverages the Typical Price (TP), calculated as the average of high, low, and close prices, and introduces the Price Coefficient (PC) based on deviations from the simple moving average (SMA) across various time frames. Additionally, the Volume Coefficient (VC) compares current volume to SMA, and calculates Intraday Volatility (IDV) which gauges the daily price range relative to the close. Then intraday volatility ratio is calculated ( IDV Ratio) as the ratio of current Intraday Volatility (IDV) to the average of IDV for three different length periods, which provides a relative measure of current intraday volatility compared to its recent historical average. An inter-day ATR based Relative Volatility (RV) is calculated to adjusts for changing market volatility based on which the dynamic length adjustment adapts the moving average (standard length is 14). The PC *VC/IDV Ratio integrates price, volume, and volatility information which provides a volume and volatility adjusted momentum. This volume and volatility adjusted momentum is converted into a standardized Z-Score. The Z-Score measures deviations from the mean. Color-coded plots visually represent momentum, and thresholds aid in identifying overbought or oversold conditions.
The indicator incorporates a nuanced approach to emphasize the joint impact of price and volume while considering the stabilizing effect of lower intraday volatility. Placing the volume ratio (VC) in the numerator means that higher volume positively contributes to the overall ratio, aligning with the observation that increased volumes often accompany robust price movements. Simultaneously, the decision to include the inverse of intraday volatility (1/IDV) in the denominator acts as a dampener, reducing the impact of extreme intraday volatility on the momentum indicator. This design choice aims to filter out noise, giving more weight to significant price changes supported by substantial trading activity. In essence, the indicator's design seeks to provide a more robust momentum measure that balances the influence of price, volume, and volatility in the analysis of market dynamics.
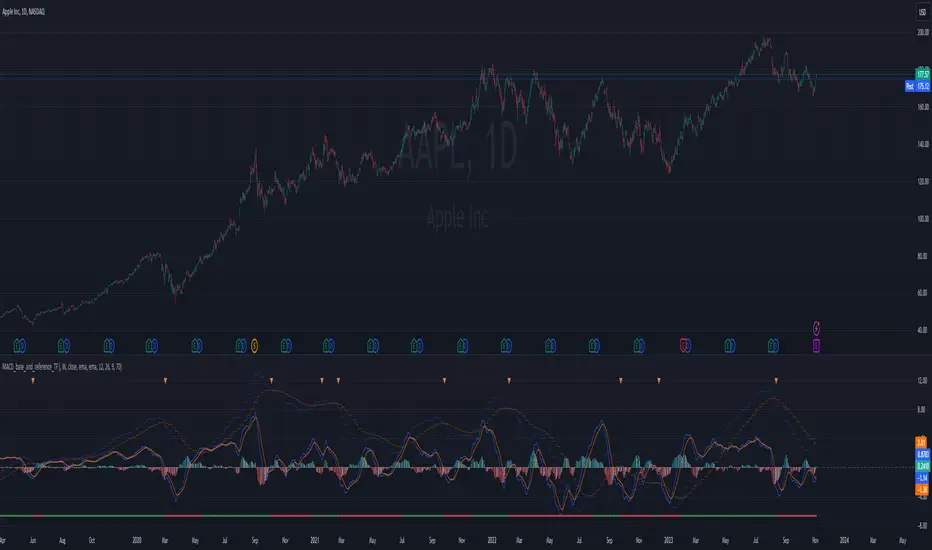
MACD_base_and_reference_TF//====================================================================================================================
The "MACD_with_reference" indicator aims to illustrate the MACD (Moving Average Convergence Divergence) on two distinct timeframes: the base timeframe (typically the chart's timeframe, e.g., 1D) and the reference timeframe (defaulted to 1W). This tool provides a means to determine momentum shifts within the stock, potentially guiding traders in adjusting or trimming positions.
// ================================================== INFO ==================================================
Key Features of the Indicator:
- Dual Timeframe MACD: Displays MACD on both the primary (base) and higher (reference) timeframes - transparent.
- Momentum Analysis: indication of MACD crossdown of the signal line on the refenence TF to indicate momentum loss on the higher timeframe, guiding decisions to manage positions.
- MACD Line Status: Beneath the chart, a red/green bar line signifies the MACD line's position relative to the signal line on the higher timeframe.
- Alert Creation: Allows for alerts on the MACD and signal line crossdown on the higher timeframe, aiding in planning stop-loss settings for owned stocks.
// ================================================== NOTES ==================================================
The "MACD_with_reference" indicator finds optimal usage in several scenarios:
- Chart Analysis: Replacing the MACD indicator during chart reviews.
- Alert Setup: Setting alerts for owned stocks to plan ahead for stop-loss placements or position closures.
// ================================================== TODO ==================================================
//#endregion ========================================================================================================
// Continue the script code...
VAcc (Velocity & Acceleration)VAcc (Velocity & Acceleration) is a momentum indicator published by Scott Cong in Stocks & Commodities V. 41:09 (8–15). It applies concepts from physics, namely velocity and acceleration, to financial markets. VAcc functions similarly to the popular MACD (Moving Average Convergence Divergence) indicator when using a longer lookback period, but produces more responsive results. With shorter periods, VAcc exhibits characteristics reminiscent of the stochastic oscillator.
🟠 Algorithm
The average velocity over the past n periods is defined as
((C - C_n) / n + (C - C_{n-1}) / (n - 1) + … + (C - C_i) / i + (C - C_1) / 1) / n
At its core, the velocity is a weighted average of the rate of change over the past n periods.
The calculation of the acceleration follows a similar process, where it’s defined as
((V - V_n) / n + (V - V_{n - 1}) / (n - 1) + … + (V - V_i) / i + (V - V_1) / 1) / n
🟠 Comparison with MACD
A comparison of VAcc and MACD on the daily Nasdaq 100 (NDX) chart from August 2022 helps demonstrate VAcc's improved sensitivity. Both indicators utilized a lookback period of 26 days and smoothing of 9 periods.
The VAcc histogram clearly shows a divergence forming, with momentum weakening as prices reached new highs. In contrast, the corresponding MACD histogram significantly lagged in confirming the divergence, highlighting VAcc's ability to identify subtle shifts in trend momentum more immediately than the traditional MACD.

MADALGO`s Enhanced OBV DivergencesDescription:
MADALGO's Enhanced OBV Divergences indicator is a unique tool designed for traders to visualize the divergences between price action and On Balance Volume (OBV), a fundamental aspect often indicative of underlying strength or weakness in the market. By keenly identifying these divergences, traders are better positioned to anticipate potential trend reversals or trend continuations, making this script an invaluable addition to their technical analysis toolkit.
This script meticulously scans for both regular and hidden bullish/bearish divergences, providing a comprehensive view of market sentiment. The core of this indicator is built around the OBV, which cumulatively adds or subtracts volume based on the price movement per period, thus providing a running total of volume and portraying the force behind the price movements.
The regular divergences are classic indicators of a potential reversal in the current trend, while hidden divergences are often indicative of trend continuation. These divergences are pinpointed based on the relative positions of the OBV and price highs/lows, over customizable lookback periods and within specified lookback ranges.
Features:
Regular and Hidden Divergences: Clearly marked bullish and bearish divergences provide insights into potential market turning points.
On Balance Volume (OBV) Line: Visualize the continuous flow of buying and selling pressure, enabling the identification of accumulation or distribution phases essential for understanding the market's strength or weakness.
Moving Average of OBV: An optional feature to smooth the OBV line, aiding in the identification of the overarching trend.
Dynamic Statistics Label: A floating label provides real-time updates on essential statistics like the Rate of Percentage Change (RPC) of OBV, the last divergences, and bars since the last divergences.
Inputs:
Pivot Lookback Right and Pivot Lookback Left: Define the lookback periods for identifying pivot points in the OBV line.
Max of Lookback Range and Min of Lookback Range: Define the range for considering divergences.
RPC Period: Defines the period for calculating the Rate of Percentage Change of the OBV.
MA Period: Defines the period for the optional moving average of the OBV.
Plot Bullish, Plot Hidden Bullish, Plot Bearish, Plot Hidden Bearish: Toggle visibility of respective divergences.
Plot Moving Average: Toggle visibility of the OBV moving average.
Usage:
Add the script to your TradingView chart.
Tailor the input parameters in the settings panel to align with your analysis requirements.
The divergences, OBV line, and optional moving average will be plotted on your chart, with a dynamic label displaying real-time statistics.
Set up alerts to be notified of identified divergences, enabling timely decision-making.
Alerts:
Regular bullish/bearish divergence in OBV found: Triggered when a regular bullish or bearish divergence is identified.
Hidden bullish/bearish divergence in OBV found: Triggered when a hidden bullish or bearish divergence is identified.
Underlying Concepts:
The OBV Divergences indicator is rooted in the principle that volume precedes price movement. When prices are rising with increased volume, it suggests that buying pressure is prevailing and may lead to continued upward momentum. Conversely, rising prices with decreasing volume might indicate a lack of buying conviction and could signal a potential price reversal. The identification of divergences between price and OBV can therefore serve as a powerful signal for traders. These examples can be seen below in the image
The Moving Average of the OBV further aids in understanding the prevailing trend by smoothing out the OBV line, providing a clearer picture of the market's longer-term momentum. The Rate of Percentage Change (RPC) provides insight into the momentum of volume, offering an additional layer of analysis. Together, these additional features enhance the core OBV analysis, enabling a more nuanced understanding of volume dynamics fundamental for making more informed trading decisions.
License:
This Source Code Form is subject to the terms of the Mozilla Public License, v. 2.0. If a copy of the MPL was not distributed with this file, you can obtain one at Mozilla Public License 2.0.

Crypto Spot/Futures Dominance Indicator with AlertsFutures/Spot Dominance Indicator:
Overview:
The futures/spot dominance indicator is a versatile tool used by traders and analysts to assess the relative strength or dominance of the futures market in relation to the spot (or cash) market for a specific asset. It offers insights into market sentiment, potential arbitrage opportunities, and risk management while incorporating the VWAP indicator for added context.
How It Works:
This indicator automatically detects and adapts to the futures symbol applied to the chart, simplifying the setup for traders. However, it still necessitates manual input of the corresponding spot pair to ensure accuracy.
Automatic Futures Symbol Detection: The indicator starts by automatically detecting the futures symbol on the trading chart, eliminating the need for manual configuration. This ensures that the indicator is applied to the correct futures contract.
Manual Spot Pair Entry: To provide a reliable reference point for the comparison, traders must manually input the corresponding spot symbol via the indicator's inputs. For instance, if the indicator detects the BTCUSDT.P futures symbol, traders would manually enter the BTCUSDT spot symbol.
Gathering Data: The indicator collects historical price data for both the detected futures contract and the manually specified spot symbol. This data includes open, high, low, and close prices, as well as trading volume.
VWAP Calculation: To gain a deeper understanding of price trends and market dynamics, the indicator calculates the VWAP (Volume Weighted Average Price) for both the futures and spot markets. The VWAP places more weight on prices with higher trading volume, offering a weighted average that reflects market consensus.
Premium/Discount Calculation: By subtracting the VWAP of the spot market from the VWAP of the futures market, the indicator quantifies the premium or discount of the futures price concerning the spot price. A positive value indicates a premium, while a negative value suggests a discount.
Plotting: The premium/discount value is displayed as a line on the chart, often alongside moving averages or other smoothing techniques for improved trend analysis.
Alerts: In addition to its analysis capabilities, this indicator now includes alerts to enhance your trading experience. It alerts you in the following scenarios:
Premium Above Average: Notifies you when the premium crosses above the average line.
Premium Below Average: Alerts you when the premium crosses below the average line.
Premium Above Zero: Provides an alert when the premium crosses above the zero line.
Premium Below Zero: Generates an alert when the premium crosses below the zero line.
Benefits of the Futures/Spot Dominance Indicator:
Sentiment Analysis: Traders use the indicator to assess market sentiment. A futures premium might signify bullish sentiment, while a discount could indicate bearish sentiment.
Arbitrage Opportunities: Identifying price discrepancies between futures and spot markets can help traders spot arbitrage opportunities, where they can profit from price differentials.
Risk Management: The indicator assists in evaluating risks associated with futures positions, helping traders manage their exposure effectively.
Trend Confirmation: When used in conjunction with other technical indicators, futures/spot dominance, along with VWAP, can provide additional confirmation of price trends.
Hedging: Investors and corporations use this tool to gauge the effectiveness of hedging strategies based on futures contracts.
Speculative Trading: Traders and investors use the indicator to inform speculative positions, aligning their trades with perceived market strength or weakness.
Insightful Analysis: Futures/spot dominance analysis, enriched by VWAP data, offers insights into market behavior during specific events or changes in economic conditions.
In summary, the futures/spot dominance indicator, with its integration of VWAP and automatic futures symbol detection, provides traders and investors with a comprehensive tool to assess market dynamics. It aids in sentiment analysis, risk management, and trend confirmation while offering potential arbitrage opportunities. The newly added alerts enhance the indicator's functionality, providing timely notifications of key market events. However, it relies on manual input of the corresponding spot pair to ensure precise comparisons between futures and spot markets. It should be used alongside other analysis techniques for a well-rounded view of the market.

YinYang MomentumOverview:
YinYang Momentum is a Price, Volume and Momentum Oscillator. Its job is to help you see swings in momentum and the strength of it. It also creates signals (Blood Diamond (Bear) and Support Cross (Bull)) where these momentum swings may occur. YinYang Momentum features 3 Price and 3 Volume 'Mountains with Ice'. There are Predictive, Regular and Confirming Mountains. You have the ability to overlay them on top of each other which helps to decipher momentum swings. The Volume Mountains are very important for showing the strength behind the Price Mountains and their Signals. If you look, you'll notice, as the 'Ice' starts to curve into the 'Mountains' it signals a potential shift in Momentum. The green Mountain is the Predictive, the Blue is the Regular and the Purple is the Confirming. You'll also notice that the Predictive Mountains movements happen first and move much more drastically. When you notice the regular starts to follow suit, there is a potential for a momentum shift. Shortly after, a signal will occur if this shift is actually happening. You can also check the Confirming Mountain for more confirmation (however, leaving the Confirming Mountain active can be a little confusing and make it harder to read signals). YinYang Momentum also features Information Tables. These tables display how the Blood Diamonds and Support Cross' are fairing on different Timeframes. This way, you'll be able to see if it's in a Bullish or Bearish state on critical Time Frames no matter what Timeframe you're trading on.
Before we move onto the tutorial, let's discuss what each of these Mountains and Ice are and how they work. All of our Mountains and Ice are calculated using the same algorithm but with varying sources, lengths and multipliers. We are essentially calculating differences in movement and then sending those differences into an EMA for the Mountain Base and SMA for the mountain Ice. The values we use for the Predictive are much lower and therefore occur much quicker as they aren’t averaged out on longer lengths/time frames; this helps to make it more of a leading Indicator which may predict momentum changes. Our Regular is over a medium length and multipliers that result in a smooth but generally also gradual movement that helps reliability; this helps it act as more of an ‘in the now’ Indication of momentum changes. Our Confirming uses lengths and multipliers that are of a higher value and longer span; this makes it more difficult to use for determining entry / exit locations as it's more of a lagging indicator, but it helps to add confirmation as to whether the momentum change has occurred and wasn't a false signal.
Tutorial:
YinYang Momentum may look like a lot is going on.. And well that’s cause there is.. But that doesn’t mean it's confusing or hard to read once you know what you’re looking for!
To make this tutorial a little easier to understand, let's turn off a few settings and dissect this indicator one thing at a time. YinYang Momentum features Price and Volume mountains. Currently in the photo above we have 2 Price Mountains and 1 Volume Mountain turned on (this is how it's set by default and how we recommend using it), however there are 3 Mountains available for both Price and Volume:
Predictive
Regular
Confirming
We are going to deactivate everything so it's the Regular Price Mountain + Ice enabled.
Now that it is just the Regular Price Mountain and Ice it is much easier to teach and understand. As you can see there are two different colors on the mountain. The dark blue is the Mountain and the light blue is the Ice.
The Ice moves before the mountain does and when the momentum happens it is larger than it (below or above). When the momentum starts to change however, the Ice curves inside of the mountain. As you can see here, where the BUY signal (red cross) is, the Ice curves into the mountain; also where the SELL signal (red circle) is, the Ice curves into the mountain. The Ice curving into the mountain is a very important leading indication that momentum is changing and the Signals (crosses and diamonds) help solidify this momentum change.
The Index levels for YinYang Momentum is a little different than most oscillators that range from 0-100. Instead YinYang Momentum’s neutral level is 0 and it ranges from -100 to 100. For these reasons, the Viable Range for Buying is -40 to -70 and the Optimal Range for Buying is -70 to -100. For Selling, the Viable Range is 40 to 70 and the Optimal Range is 70 to 100.
If you look at the example above, you can see whenever it has been in the optimal range and the signal occurred, it may potentially be an amazing time to buy or sell. However, when it is within the Viable Range it can be hit or miss. The reason for this is because we are only looking at the Regular Price Mountain and Ice. Once we turn on the Predictive Price and Regular Volume we will have a much clearer idea as to what is noise and what is a true purchase signal. Why don’t we turn on Predictive Price Mountains and Ice so you can see what we’re talking about:
So there are 2 big things that changed when we added the predictive price mountains + ice.
We can see that where the orange circle is, is just noise, it isn’t a viable buy signal.
We can see that where the red circle is, is actually a better spot to sell than the previous marked white circle slightly to the right of it.
We will explain why both above are true, but first let's explain how we were able to deduce this information.
There are 5 rules when deciphering if the signal is a true signal or just noise.
You want the predictive mountain to be decently spaced out from the regular mountain. Refer to the example above how that should look. Remember it's predictive so with parabolic movements it will get quite spaced out. If the price went up but slowly, it generally won’t be as spaced and isn’t as strong of a signal predictor.
You want the Ice to be of a decent size and to curve in on both the Predictive and Regular Mountains. Both arrows (red and white circle arrows) are pointing to Ice that does just that. The Predictive mountain is of decent size and spaced out and the Ice curves in sharply on the Predictive, before curving in sharply on the Regular and then we get both Predictive and Regular Support Cross on the Same Bar.
When you get the Signals (Predictive and Regular) the amount of bars between them matters a lot! On the same Bar is ideal, however 1-2, max 3 bars between them is acceptable. Any more than 3 bars spacing and it's too risky of a signal because that means momentum change was happening but then stopped before picking back up. This doesn’t mean it can’t be a good signal, it just means it is much more risky and we don’t recommend it.
You don’t want Signal Clustering. You can see an example of this from the picture above. Signal Clustering is where signals are back to back over and over. During this time the momentum is in a consolidation phase and easily swaps back and forth between signals. These signals are not reliable and should not be traded on. We only want to act on clear momentum based signals.
Last but certainly not least, actually, the most important! Ensure that the Mountain + Ice for both the Predictive and Regular is at the bare minimum touching (preferably inside) the Viable Range. The Optimal range is best, but most mountains don’t make it that far. Viable Range is where you will make most of your trades from. Sometimes a great signal happens with all 5 of these rules but it is only touching the Viable Range right at 40 or -40. This CAN be okay, but is also much more risky than if it was at 50 to 60 or -50 to -60.
Based on the 5 rules mentioned, take a second and look back at the photo where we initially added the Predictive Price mountains and Ice, can you decipher why the orange circle is just noise, and can you see why the red circle is a better sell location than the white circle slightly to the right of it?
Let’s bring that photo back up now and let’s discuss this:
Let's start with the orange circle:
This orange circle, without the predictive, was hard to tell if it was a good location to buy or not, but the second we turned it on we could clearly see it was just noise.
The spacing between the Predictive mountains and the Regular is almost non-existent.
There was signal clustering shortly before this signal.
Remember, there doesn’t have to be many rules broken for a signal to be either too risky or not valid at all. The safest trades are ones where it meets the requirements of all 5 rules (6 once we talk about volume, but 5 price rules).
Now, let's discuss the red circle:
This red circle, although it could have been chosen with just the regular, was much more noticeable with the predictive added on top.
It has a perfect spacing between the Predictive and the Regular all the way to the peak.
The Ice is large and both curve in very nicely towards the mountains.
The signals are within 2 bars apart from each other.
There is no signal clustering.
The Predictive is within the Viable Range and the Regular is just touching it.
For these reasons, the red circle actually would have been where you sold and not the white circle beside it.
This pretty much covers the Price Mountains, but wait! The most important Cherry on Top to your decision making process is coming next!
We have just enabled our Regular Volume Mountains and Ice (which are the black mountains + ice). As you can see, we have circled what we call the ‘Perfect Combo’. This Perfect combo is when you have all 5 Price rules met COMBINED with a high volume mountain. The Volume Mountain and Ice act as strength. They aren’t biased towards bulls or bears, they simply show strength to whatever signal is present with it.
For example, if all 5 rules are met with Price on a Blood Diamond (Bear) Signal and there is a High Volume Mountain then this is also a ‘Perfect Combo’. That Blood Diamond signal will potentially have great strength behind it. The Viable and Optimal Ranges don’t apply to volume mountains. Any volume mountain, even close to the Viable Range, is considered to be a very high mountain. High volume is when the mountain is above 0 and low volume is when it's below 0. Any signal with low volume has less of a chance of being correct, regardless of whether it abides by all 5 price rules.
You can see here that the 5 Price rules are achieved but the volume mountain is low. It is at -25. Since the 5 Price rules are right, there is still a decent amount of accuracy to this signal and the price did plummet after, but not nearly as much as it would have if the volume mountain was high with it.
We have turned our Confirming Price Mountain on here so you can get an idea of what it looks like and how it’s used. If you refer to the Support Crosses and Blood Diamonds circled in white, you’ll see that although they both received their signals on the Predictive and Regular, neither of them received it on the Confirming. This shows that these signals lost momentum shortly after. However if you look at both the red and green circles, you’ll see that they both received their confirming signals and that it helped give those signals momentum. The Confirming Price Mountain is meant to help confirm if the momentum change is still on track and the max 3 bars from the regular signal rule still applies to it. However its height within the viable and optimal range is important, just not as relevant
Before we move on to our Information Tables we want to take a second just to discuss our Volume Mountains and Ice. We haven’t had a chance yet to discuss the Predictive or Confirming Volume. When it comes to our Volume Mountains + Ice, we don’t recommend having more than 1 on at a time. The reason we have included the Predictive and Confirming is in case you find they suit your Trading Style best, not necessarily to be used the same way the Price Mountains and Ice are. The main reason for this is due to the fact that the Volume Mountains are much smaller and when overlaid on top of each other can make a confusing blur that is hard to decipher.
In this example above we have enabled both Predictive and Regular Volume just so you can understand what we are talking about. The two together can be rather confusing and actually interfere with your decision making process. For this reason, we highly recommend finding the Volume Mountain that suits your trading style best and solely sticking to that.
Our Predictive Volume Mountains and Ice may help sense volume changes before they’ve even happened. This can be very useful if your Trading Style revolves around heavy volume changes.
Our Confirming Volume Mountains and Ice are much slower and smaller, but they help show the movement of volume that has occurred already. This can be used to help see the movement of volume without fearing it may or may not happen.
Our Information Tables are there to show you valuable information on whether it is in a state of Support Cross or Blood Diamond on 6 different Time Frames at the same time. The % it shows you displays how much of a price change has occurred since that signal has happened. It is important to note, if for instance you see it is in a state of Support Cross but the % is negative, this generally means it is going to switch to Blood Diamond soon and vice versa. Therefore if you are in a trade, especially on a lower Time Frame and you are watching the 1 Day or a higher Time Frame and notice that the % is getting less and less, it may be a good time to get out.
We will conclude our Tutorial here. If you have any Questions, Concerns, Suggestions or Comments please don’t hesitate to contact us.
Settings:
1. Show Predictive to Confirmed Trendline:
The Predictive to Confirmed Trendline is very useful for seeing when the predictive (Support Cross or Blood Diamond) has hit the confirmed (It’s a strong confirmation that the trend may be shifting). This trendline also features a Moving Average which helps give you a solid marker for when the Regular / Predictive mountains cross under or over it that a momentum swing may occur. Somewhat like when the RSI crosses above/below its Moving Average it dictates momentum change, that is likewise how to interpret when it happens with the mountains and this trendline.
2. Show Price Ice and Mountains based on:
The Price Ice and Mountains are very important when it comes to deciphering signal strength. For example, When the mountains are very low (regular and predictive) and are between the 2 red line (undervalued) or even possibly below the bottom red line, and the Ice on the mountains starts to curve into the mountains and then the Predictive and Regular Support Cross occur; this is a very strong Bullish Signal. But wait, that's not all, the cherry on top is when the volume mountain (black) is ALSO high while this occurs; the Volume Mountain adds Strength to the signal. When the volume mountain is high too during this ‘Perfect Combo’ this may potentially lead to very bullish price movement occurring soon. Here is an overview of each mountain:
2.1. Predictive: Are the least reliable, but they move first and nothing will move without the predictive moving first, and getting you ready.
2.2. Regular: Are the most accurate, they don't signify strength on its own, but they sure show some momentum.
2.3. Confirming: Are slightly behind when it comes to displaying data, and therefore shouldn't be used for entry / exit, but rather to show if the trend movement has truly been confirmed or not.
When the Ice starts to curve into the Mountain, (either upward or below) it signifies possible momentum change. There are Crosses (Bull), and Diamonds (Bear) to show when they've crossed. Cross' and Diamonds balance each other out and therefore there can never be more than 1 in a row (of the same type). When the Ice and Mountain size is very large (between 40 and 70), and the predictive Ice starts to curve into its mountain, and then the predictive curves into the Regular, and the Regular Ice is curving into its Mountain, then it may have some strong weight behind that signal. IMPORTANT: refer to Volume tooltip below for how to increase the signal strength even more.
3. Show Volume Ice and Mountains based on:
The Volume Ice and Mountains are for giving strength to the Price's signals and Size. When there is the perfect combo (described above) AND the Volume Ice + Mountain is high, then there may be a lot of strength to that Price signals (whether it is Cross (Bull), or Diamond (Bear)).
IMPORTANT: High volume mountains, unlike Price, don't mean good or bad. Volume shows strength to the Price, and therefore if there are high Volume mountains during a Diamond (Bearish), then there may be a lot of strength to that signal and vice versa.
4. Show Information Tables:
Information tables are used to display 6 different Time Frames and whether or not each time frame is in a state of Blood Diamond (red) or Support Cross (green). They also show how much % in price has changed since the current signal happened. These are very useful for seeing how the price is fairing on different Time Frames without having to constantly change your timeframe. For instance, maybe you base your entry off the 1 day time frame but then you swing trade on the 15 minute. Well, after you’ve confirmed your entry position and are sitting on the 15 minute, you can stay on the 15 minute and see how it is fairing on the 1 day, 5 minute or whatever time frame you choose. This way you aren’t distracted from the trade at hand. All of these Time Frames can be adjusted in the Settings (GUI) to whatever resolution you wish.
5. Res1 / Res2/ Res3 / Res4 / Res5 / Res6:
These represent the different resolutions (Time Frames) being used in your information tables and can be modified to display whatever resolution works best for your trading style. By default they are:
Res1: Current Timeframe
Res2: 15 Minute
Res3: 1 Hour
Res4: 4 Hour
Res5: 1 Day
Res6: 1 Week
Backup Res (not changeable): 5 Minute (this is only used if your Current Timeframe in Res1 is a duplicate of one of the other resolutions)
HAPPY TRADING!

GKD-C Super Smoother Velocity w/ Floating Levels [Loxx]The Giga Kaleidoscope GKD-C Super Smoother Velocity w/ Floating Levelsis a confirmation module included in Loxx's "Giga Kaleidoscope Modularized Trading System."
█ GKD-C Super Smoother Velocity w/ Floating Levels
The Super Smoother Velocity with Floating Levels is a technical tool devised to provide clearer price movement insights, drawing from the power of the "Super Smoother" function.
The Super Smoother function is fundamentally a unique formula which leverages trigonometric and exponential concepts to generate a highly smooth value for the given data. This function's intent is to help diminish noise, making the price movements more discernible.
Ehlers Super Smoother:
Developed by John Ehlers, the Super Smoother is designed to improve the data smoothing process by eliminating noise in the data. The traditional moving averages, like the simple moving average (SMA) or exponential moving average (EMA), often incorporate noise which can provide false trading signals. Ehlers' goal with the Super Smoother was to produce a filtering technique that retains the smoothness of a moving average while being more responsive to recent price changes and reducing lag.
Purpose:
The Super Smoother aims to minimize the lag seen in traditional moving averages by reducing the influence of short-term price noise. This noise can cause erratic movements in simple and exponential moving averages, leading to potential false signals.
Mechanism:
The Super Smoother uses a combination of exponential moving averages with a cyclic component to achieve its goal. By introducing a frequency component (through the use of a sine wave), the Super Smoother tries to focus on the more dominant, longer-term cycles in the data rather than the short-term noise.
The cyclic component is determined by the length (or period) provided to the Super Smoother. This essentially dictates which cycle the filter will focus on the most.
Advantages:
1. Reduced Lag: As compared to traditional moving averages, the Super Smoother's response to price changes is quicker, meaning it's more reactive to recent price data.
2. Noise Reduction: By focusing on dominant cycles and reducing the influence of short-term noise, it offers a cleaner and smoother data representation.
3. Versatility: While designed for price data, it can be applied to other indicators to reduce their noise.
In trading applications, the Ehlers Super Smoother can provide clearer signals about the dominant trend in price data. This can be particularly useful in noisy markets or on lower timeframes where traditional moving averages might produce many false or premature signals.
Settings
1. The momentum period, which can be imagined as the heartbeat of this indicator, setting its pace.
2. The range for the maximum and minimum momentum, offering a lens through which to view the price movement extremes.
3. Predefined levels up and down, which are essentially markers that provide a perspective on the potential high and low turning points.
A significant feature here is the signaling mechanism. This mechanism alerts users to potential buy or sell opportunities based on the way the Super Smoother function crosses certain thresholds. There are two distinct modes for these signals:
Levels Mode: This watches for the Super Smoother's crossing of the user-defined upper and lower levels.
Middle Mode: This focuses on the median, observing if the Super Smoother crosses this midway point.
█ Giga Kaleidoscope Modularized Trading System
Core components of an NNFX algorithmic trading strategy
The NNFX algorithm is built on the principles of trend, momentum, and volatility. There are six core components in the NNFX trading algorithm:
1. Volatility - price volatility; e.g., Average True Range, True Range Double, Close-to-Close, etc.
2. Baseline - a moving average to identify price trend
3. Confirmation 1 - a technical indicator used to identify trends
4. Confirmation 2 - a technical indicator used to identify trends
5. Continuation - a technical indicator used to identify trends
6. Volatility/Volume - a technical indicator used to identify volatility/volume breakouts/breakdown
7. Exit - a technical indicator used to determine when a trend is exhausted
8. Metamorphosis - a technical indicator that produces a compound signal from the combination of other GKD indicators*
*(not part of the NNFX algorithm)
What is Volatility in the NNFX trading system?
In the NNFX (No Nonsense Forex) trading system, ATR (Average True Range) is typically used to measure the volatility of an asset. It is used as a part of the system to help determine the appropriate stop loss and take profit levels for a trade. ATR is calculated by taking the average of the true range values over a specified period.
True range is calculated as the maximum of the following values:
-Current high minus the current low
-Absolute value of the current high minus the previous close
-Absolute value of the current low minus the previous close
ATR is a dynamic indicator that changes with changes in volatility. As volatility increases, the value of ATR increases, and as volatility decreases, the value of ATR decreases. By using ATR in NNFX system, traders can adjust their stop loss and take profit levels according to the volatility of the asset being traded. This helps to ensure that the trade is given enough room to move, while also minimizing potential losses.
Other types of volatility include True Range Double (TRD), Close-to-Close, and Garman-Klass
What is a Baseline indicator?
The baseline is essentially a moving average, and is used to determine the overall direction of the market.
The baseline in the NNFX system is used to filter out trades that are not in line with the long-term trend of the market. The baseline is plotted on the chart along with other indicators, such as the Moving Average (MA), the Relative Strength Index (RSI), and the Average True Range (ATR).
Trades are only taken when the price is in the same direction as the baseline. For example, if the baseline is sloping upwards, only long trades are taken, and if the baseline is sloping downwards, only short trades are taken. This approach helps to ensure that trades are in line with the overall trend of the market, and reduces the risk of entering trades that are likely to fail.
By using a baseline in the NNFX system, traders can have a clear reference point for determining the overall trend of the market, and can make more informed trading decisions. The baseline helps to filter out noise and false signals, and ensures that trades are taken in the direction of the long-term trend.
What is a Confirmation indicator?
Confirmation indicators are technical indicators that are used to confirm the signals generated by primary indicators. Primary indicators are the core indicators used in the NNFX system, such as the Average True Range (ATR), the Moving Average (MA), and the Relative Strength Index (RSI).
The purpose of the confirmation indicators is to reduce false signals and improve the accuracy of the trading system. They are designed to confirm the signals generated by the primary indicators by providing additional information about the strength and direction of the trend.
Some examples of confirmation indicators that may be used in the NNFX system include the Bollinger Bands, the MACD (Moving Average Convergence Divergence), and the MACD Oscillator. These indicators can provide information about the volatility, momentum, and trend strength of the market, and can be used to confirm the signals generated by the primary indicators.
In the NNFX system, confirmation indicators are used in combination with primary indicators and other filters to create a trading system that is robust and reliable. By using multiple indicators to confirm trading signals, the system aims to reduce the risk of false signals and improve the overall profitability of the trades.
What is a Continuation indicator?
In the NNFX (No Nonsense Forex) trading system, a continuation indicator is a technical indicator that is used to confirm a current trend and predict that the trend is likely to continue in the same direction. A continuation indicator is typically used in conjunction with other indicators in the system, such as a baseline indicator, to provide a comprehensive trading strategy.
What is a Volatility/Volume indicator?
Volume indicators, such as the On Balance Volume (OBV), the Chaikin Money Flow (CMF), or the Volume Price Trend (VPT), are used to measure the amount of buying and selling activity in a market. They are based on the trading volume of the market, and can provide information about the strength of the trend. In the NNFX system, volume indicators are used to confirm trading signals generated by the Moving Average and the Relative Strength Index. Volatility indicators include Average Direction Index, Waddah Attar, and Volatility Ratio. In the NNFX trading system, volatility is a proxy for volume and vice versa.
By using volume indicators as confirmation tools, the NNFX trading system aims to reduce the risk of false signals and improve the overall profitability of trades. These indicators can provide additional information about the market that is not captured by the primary indicators, and can help traders to make more informed trading decisions. In addition, volume indicators can be used to identify potential changes in market trends and to confirm the strength of price movements.
What is an Exit indicator?
The exit indicator is used in conjunction with other indicators in the system, such as the Moving Average (MA), the Relative Strength Index (RSI), and the Average True Range (ATR), to provide a comprehensive trading strategy.
The exit indicator in the NNFX system can be any technical indicator that is deemed effective at identifying optimal exit points. Examples of exit indicators that are commonly used include the Parabolic SAR, the Average Directional Index (ADX), and the Chandelier Exit.
The purpose of the exit indicator is to identify when a trend is likely to reverse or when the market conditions have changed, signaling the need to exit a trade. By using an exit indicator, traders can manage their risk and prevent significant losses.
In the NNFX system, the exit indicator is used in conjunction with a stop loss and a take profit order to maximize profits and minimize losses. The stop loss order is used to limit the amount of loss that can be incurred if the trade goes against the trader, while the take profit order is used to lock in profits when the trade is moving in the trader's favor.
Overall, the use of an exit indicator in the NNFX trading system is an important component of a comprehensive trading strategy. It allows traders to manage their risk effectively and improve the profitability of their trades by exiting at the right time.
What is an Metamorphosis indicator?
The concept of a metamorphosis indicator involves the integration of two or more GKD indicators to generate a compound signal. This is achieved by evaluating the accuracy of each indicator and selecting the signal from the indicator with the highest accuracy. As an illustration, let's consider a scenario where we calculate the accuracy of 10 indicators and choose the signal from the indicator that demonstrates the highest accuracy.
The resulting output from the metamorphosis indicator can then be utilized in a GKD-BT backtest by occupying a slot that aligns with the purpose of the metamorphosis indicator. The slot can be a GKD-B, GKD-C, or GKD-E slot, depending on the specific requirements and objectives of the indicator. This allows for seamless integration and utilization of the compound signal within the GKD-BT framework.
How does Loxx's GKD (Giga Kaleidoscope Modularized Trading System) implement the NNFX algorithm outlined above?
Loxx's GKD v2.0 system has five types of modules (indicators/strategies). These modules are:
1. GKD-BT - Backtesting module (Volatility, Number 1 in the NNFX algorithm)
2. GKD-B - Baseline module (Baseline and Volatility/Volume, Numbers 1 and 2 in the NNFX algorithm)
3. GKD-C - Confirmation 1/2 and Continuation module (Confirmation 1/2 and Continuation, Numbers 3, 4, and 5 in the NNFX algorithm)
4. GKD-V - Volatility/Volume module (Confirmation 1/2, Number 6 in the NNFX algorithm)
5. GKD-E - Exit module (Exit, Number 7 in the NNFX algorithm)
6. GKD-M - Metamorphosis module (Metamorphosis, Number 8 in the NNFX algorithm, but not part of the NNFX algorithm)
(additional module types will added in future releases)
Each module interacts with every module by passing data to A backtest module wherein the various components of the GKD system are combined to create a trading signal.
That is, the Baseline indicator passes its data to Volatility/Volume. The Volatility/Volume indicator passes its values to the Confirmation 1 indicator. The Confirmation 1 indicator passes its values to the Confirmation 2 indicator. The Confirmation 2 indicator passes its values to the Continuation indicator. The Continuation indicator passes its values to the Exit indicator, and finally, the Exit indicator passes its values to the Backtest strategy.
This chaining of indicators requires that each module conform to Loxx's GKD protocol, therefore allowing for the testing of every possible combination of technical indicators that make up the six components of the NNFX algorithm.
What does the application of the GKD trading system look like?
Example trading system:
Backtest: Multi-Ticker CC Backtest
Baseline: Hull Moving Average
Volatility/Volume: Hurst Exponent
Confirmation 1: Advance Trend Pressure as shown on the chart above
Confirmation 2: uf2018
Continuation: Coppock Curve
Exit: Rex Oscillator
Metamorphosis: Baseline Optimizer
Each GKD indicator is denoted with a module identifier of either: GKD-BT, GKD-B, GKD-C, GKD-V, GKD-M, or GKD-E. This allows traders to understand to which module each indicator belongs and where each indicator fits into the GKD system.
█ Giga Kaleidoscope Modularized Trading System Signals
Standard Entry
1. GKD-C Confirmation gives signal
2. Baseline agrees
3. Price inside Goldie Locks Zone Minimum
4. Price inside Goldie Locks Zone Maximum
5. Confirmation 2 agrees
6. Volatility/Volume agrees
1-Candle Standard Entry
1a. GKD-C Confirmation gives signal
2a. Baseline agrees
3a. Price inside Goldie Locks Zone Minimum
4a. Price inside Goldie Locks Zone Maximum
Next Candle
1b. Price retraced
2b. Baseline agrees
3b. Confirmation 1 agrees
4b. Confirmation 2 agrees
5b. Volatility/Volume agrees
Baseline Entry
1. GKD-B Baseline gives signal
2. Confirmation 1 agrees
3. Price inside Goldie Locks Zone Minimum
4. Price inside Goldie Locks Zone Maximum
5. Confirmation 2 agrees
6. Volatility/Volume agrees
7. Confirmation 1 signal was less than 'Maximum Allowable PSBC Bars Back' prior
1-Candle Baseline Entry
1a. GKD-B Baseline gives signal
2a. Confirmation 1 agrees
3a. Price inside Goldie Locks Zone Minimum
4a. Price inside Goldie Locks Zone Maximum
5a. Confirmation 1 signal was less than 'Maximum Allowable PSBC Bars Back' prior
Next Candle
1b. Price retraced
2b. Baseline agrees
3b. Confirmation 1 agrees
4b. Confirmation 2 agrees
5b. Volatility/Volume agrees
Volatility/Volume Entry
1. GKD-V Volatility/Volume gives signal
2. Confirmation 1 agrees
3. Price inside Goldie Locks Zone Minimum
4. Price inside Goldie Locks Zone Maximum
5. Confirmation 2 agrees
6. Baseline agrees
7. Confirmation 1 signal was less than 7 candles prior
1-Candle Volatility/Volume Entry
1a. GKD-V Volatility/Volume gives signal
2a. Confirmation 1 agrees
3a. Price inside Goldie Locks Zone Minimum
4a. Price inside Goldie Locks Zone Maximum
5a. Confirmation 1 signal was less than 'Maximum Allowable PSVVC Bars Back' prior
Next Candle
1b. Price retraced
2b. Volatility/Volume agrees
3b. Confirmation 1 agrees
4b. Confirmation 2 agrees
5b. Baseline agrees
Confirmation 2 Entry
1. GKD-C Confirmation 2 gives signal
2. Confirmation 1 agrees
3. Price inside Goldie Locks Zone Minimum
4. Price inside Goldie Locks Zone Maximum
5. Volatility/Volume agrees
6. Baseline agrees
7. Confirmation 1 signal was less than 7 candles prior
1-Candle Confirmation 2 Entry
1a. GKD-C Confirmation 2 gives signal
2a. Confirmation 1 agrees
3a. Price inside Goldie Locks Zone Minimum
4a. Price inside Goldie Locks Zone Maximum
5a. Confirmation 1 signal was less than 'Maximum Allowable PSC2C Bars Back' prior
Next Candle
1b. Price retraced
2b. Confirmation 2 agrees
3b. Confirmation 1 agrees
4b. Volatility/Volume agrees
5b. Baseline agrees
PullBack Entry
1a. GKD-B Baseline gives signal
2a. Confirmation 1 agrees
3a. Price is beyond 1.0x Volatility of Baseline
Next Candle
1b. Price inside Goldie Locks Zone Minimum
2b. Price inside Goldie Locks Zone Maximum
3b. Confirmation 1 agrees
4b. Confirmation 2 agrees
5b. Volatility/Volume agrees
Continuation Entry
1. Standard Entry, 1-Candle Standard Entry, Baseline Entry, 1-Candle Baseline Entry, Volatility/Volume Entry, 1-Candle Volatility/Volume Entry, Confirmation 2 Entry, 1-Candle Confirmation 2 Entry, or Pullback entry triggered previously
2. Baseline hasn't crossed since entry signal trigger
4. Confirmation 1 agrees
5. Baseline agrees
6. Confirmation 2 agrees

Super Smoother Velocity w/ Floating Levels [Loxx]The Super Smoother Velocity with Floating Levels is a technical tool devised to provide clearer price movement insights, drawing from the power of the "Super Smoother" function.
The Super Smoother function is fundamentally a unique formula which leverages trigonometric and exponential concepts to generate a highly smooth value for the given data. This function's intent is to help diminish noise, making the price movements more discernible.
█ Ehlers Super Smoother:
Developed by John Ehlers, the Super Smoother is designed to improve the data smoothing process by eliminating noise in the data. The traditional moving averages, like the simple moving average (SMA) or exponential moving average (EMA), often incorporate noise which can provide false trading signals. Ehlers' goal with the Super Smoother was to produce a filtering technique that retains the smoothness of a moving average while being more responsive to recent price changes and reducing lag.
Purpose:
The Super Smoother aims to minimize the lag seen in traditional moving averages by reducing the influence of short-term price noise. This noise can cause erratic movements in simple and exponential moving averages, leading to potential false signals.
Mechanism:
The Super Smoother uses a combination of exponential moving averages with a cyclic component to achieve its goal. By introducing a frequency component (through the use of a sine wave), the Super Smoother tries to focus on the more dominant, longer-term cycles in the data rather than the short-term noise.
The cyclic component is determined by the length (or period) provided to the Super Smoother. This essentially dictates which cycle the filter will focus on the most.
Advantages:
1. Reduced Lag: As compared to traditional moving averages, the Super Smoother's response to price changes is quicker, meaning it's more reactive to recent price data.
2. Noise Reduction: By focusing on dominant cycles and reducing the influence of short-term noise, it offers a cleaner and smoother data representation.
3. Versatility: While designed for price data, it can be applied to other indicators to reduce their noise.
In trading applications, the Ehlers Super Smoother can provide clearer signals about the dominant trend in price data. This can be particularly useful in noisy markets or on lower timeframes where traditional moving averages might produce many false or premature signals.
█ Settings
1. The momentum period, which can be imagined as the heartbeat of this indicator, setting its pace.
2. The range for the maximum and minimum momentum, offering a lens through which to view the price movement extremes.
3. Predefined levels up and down, which are essentially markers that provide a perspective on the potential high and low turning points.
A significant feature here is the signaling mechanism. This mechanism alerts users to potential buy or sell opportunities based on the way the Super Smoother function crosses certain thresholds. There are two distinct modes for these signals:
Levels Mode: This watches for the Super Smoother's crossing of the user-defined upper and lower levels.
Middle Mode: This focuses on the median, observing if the Super Smoother crosses this midway point.
Visual representation is enhanced with color coding. When in Middle Mode, if the Super Smoother is above the median, it's displayed in green, suggesting positive momentum. Conversely, red indicates it's below the median, hinting at negative momentum. In the Levels Mode, green signals the Super Smoother is above the upper level, while red indicates it's below the lower level. Gray is used when the value lies between the two extremes.
For those who prefer a visual cue on their charts, there's an option to showcase colored bars based on the momentum's direction. Additionally, small symbols can be plotted to highlight buy ("L") or sell ("S") signals, depending on the Super Smoother's movement in relation to the predefined thresholds.
Lastly, alert conditions can be set up to notify users whenever a potential buy or sell situation arises, making sure they don't miss key trading opportunities.
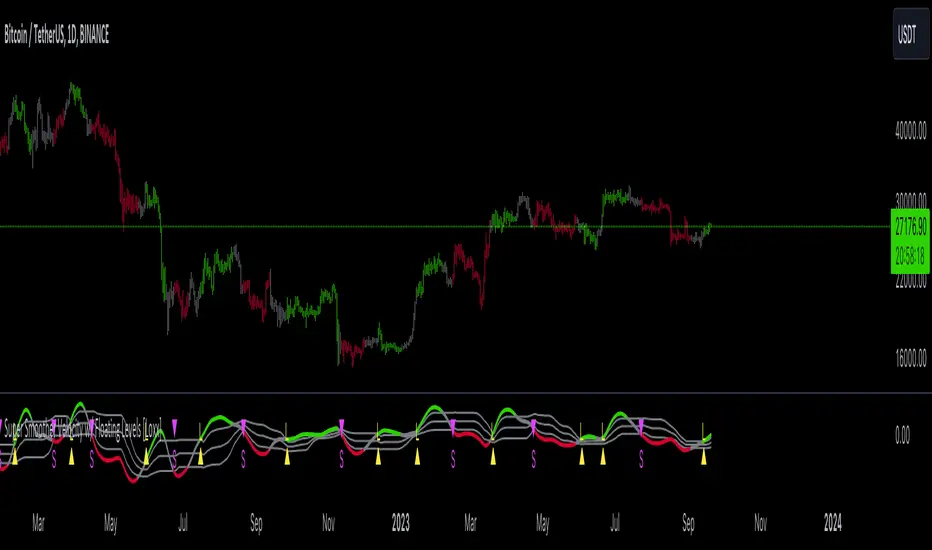
Momentum ChannelbandsThe "Momentum Channelbands" is indicator that measures and displays an asset's momentum. It includes options to calculate Bollinger Bands and Donchian Channels around the momentum. Users can customize settings for a comprehensive view of momentum-related insights. This tool helps assess trend strength, identify overbought/oversold conditions, and pinpoint highs/lows. It should be used alongside other indicators due to potential lag and false signals.

Zaree - Bull & Bear Volume VoidThe "Zaree - Bull & Bear Volume Void" (BBVV) indicator is a versatile tool designed to help traders assess the dynamics of bull and bear power in the market, with a focus on volume-based analysis. This indicator offers a range of features that aid in identifying potential shifts in market sentiment and strength.
Details of the Indicator:
Volume Void Color Settings: This indicator allows you to customize the colors used for different conditions, such as strong bull areas, slowing bull areas, strong bear areas, and slowing bear areas. These colors play a crucial role in visualizing the indicator's output.
Volume Void Settings: The BBVV indicator provides options for selecting specific volume void functions, which include "Relative Volume Comparison," "Percentage of Average Volume," "Fixed Volume Threshold," "Volatility-Adjusted Volume," "Compare to Previous Volume Bars," "Volume Percentile Rank," and "Market Session Comparison." Each function has its own criteria for evaluating volume conditions.
Void Bull Sensitivity and Void Bear Sensitivity: These are key parameters in the settings. The values you choose for void bull sensitivity and void bear sensitivity will significantly impact the background color displayed by the indicator. Properly configuring these values is crucial for the indicator's effectiveness.
Moving Average Settings: You can specify the source and length of moving averages used in the indicator. This helps in smoothing out data and providing a clearer picture of bull and bear power.
Void Color Background Conditions: The indicator dynamically changes the background color of the chart based on the current market conditions. It takes into account bull and bear power, as well as the configured sensitivity levels to determine whether the market is in a strong or slowing bull/bear phase.
MACD and Signal Lines: The indicator also displays MACD and signal lines on the chart, helping traders identify potential bullish and bearish crossovers.
Histogram Bars: Histogram bars are used to represent the strength of bull and bear power. Above-zero bars indicate bullish strength, while below-zero bars indicate bearish strength.
How to Use the Indicator:
Begin by customizing the color settings for different market conditions to your preference.
Select a volume void function that aligns with your trading strategy and objectives.
Configure the void bull sensitivity and void bear sensitivity values carefully. These values should reflect your desired sensitivity to volume conditions.
Choose the source and length of moving averages based on your analysis requirements.
Pay attention to the background color of the chart. It will change dynamically based on the current market conditions, providing insights into the strength of bull and bear power.
Observe the MACD and signal lines for potential bullish or bearish crossovers, which can be used as additional confirmation signals.
Interpret the histogram bars to gauge the strength of bull and bear power.
Example of Usage:
As a swing trader with a focus on volume analysis, you can use the BBVV indicator to enhance your trading decisions. Here's an example of how you might use the indicator:
Select "Relative Volume Comparison" as the volume void function to assess volume relative to a simple moving average.
Configure void bull sensitivity and void bear sensitivity to match your risk tolerance and trading style.
Choose "SMA" as the moving average type with a suitable length.
Pay attention to the background color changes in the chart. Strong bull areas may indicate potential bullish opportunities, while strong bear areas may signal bearish conditions.
Monitor the MACD and signal lines for potential crossovers, aligning them with the background color to validate your trading decisions.
Use the histogram bars to assess the strength of bull and bear power, helping you gauge market sentiment.
Remember that the BBVV indicator is a valuable tool to complement your trading strategy. It provides insights into volume dynamics and market conditions, allowing you to make informed trading choices.
Be sure to adjust the indicator settings according to your trading preferences and always consider the broader market context in your analysis.

Opportunity_SniperThis script is based on divergence situation related to momentum and price.
For this we have 4 strategies divergence calculation :
So user can choose which strategy will be applied on chart from input. one of them or all of them.
Also user can activate swing High ang swing Low be shown on chart.
Below explanation of strategy what is doing :
Strategy 1 or Strategy 2 script tracks the price and compares it with momentum indicators to detect positif and negative divergnce
While strategy 3, script monitors the momentum and compares it with the price to detect positif and negative divergnce
Finally strategy 4, script monitors the momentum and compares it with the volume to detect positif and negative divergnce
How to use or benefit from script:
For Long position :
Depending on whiche strategy you will choose, when the Div Buy stgx signal appears, this means the appearance of Divergence, which leads to the beginning of bull Buy Momentum.
Wait for the conf Buy signal to appear and confirm your long entry and put your Stop Loss below the last swing low candle
For short position :
Depending on whiche strategy you will choose, When the Div Sell stgx signal appears, this means that Divergence has appeared, which leads to the start of Bearish Sell Momentum.
Wait for the conf Sell signal to appear and confirm your short entry and put your Stop Loss above the last swing high candle
Disclaimer
The content within my Scripts, Indicators, Ideas, Algorithms, and Systems is not intended as financial advice or an invitation to trade or invest in any securities.
I disclaim liability for any losses or damages, including loss of profit, arising directly or indirectly from reliance on the information provided.
All investments entail risks, and past performance of securities, industries, sectors, markets,
financial products, trading strategies, backtests, or individual trading does not guarantee future outcomes or returns.
Traders bear full responsibility for their investment choices, predicated on their financial circumstances, objectives, risk tolerance, and liquidity requirements.
My Scripts, Indicators, Ideas, Algorithms, and Systems are purely for educational purposes!

Composite Momentum IndicatorComposite Momentum Indicator" combines the signals from several oscillators, including Stochastic, RSI, Ultimate Oscillator, and Commodity Channel Index (CCI) by averaging the standardized values (Z-Scores). Since it is a Z-Score based indicators the values will be typically be bound between +3 and -3 oscillating around 0. Here's a summary of the code:
Input Parameters: Users can customize the look-back period and set threshold values for overbought and oversold conditions. They can also choose which oscillators to include in the composite calculation.
Oscillator Calculations: The code calculates four separate oscillators - Stochastic, RSI, Ultimate Oscillator, and CCI - each measuring different aspects of market momentum.
Z-Scores Calculation: For each oscillator, the code calculates a Z-Score, which normalizes the oscillator's values based on its historical standard deviation and mean. This allows for a consistent comparison of oscillator values across different timeframes.
Composite Z-Score: The code aggregates the Z-Scores from the selected oscillators, taking into account user preferences (whether to include each oscillator). It then calculates an average Z-Score to create the "Composite Momentum Oscillator."
Conditional Color Coding: The composite oscillator is color-coded based on its average Z-Score value. It turns green when it's above the overbought threshold, red when it's below the oversold threshold, and blue when it's within the specified range.
Horizontal Lines: The code plots horizontal lines at key levels, including 0, ±3, ±2, and ±1, to help users identify important momentum levels.
Gradient Fills: It adds gradient fills above the overbought threshold and below the oversold threshold to visually highlight extreme momentum conditions.
Combining the Stochastic, RSI, Ultimate Oscillator, and Commodity Channel Index (CCI) into one composite indicator offers several advantages for traders and technical analysts:
Comprehensive Insight: Each of these oscillators measures different aspects of market momentum and price action. Combining them into one indicator provides a more comprehensive view of the market's behavior, as it takes into account various dimensions of momentum simultaneously.
Reduced Noise: Standalone oscillators can generate conflicting signals and produce noisy readings, especially during choppy market conditions. A composite indicator smoothes out these discrepancies by averaging the signals from multiple indicators, potentially reducing false signals.
Confirmation and Divergence: By combining multiple oscillators, traders can seek confirmation or divergence signals. When multiple oscillators align in the same direction, it can strengthen a trading signal. Conversely, divergence between the oscillators can warn of potential reversals or weakening trends.
Customization: Traders can tailor the composite indicator to their specific trading strategies and preferences. They have the flexibility to include or exclude specific oscillators, adjust look-back periods, and set threshold levels. This adaptability allows for a more personalized approach to technical analysis.
Clarity and Efficiency: Rather than cluttering the chart with multiple individual oscillators, a composite indicator condenses the information into a single plot. This enhances the clarity of the chart and makes it easier for traders to quickly interpret market conditions.
Overbought/Oversold Identification: Combining these oscillators can improve the identification of overbought and oversold conditions. It reduces the likelihood of false signals since multiple indicators must align to trigger these extreme conditions.
Educational Tool: For novice traders and analysts, a composite indicator can serve as an educational tool by demonstrating how different oscillators interact and influence each other's signals. It allows users to learn about multiple technical indicators in one glance.
Efficient Use of Screen Space: A single composite indicator occupies less screen space compared to multiple separate indicators. This is especially beneficial when analyzing multiple markets or timeframes simultaneously.
Holistic Approach: Instead of relying on a single indicator, a composite approach encourages a more holistic assessment of market conditions. Traders can consider a broader range of factors before making trading decisions.
Increased Confidence: A composite indicator can boost traders' confidence in their decisions. When multiple reliable indicators align, it can provide a stronger basis for taking action in the market.
In summary, combining the Stochastic, RSI, Ultimate Oscillator, and CCI into one composite indicator enhances the depth and reliability of technical analysis. It simplifies the decision-making process, reduces noise, and offers a more complete picture of market momentum, ultimately helping traders make more informed and well-rounded trading decisions.
* Feel free to compare against individual oscillatiors*

Coppock Curve w/ Early Turns [QuantVue]The Coppock Curve is a momentum oscillator developed by Edwin Coppock in 1962. The curve is calculated using a combination of the rate of change (ROC) for two distinct periods, which are then subjected to a weighted moving average (WMA).
History of the Coppock Curve:
The Coppock Curve was originally designed for use on a monthly time frame to identify buying opportunities in stock market indices, primarily after significant declines or bear markets.
Historically, the monthly time frame has been the most popular for the Coppock Curve, especially for long-term trend analysis and spotting the beginnings of potential bull markets after bearish periods.
The signal wasn't initially designed for finding sell signals, however it can be used to look for tops as well.
When the indicator is above zero it indicates a hold. When the indicator drops below zero it indicates a sell, and when the indicator moves above zero it signals a buy.
While this indicator was originally designed to be used on monthly charts of the indices, many traders now use this on individual equities and etfs on all different time frames.
About this Indicator:
The Coppock Curve is plotted with colors changing based on its position relative to the zero line. When above zero, it's green, and when below, it's red. (default settings)
An absolute zero line is also plotted in black to serve as a reference.
In addition to the classic Coppock Curve, this indicator looks to identify "early turns" or potential reversals of the Coppock Curve rather than waiting for the indicator to cross above or below the zero line.
Give this indicator a BOOST and COMMENT your thoughts!
We hope you enjoy.
Cheers!

Velocity Acceleration Indicator [CC]The Velocity Acceleration Indicator was created by Scott Cong (Stocks and Commodities Sep 2023, pgs 8-15). This is another personal variation of his formula designed to capture the overall velocity acceleration of the underlying stock by applying the velocity formula to the original indicator to find the acceleration of the underlying velocity. I changed a few things around and managed actually to get less lag and quicker signals for this version, so make sure you compare the Velocity Indicator script that I published yesterday. This indicator is also visually similar to a typical stochastic indicator but uses a different underlying calculation. This works well as a momentum indicator, and the values are completely unbounded, so the best ways to determine bullish or bearish trends is either by using a crossover or crossunder between the indicator and the midline or to buy or sell the indicator when it reaches a high or low point and starts to fall or rise respectively. I used the zero line for my default version to help determine the bullish or bearish trends. I have also included multiple colors to differentiate between very strong signals and normal signals, so very strong signals are darker in color, and normal signals use lighter colors. Buy when the line turns green and sell when it turns red.
Let me know if there are any other indicators or scripts you would like to see me publish! I will have some more new scripts in the next week or so.

TEWY - Magic Momentum IndicatorMy goal is to equip every trader and investor with the essential tools necessary to confidently navigate the complexities of the financial markets, enabling them to consistently identify opportunities and maintain a position of strength on the winning side of their trades. This indicator stands as a potent tool, offering the capability to effectively assess longer-term momentum trends.
Allow me to provide some context regarding the genesis of this indicator. By keenly observing the pattern of momentum loss preceding each trend reversal, coupled with the notable decrease in the rate of price change, I've formulated this indicator. This design is rooted in the understanding that these dynamics hold key insights into the market's shifting trends.
So, I've developed this indicator with the purpose of granting you the ability to select and construct optional combinations of up to two comparable symbols. Through this, you gain a comprehensive and insightful perspective on the ever-evolving dynamics of the market.
This indicator acts like an oscillator and momentum line serves as a key determinant. When the line is positioned above 0, it signifies a positive momentum; conversely, if it rests below 0, it indicates a sideways to negative trend. This mechanism offers a clear and intuitive means of gauging prevailing market conditions.
Should you have any inquiries or require further clarification regarding this indicator, please do not hesitate to reach out to me via direct message. I am here to provide you with the necessary guidance and support to ensure your experience with this tool is both seamless and enriching. Your understanding and satisfaction remain my utmost priority.
By TEWY - Trade Easy With Yogesh
I am Yogesh

Velocity Indicator [CC]The Velocity Indicator was created by Scott Cong (Stocks and Commodities Sep 2023, pgs 8-15). This is my variation of his formula designed to capture the overall velocity of the underlying stock by applying the typical velocity formula. This indicator is visually similar to a typical stochastic indicator but uses a different underlying calculation. This works well as a momentum indicator, and the values are completely unbounded, so the best ways to determine bullish or bearish trends is either by using a crossover or crossunder between the indicator and the midline or to buy or sell the indicator when it reaches a high or low point and starts to fall or rise respectively. For my default version, I used the zero line to help determine the bullish or bearish trends. I have also included multiple colors to differentiate between very strong signals and normal signals, so very strong signals are darker in color, and normal signals use lighter colors. Buy when the line turns green and sell when it turns red.
Let me know if there are any other indicators or scripts you would like to see me publish! I will have some more new scripts in the next week or so.

Trig-Log Scaled Momentum OscillatorTaylor Series Approximations for Trigonometry:
1. The indicator starts by calculating sine and cosine values of the close price using Taylor Series approximations. These approximations use polynomial terms to estimate the values of these trigonometric functions.
Mathematical Component Formation:
2. The calculated sine and cosine values are then multiplied together. This gives us the primary mathematical component, termed as the 'trigComponent'.
Smoothing Process:
3. To ensure that our indicator is less susceptible to market noise and more reactive to genuine price movements, this 'trigComponent' undergoes a smoothing process using a simple moving average (SMA). The length of this SMA is defined by the user.
Logarithmic Transformation:
4. With our smoothed value, we apply a natural logarithm approximation. Again, this approximation is based on the Taylor expansion. This step ensures that all resultant values are positive and offers a different scale to interpret the smoothed component.
Dynamic Scaling:
5. To make our indicator more readable and comparable over different periods, the logarithmically transformed values are scaled between a range. This range is determined by the highest and lowest values of the transformed component over the user-defined 'lookback' period.
ROC (Rate of Change) Direction:
6. The direction of change in our scaled value is determined. This offers a quick insight into whether our mathematical component is increasing or decreasing compared to the previous value.
Visualization:
7. Finally, the indicator plots the dynamically scaled and smoothed mathematical component on the chart. The color of the plotted line depends on its direction (increasing or decreasing) and its boundary values.

TaLib RSI (ta-lib uses SMA)If you've ever been confused because Ta-Lib RSI differs from TradingView's RSI...
Look no further than here which instead of using the Rolling Moving Average, will instead use the Simple Moving Average
