TDZZ ETH 15min Vault: No-Loss Martin Gale StrategyStrategy Overview
The ETH 15min Vault is an enhanced, high-frequency Martin Gale strategy designed specifically for Ethereum on the 15-minute chart. Its core innovation lies in integrating pre-calculated margin management with a multi-layer exit system, transforming the traditional high-risk Martingale approach into a controlled, calculated growth engine. The strategy aims for sustainable compound growth of small capitals (e.g., 1000U) in ranging markets while systematically eliminating the risk of account blow-up.
Core Concept: The "No-Loss" Guarantee
Unlike conventional Martingale systems that risk infinite losses, this strategy pre-calculates and logically reserves the total margin required for all potential layers (configurable, e.g., up to 30) at the initial entry. This ensures sufficient capital is always available for the next averaging order, preventing liquidation due to margin shortage. Combined with intelligent, proactive take-profit and safety-net closures, it creates a theoretically "No-Loss" framework for the Martin Gale method.
Key Mechanisms
1、Smart Position Averaging:
Averaging distances expand geometrically (configurable multiplier), preventing rapid layer depletion during sharp drops.
Averaging order size increases progressively (configurable multiplier) to effectively lower the break-even point.
2、Dynamic Multi-Stage Exit Logic:
Rebound TP: Partially closes a position when price rebounds a certain percentage from its entry, locking in profits early during oscillations.
Cycle TP: Closes the remaining position upon reaching the primary profit target, which is dynamically recalculated after each average to reflect the new aggregate cost.
Safety-Net Close (Defense Mode): Activates after a defined number of averages. Triggers a full exit if price: a) rallies significantly from the lowest point, b) retraces from a recent high, or c) fails to make a new low within a set time. This forms the final protective layer for capital preservation.
Main Advantages
✅ True Risk Isolation: Transforms Martingale's "unlimited risk" into a "defined and manageable drawdown" via pre-calculated margins and safety-net exits.
✅ Active Profit Capture: The "Rebound TP" mechanism increases win rate and capital efficiency in ranging markets.
✅ Adaptive to Volatility: Adjustable parameters for averaging distance and size allow tuning for different market conditions.
✅ High-Frequency Compounding Potential: Operates on the 15-min timeframe, offering numerous opportunities to complete profit cycles in consolidating phases.
Configuration & Parameters
Key adjustable inputs include: Initial Capital %, Averaging Distance % and Multiplier, Order Size Multiplier, Max Layers, Take-Profit %, Rebound Close %, and all Defense Mode thresholds.
This strategy significantly reduces liquidation risk through its design but does not eliminate trading risk. Substantial drawdowns can occur during strong, sustained trends. "No-Loss" refers to prevention of margin-call liquidation, not guaranteed profitability. Always conduct thorough backtesting and forward testing in a simulated environment before committing real capital. Past performance is not indicative of future results. Trade responsibly.
Martingale

MirrorPip ST Rolling Reversal This Strategy is a mean reversal strategy that focus on high gamma scripts.
You can set a condition for a X% move in Y candles and when that conditon is met, it will wait for supertrend to reverse.
For aggressive traders we have also added Martingale feature in it.
+ martingale is arithmatic martingale
* martingale is geometric martingale.
we have also added options mode, just incase you wish to trade in options as both buyer and seller.
The option mode also gives you flexibility to be a choose dynamic ATM/ITM/OTM strikes.
0 = ATM
LESS THAN 0 = ITM
GREATER THAN 0 = OTM
Additonal advanced settings :
We have added an optional reference supertrend, where you can refer to other script and its supertrend direction as dual confirmation.
you can even set the reference chart with other time frame than of current chart.
Also while firing order, you can fire orders in LOTS/DOLLARS.
There is a smart dashboard that helps you see the live P/L as well.

martingle trading bot⚙️ Martingle Trading Bot — Complete Description
The Martingle Trading Bot is a fully automated volatility-band visualization system that demonstrates the principles of breakout-based market logic combined with martingale-style position scaling. It is designed purely for educational, analytical, and backtesting visualization purposes on TradingView.
This tool shows how a simple mathematical band system can be used to define intraday breakout regions, evaluate sequential trade logic, and visualize how martingale-style compounding affects a trade sequence when price fluctuates around daily reference levels.
🧠 Conceptual Overview
The system works on a simple yet powerful market observation: markets oscillate within short-term ranges and occasionally break out beyond expected volatility envelopes. To capture and visualize these events, the Martingle Trading Bot uses a daily reset mechanism that defines a reference price, builds trading bands around it, and triggers theoretical buy/sell signals when price exceeds certain thresholds.
📅 1️⃣ Daily Reference Price (Central Core)
Every trading day begins with a reference price — typically the daily open. This reference acts as the neutral center for the system’s calculations. The indicator resets this reference daily and adjusts when target zones are hit, maintaining realistic adaptive logic.
📊 2️⃣ Dynamic Bands and Target Zones
From the reference price, the indicator constructs two key structures:
- Primary Band Range – defines the immediate trading zone using the “band range.”
- Target Band Range – extends beyond the primary band to define logical take-profit zones.
Price action beyond these regions indicates directional expansion and potential breakout strength.
📈 3️⃣ Breakout Logic (Trade Signal Simulation)
- When price crosses the upper band → bullish breakout condition.
- When price crosses the lower band → bearish breakout condition.
Each breakout is visualized on the chart and represents a theoretical position change.
🧮 4️⃣ Martingale Position Scaling
When a breakout occurs against the prior position, the system multiplies or increments position size based on user-defined settings. This models martingale-style compounding and resets when a target is reached. It helps illustrate how scaling affects drawdown and recovery potential.
💹 5️⃣ Virtual PnL Tracking
The indicator keeps virtual stats of profit/loss, win rate, and trade count. These metrics are illustrative only — no live or guaranteed results are implied.
🧭 6️⃣ Visual Chart Elements
Buy/Sell labels, take-profit labels, quantities, and color-coded zones appear on the chart to clearly display trade logic and band structure.
⚙️ 7️⃣ User Inputs
- Band Range
- Target Distance
- Initial Quantity
- Martingle Quantity
- Gap Detection Point
- Label Display Toggles
- Optional end-of-day reset
🧩 8️⃣ Use Cases
Ideal for traders, developers, and educators who want to study breakout systems, risk progression, and position scaling.
⚠️ 9️⃣ Risk Disclosure
This is not a live trading bot. It does not execute trades or guarantee profit. Martingale logic carries significant risk — consecutive losses can exponentially increase exposure. Use for study purposes only.
📜 License and Credits
Developed by @algo_coders.
Licensed under the Mozilla Public License 2.0 (MPL 2.0).
Uses internal bar-counting functions for session management.
🧠 Summary
The Martingle Trading Bot combines volatility envelopes, daily resets, and martingale scaling to visualize compounding risk behavior. It is an educational research tool for understanding probability-based trading concepts — not financial advice or a trading signal provider.

Advanced Grid Trading System - [WOLONG X DBG]Overview
This sophisticated grid trading system combines Bollinger Bands breakout analysis with RSI filtering to create a comprehensive automated trading approach. The system implements advanced grid management with dynamic lot sizing, intelligent ATR-based spacing, and comprehensive risk management features including drawdown protection, time-based trading controls, and multi-level position management.
Methodology
The indicator employs a multi-layered analytical approach based on established technical analysis principles:
Core Signal Generation
Bollinger Bands Breakout Engine: Utilizes customizable period Bollinger Bands (default 35) with highest/lowest price detection over the calculation period to identify potential reversal points when price breaks below recent lows or above recent highs
RSI Confirmation Filter: Implements RSI-based signal filtering with customizable maximum RSI values to avoid entries during overbought/oversold conditions, requiring RSI below (50 - max_rsi_value) for buy signals and above (50 + max_rsi_value) for sell signals
Grid Management System: Advanced progressive grid system with configurable pip-based spacing, intelligent ATR-based distance calculation, and cumulative lot sizing with customizable multipliers
Advanced Features
Dynamic Lot Sizing: Eight calculation methods including Fixed Lot, Dynamic by Balance/Equity, and risk-based percentage approaches (Low Risk 20%, Medium Risk 40%, High Risk 80%, Extreme Risk 120%, Margin Loading)
Comprehensive Risk Management: Multi-layered drawdown protection with percentage and absolute value limits, automatic position closure options, and trading suspension features with time-based recovery
Time-Based Controls: Configurable GMT-based trading hours with start/stop times for session-specific trading and market condition adaptation
Key Components
Signal Types
Primary Entry Signals: Buy signals when price breaks below recent lowest values within Bollinger period with RSI confirmation; Sell signals when price breaks above recent highest values with RSI confirmation
Grid Expansion Logic: Automatic additional entries based on configurable pip distances from base price, triggered when price moves against initial position by specified intervals
Take Profit Systems: Dual-mode TP calculation using either weighted average across all positions or individual level TP with customizable pip values
Stop Loss Protection: Grid-wide SL with customizable pip distances or default 1000-pip protection
Visual Elements
Bollinger Bands Display: Three-line Bollinger Bands system with upper, middle (SMA), and lower bands for trend and volatility analysis
Grid Base Line: Yellow dashed line showing initial grid entry level with right extension for reference
Comprehensive TP/SL Lines: Dual-line system showing both first order reference levels (dotted, light colors) and official Martingale weighted average levels (solid, bold colors)
Entry Point Labels: Detailed entry markers showing BUY/SELL direction, grid level, and lot size information
Dual Dashboard System: Main control panel (top-right) and dark theme entry log (bottom-right) with real-time status updates
Usage Instructions
Basic Configuration
Capital Management: Select lot calculation method from dropdown (recommended: "Low Risk 20%" for conservative approach)
Grid Parameters: Configure trading distance (default 35 pips) and enable smart distance for ATR-based dynamic adjustments
Strategy Settings: Set Bollinger period (35), RSI period (20), and maximum RSI value (15) for signal filtering
Risk Controls: Configure maximum drawdown percentage and action when limits are exceeded
Signal Interpretation
Buy Entry Conditions: Generated when current close price breaks below the lowest price in the Bollinger calculation period, with RSI below (50 - max_rsi_value)
Sell Entry Conditions: Generated when current close price breaks above the highest price in the Bollinger calculation period, with RSI above (50 + max_rsi_value)
Grid Expansion: Automatic additional entries when price moves against position by configured pip distances, with progressive lot sizing using multipliers
Exit Conditions: Weighted average TP achievement, breakeven after specified grid levels, or manual cycle completion
Dashboard Analysis
Main Control Panel: Displays current grid level, trading direction, open orders count, total volume, next lot size, grid P&L, current balance, floating drawdown, RSI status, trading hours, and system locks
Dark Theme Entry Log: Shows recent entry history with timestamps, entry types (BUY/SELL), prices, lot sizes, and grid levels for trade tracking
Risk Monitoring: Real-time drawdown tracking with color-coded warnings and automatic protection activation
Risk Management Features
Automatic Protections
Drawdown Limits: Configurable percentage (default 100%) and absolute USD drawdown limits with four response options: Close Orders and Stop 24h/Until Restart, or Prevent New Grid/Until Restart
Position Sizing: Eight dynamic lot calculation methods based on account equity, balance, or risk tolerance with maximum lot size limits
Grid Limitations: Maximum number of grid levels (default 9) to prevent excessive exposure accumulation
Time Controls: GMT-based trading hour restrictions to avoid high-volatility periods or specific market sessions
Confirmation Requirements
Multi-Indicator Alignment: Requires both Bollinger Bands breakout and RSI confirmation before signal generation
Intelligent Spacing: ATR-based grid spacing adjustment using short-term (96-period) vs long-term (672-period) ATR ratio for market volatility adaptation
Progressive Sizing: Configurable lot multipliers for different grid levels (Order 2: 1.0x, Orders 3-5: 2.0x, Orders 6+: 1.5x default)
Optimal Settings
Timeframe Recommendations
Scalping: 1M-5M charts with reduced grid spacing (20-25 pips) and tighter RSI filters
Day Trading: 15M-1H charts with standard settings (35 pips) and default RSI parameters
Swing Trading: 4H-Daily charts with increased spacing (50+ pips) and relaxed RSI filters
Market Conditions
Trending Markets: Reduce RSI maximum value to 10-12, increase grid spacing to 40-50 pips, enable breakeven functionality
Ranging Markets: Standard settings with weighted TP enabled and moderate grid spacing
High Volatility: Enable smart distance, reduce maximum grid levels to 6-7, increase drawdown limits
Advanced Features
Customization Options
Lot Calculation Methods: Eight different approaches from fixed lot (0.01) to risk-based percentage calculations with margin loading options
Grid Multipliers: Separate multiplier settings for different grid levels (2nd order, 3rd-5th orders, 6th+ orders) with decimal precision
TP/SL Configuration: Individual or weighted average TP calculation with positive/negative pip values, breakeven after specified levels
Visual Controls: Toggle options for dashboard display, entry labels, TP/SL lines, lot information, and dark theme components
Technical Specifications
Grid Management: Up to 50 configurable grid levels with progressive lot sizing and cumulative position tracking
Risk Controls: Dual drawdown limits (percentage and absolute) with four different response actions and time-based recovery
Time Management: GMT-based trading hours with flexible start/end times supporting overnight sessions
Alert System: Five comprehensive alert conditions for new signals, drawdown warnings, maximum levels, and cycle completion
Important Limitations
Lagging Nature: Signals may appear after optimal entry points due to confirmation requirements and breakout validation
Grid Risk: Progressive lot sizing can lead to significant exposure accumulation during extended adverse price movements
Market Dependency: Performance varies significantly between trending and ranging market conditions, requiring parameter adjustments
Computational Load: Complex multi-array calculations and real-time dashboard updates may impact performance on slower devices
No Guarantee: All signals are suggestions based on technical analysis calculations and may be incorrect
Educational Disclaimers
This indicator is designed for educational and analytical purposes only. It represents a technical analysis tool based on mathematical calculations of historical price data and should not be considered as financial advice or trading recommendations.
Risk Warning: Grid trading involves substantial risk of loss and is not suitable for all investors. The progressive lot sizing methodology can lead to significant exposure accumulation during adverse market movements. Past performance of any trading system or methodology is not necessarily indicative of future results.
Important Notes:
Always conduct your own analysis before making trading decisions
Use appropriate position sizing and risk management strategies
Never risk more than you can afford to lose
Consider your investment objectives, experience level, and risk tolerance
Seek advice from qualified financial professionals when needed
Grid trading can result in multiple simultaneous positions with compounding risk exposure
Performance Disclaimer: Backtesting results do not guarantee future performance. Market conditions change constantly, and what worked in the past may not work in the future. The indicator's mathematical calculations are based on historical data patterns that may not repeat. Always paper trade new strategies before risking real capital.
System Limitations: The indicator relies on technical analysis principles and may produce false signals during unusual market conditions, news events, or periods of extreme volatility. Users should implement additional confirmation methods and maintain strict risk management protocols.

Martingale Strategy Simulator [BackQuant]Martingale Strategy Simulator
Purpose
This indicator lets you study how a martingale-style position sizing rule interacts with a simple long or short trading signal. It computes an equity curve from bar-to-bar returns, adapts position size after losing streaks, caps exposure at a user limit, and summarizes risk with portfolio metrics. An optional Monte Carlo module projects possible future equity paths from your realized daily returns.
What a martingale is
A martingale sizing rule increases stake after losses and resets after a win. In its classical form from gambling, you double the bet after each loss so that a single win recovers all prior losses plus one unit of profit. In markets there is no fixed “even-money” payout and returns are multiplicative, so an exact recovery guarantee does not exist. The core idea is unchanged:
Lose one leg → increase next position size
Lose again → increase again
Win → reset to the base size
The expectation of your strategy still depends on the signal’s edge. Sizing does not create positive expectancy on its own. A martingale raises variance and tail risk by concentrating more capital as a losing streak develops.
What it plots
Equity – simulated portfolio equity including compounding
Buy & Hold – equity from holding the chart symbol for context
Optional helpers – last trade outcome, current streak length, current allocation fraction
Optional diagnostics – daily portfolio return, rolling drawdown, metrics table
Optional Monte Carlo probability cone – p5, p16, p50, p84, p95 aggregate bands
Model assumptions
Bar-close execution with no slippage or commissions
Shorting allowed and frictionless
No margin interest, borrow fees, or position limits
No intrabar moves or gaps within a bar (returns are close-to-close)
Sizing applies to equity fraction only and is capped by your setting
All results are hypothetical and for education only.
How the simulator applies it
1) Directional signal
You pick a simple directional rule that produces +1 for long or −1 for short each bar. Options include 100 HMA slope, RSI above or below 50, EMA or SMA crosses, CCI and other oscillators, ATR move, BB basis, and more. The stance is evaluated bar by bar. When the stance flips, the current trade ends and the next one starts.
2) Sizing after losses and wins
Position size is a fraction of equity:
Initial allocation – the starting fraction, for example 0.15 means 15 percent of equity
Increase after loss – multiply the next allocation by your factor after a losing leg, for example 2.00 to double
Reset after win – return to the initial allocation
Max allocation cap – hard ceiling to prevent runaway growth
At a high level the size after k consecutive losses is
alloc(k) = min( cap , base × factor^k ) .
In practice the simulator changes size only when a leg ends and its PnL is known.
3) Equity update
Let r_t = close_t / close_{t-1} − 1 be the symbol’s bar return, d_{t−1} ∈ {+1, −1} the prior bar stance, and a_{t−1} the prior bar allocation fraction. The simulator compounds:
eq_t = eq_{t−1} × (1 + a_{t−1} × d_{t−1} × r_t) .
This is bar-based and avoids intrabar lookahead. Costs, slippage, and borrowing costs are not modeled.
Why traders experiment with martingale sizing
Mean-reversion contexts – if the signal often snaps back after a string of losses, adding size near the tail of a move can pull the average entry closer to the turn
Behavioral or microstructure edges – some rules have modest edge but frequent small whipsaws; size escalation may shorten time-to-recovery when the edge manifests
Exploration and stress testing – studying the relationship between streaks, caps, and drawdowns is instructive even if you do not deploy martingale sizing live
Why martingale is dangerous
Martingale concentrates capital when the strategy is performing worst. The main risks are structural, not cosmetic:
Loss streaks are inevitable – even with a 55 percent win rate you should expect multi-loss runs. The probability of at least one k-loss streak in N trades rises quickly with N.
Size explodes geometrically – with factor 2.0 and base 10 percent, the sequence is 10, 20, 40, 80, 100 (capped) after five losses. Without a strict cap, required size becomes infeasible.
No fixed payout – in gambling, one win at even odds resets PnL. In markets, there is no guaranteed bounce nor fixed profit multiple. Trends can extend and gaps can skip levels.
Correlation of losses – losses cluster in trends and in volatility bursts. A martingale tends to be largest just when volatility is highest.
Margin and liquidity constraints – leverage limits, margin calls, position limits, and widening spreads can force liquidation before a mean reversion occurs.
Fat tails and regime shifts – assumptions of independent, Gaussian returns can understate tail risk. Structural breaks can keep the signal wrong for much longer than expected.
The simulator exposes these dynamics in the equity curve, Max Drawdown, VaR and CVaR, and via Monte Carlo sketches of forward uncertainty.
Interpreting losing streaks with numbers
A rough intuition: if your per-trade win probability is p and loss probability is q=1−p , the chance of a specific run of k consecutive losses is q^k . Over many trades, the chance that at least one k-loss run occurs grows with the number of opportunities. As a sanity check:
If p=0.55 , then q=0.45 . A 6-loss run has probability q^6 ≈ 0.008 on any six-trade window. Across hundreds of trades, a 6 to 8-loss run is not rare.
If your size factor is 1.5 and your base is 10 percent, after 8 losses the requested size is 10% × 1.5^8 ≈ 25.6% . With factor 2.0 it would try to be 10% × 2^8 = 256% but your cap will stop it. The equity curve will still wear the compounded drawdown from the sequence that led to the cap.
This is why the cap setting is central. It does not remove tail risk, but it prevents the sizing rule from demanding impossible positions
Note: The p and q math is illustrative. In live data the win rate and distribution can drift over time, so real streaks can be longer or shorter than the simple q^k intuition suggests..
Using the simulator productively
Parameter studies
Start with conservative settings. Increase one element at a time and watch how the equity, Max Drawdown, and CVaR respond.
Initial allocation – lower base reduces volatility and drawdowns across the board
Increase factor – set modestly above 1.0 if you want the effect at all; doubling is aggressive
Max cap – the most important brake; many users keep it between 20 and 50 percent
Signal selection
Keep sizing fixed and rotate signals to see how streak patterns differ. Trend-following signals tend to produce long wrong-way streaks in choppy ranges. Mean-reversion signals do the opposite. Martingale sizing interacts very differently with each.
Diagnostics to watch
Use the built-in metrics to quantify risk:
Max Drawdown – worst peak-to-trough equity loss
Sharpe and Sortino – volatility and downside-adjusted return
VaR 95 percent and CVaR – tail risk measures from the realized distribution
Alpha and Beta – relationship to your chosen benchmark
If you would like to check out the original performance metrics script with multiple assets with a better explanation on all metrics please see
Monte Carlo exploration
When enabled, the forecast draws many synthetic paths from your realized daily returns:
Choose a horizon and a number of runs
Review the bands: p5 to p95 for a wide risk envelope; p16 to p84 for a narrower range; p50 as the median path
Use the table to read the expected return over the horizon and the tail outcomes
Remember it is a sketch based on your recent distribution, not a predictor
Concrete examples
Example A: Modest martingale
Base 10 percent, factor 1.25, cap 40 percent, RSI>50 signal. You will see small escalations on 2 to 4 loss runs and frequent resets. The equity curve usually remains smooth unless the signal enters a prolonged wrong-way regime. Max DD may rise moderately versus fixed sizing.
Example B: Aggressive martingale
Base 15 percent, factor 2.0, cap 60 percent, EMA cross signal. The curve can look stellar during favorable regimes, then a single extended streak pushes allocation to the cap, and a few more losses drive deep drawdown. CVaR and Max DD jump sharply. This is a textbook case of high tail risk.
Strengths
Bar-by-bar, transparent computation of equity from stance and size
Explicit handling of wins, losses, streaks, and caps
Portable signal inputs so you can A–B test ideas quickly
Risk diagnostics and forward uncertainty visualization in one place
Example, Rolling Max Drawdown
Limitations and important notes
Martingale sizing can escalate drawdowns rapidly. The cap limits position size but not the possibility of extended adverse runs.
No commissions, slippage, margin interest, borrow costs, or liquidity limits are modeled.
Signals are evaluated on closes. Real execution and fills will differ.
Monte Carlo assumes independent draws from your recent return distribution. Markets often have serial correlation, fat tails, and regime changes.
All results are hypothetical. Use this as an educational tool, not a production risk engine.
Practical tips
Prefer gentle factors such as 1.1 to 1.3. Doubling is usually excessive outside of toy examples.
Keep a strict cap. Many users cap between 20 and 40 percent of equity per leg.
Stress test with different start dates and subperiods. Long flat or trending regimes are where martingale weaknesses appear.
Compare to an anti-martingale (increase after wins, cut after losses) to understand the other side of the trade-off.
If you deploy sizing live, add external guardrails such as a daily loss cut, volatility filters, and a global max drawdown stop.
Settings recap
Backtest start date and initial capital
Initial allocation, increase-after-loss factor, max allocation cap
Signal source selector
Trading days per year and risk-free rate
Benchmark symbol for Alpha and Beta
UI toggles for equity, buy and hold, labels, metrics, PnL, and drawdown
Monte Carlo controls for enable, runs, horizon, and result table
Final thoughts
A martingale is not a free lunch. It is a way to tilt capital allocation toward losing streaks. If the signal has a real edge and mean reversion is common, careful and capped escalation can reduce time-to-recovery. If the signal lacks edge or regimes shift, the same rule can magnify losses at the worst possible moment. This simulator makes those trade-offs visible so you can calibrate parameters, understand tail risk, and decide whether the approach belongs anywhere in your research workflow.

JeropasMG v17This bot uses a martingale strategy applied to simple moving average crossover signals.
When a buy or sell signal is generated, it opens a position with the configured base size.
If the trade is a loser, the bot increases the size of the next entry by multiplying it by the defined factor (for example, x2), repeating the process until the maximum number of steps allowed is reached.

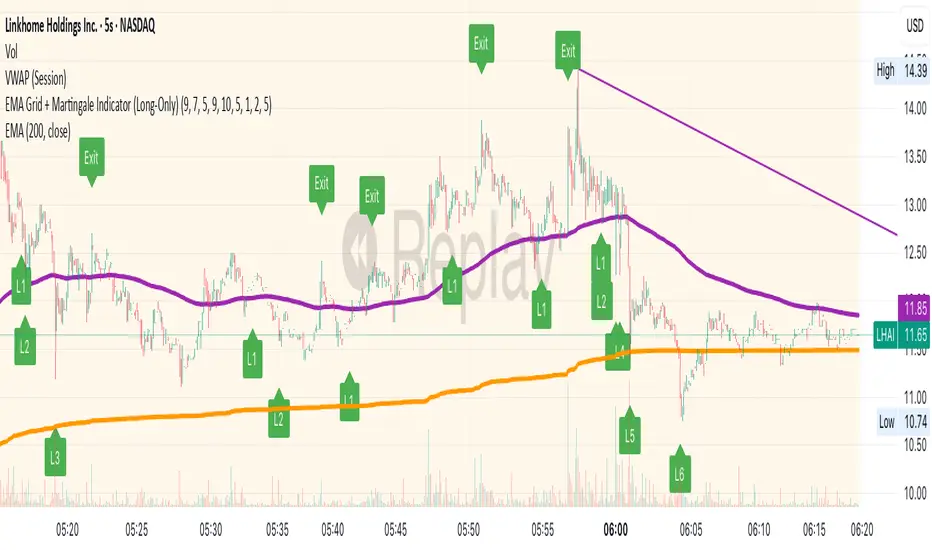
EMA Grid + Martingale Strategy (Long-Only) with CooldownTitle:
EMA Grid + Martingale Strategy (Long-Only) with Cooldown
Short Summary:
A long-only strategy combining EMA trend filters, grid-based entries, optional martingale sizing, and a cooldown feature to manage position timing and exits.
Full Description:
This strategy uses a 4-EMA trend confirmation system to detect bullish momentum, then deploys a grid-style entry method with optional martingale position sizing. It includes a cooldown mechanism to prevent reentry too soon after a completed trade cycle.
How It Works
1. Trend Confirmation: Two EMA groups (fast/slow) determine whether market conditions are bullish.
2. Initial Entry: A new position is entered when both EMA groups confirm an uptrend and no position is currently active.
3. Grid Entries: Additional long entries are placed when price drops by a defined pip distance from the last entry, respecting the maximum number of entries.
4. Martingale Sizing (Optional): Grid orders can increase in size with each level using a customizable multiplier.
5. Weighted-Average Exit: All positions close once price reaches or exceeds the average entry price plus a buffer.
6. Cooldown Timer: After closing a position set, the strategy waits a defined number of bars before opening a new grid.
Key Features
• 4 customizable EMAs for trend confirmation.
• Dynamic grid-style long entries based on pip intervals.
• Optional martingale-style position sizing.
• Weighted-average price exit logic with buffer control.
• Cooldown bar period to limit overtrading.
• Suitable for optimization and backtesting with full control over inputs.
Use Cases
• Designed for trending markets where pullbacks present entry opportunities.
• Helps manage staged entries while avoiding premature reentry.
• Ideal for testing martingale and grid-based strategies with exit precision.
Note: This strategy is for testing and educational purposes only. It does not guarantee profits and is not financial advice.

EMA Grid + Martingale Indicator (Long-Only)Title:
EMA Grid + Martingale Indicator (Long-Only)
Short Summary:
A 4-EMA trend filter combined with a grid-based entry system and optional martingale sizing to visualize staged long entries and exits in bullish markets.
Full Description:
This indicator combines a 4-EMA trend filter with a grid-based entry system and optional martingale-style position sizing to help traders visualize staged long entries and exits in trending markets.
How It Works
1. Trend Detection: Uses two sets of EMAs (fast/slow pairs) to confirm bullish momentum. A long signal is generated when both EMA groups align in an uptrend.
2. Grid Entries: After the initial long entry, additional grid levels are triggered every time price drops by the specified grid step (in pips).
3. Martingale Sizing (Optional): Each subsequent entry can increase in size based on the defined martingale factor.
4. Weighted-Average Exit: Calculates the weighted average of all grid entries and signals an exit when the price reaches or surpasses this level plus an optional buffer.
Key Features
• 4 EMA Trend Filter with fully customizable lengths.
• Dynamic grid entries with visual labels (L1, L2, etc.).
• Optional martingale position sizing.
• Weighted-average exit with adjustable buffer.
• Customizable parameters for EMAs, grid steps, max entries, and buffer pips.
• Clear chart visualization of EMAs and entry/exit levels.
Use Cases
• For traders using cost-averaging or grid strategies in bullish markets.
• Visualizes multiple entry levels and profit targets.
• Useful for backtesting and strategy planning.
Note: This indicator is for visualization and planning purposes only. It does not execute trades automatically. It does not guarantee profits and is not financial advice.
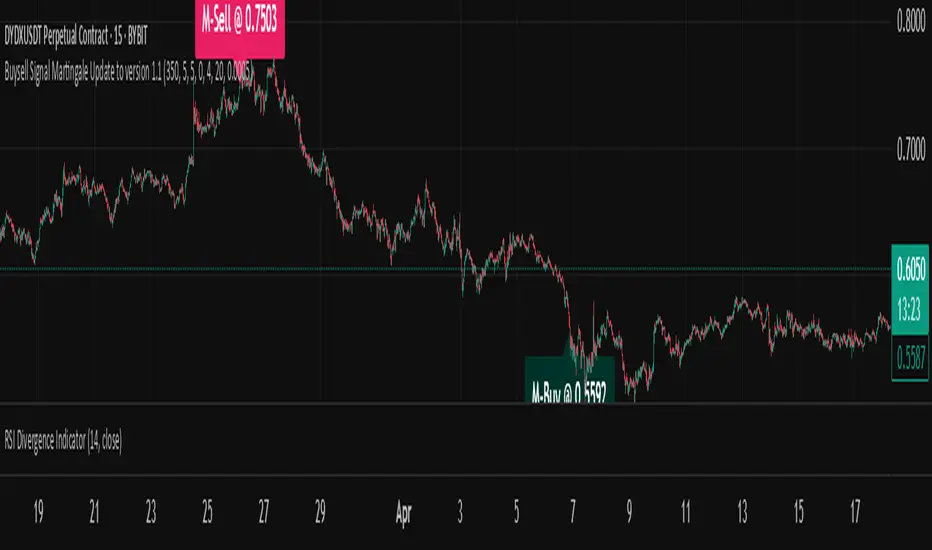
Buysell Martingale Signal - CustomBuysell Martingale Signal - Custom Indicator
Introduction:
This indicator provides a dynamic buy and sell signal system incorporating an adaptive Martingale logic. Built upon the signalLib_yashgode9/2 library, it is designed for use across various markets and timeframes.
Key Features:
Primary Buy & Sell Signals: Identifies initial buy and sell opportunities based on directional changes derived from the signalLib.
Martingale Signals:
For Short (Sell) Positions: A Martingale Sell signal is triggered when the price moves against the existing short position by a specified stepPercent from the last entry price, indicating a potential opportunity to average down or increase position size.
For Long (Buy) Positions: Similarly, a Martingale Buy signal is triggered when the price moves against the existing long position by a stepPercent from the last entry price.
On-Chart Labels: Displays clear, customizable labels on the chart for primary Buy, Sell, Martingale Buy, and Martingale Sell signals.
Customizable Colors: Allows users to set distinct colors for primary signals and Martingale signals for better visual distinction.
Adjustable Sensitivity: Features configurable parameters (DEPTH_ENGINE, DEVIATION_ENGINE, BACKSTEP_ENGINE) to fine-tune the sensitivity of the underlying signal generation.
Webhook Support (Static Message Alerts): This indicator provides alerts with static messages for both primary and Martingale buy/sell signals. These alerts can be leveraged for automation by external systems (such as trading bots or exchange-provided Webhook Signal Trading services).
Important Note: When using these alerts for automation, an external system is required to handle the complex Martingale logic and position management (e.g., tracking steps, PnL calculation, hedging, dynamic quantity sizing), as this indicator solely focuses on signal generation and sending predefined messages.
How to Use:
Add the indicator to your desired chart.
Adjust the input parameters in the indicator's settings to match your specific trading symbol and timeframe.
For automation, you can set up TradingView alerts for the Buy Signal (Main/Martingale) and Sell Signal (Main/Martingale) conditions, pointing them to your preferred Webhook URL.
Configurable Parameters:
DEPTH_ENGINE: (e.g., 30) Controls the depth of analysis for the signal algorithm.
DEVIATION_ENGINE: (e.g., 5) Defines the allowable deviation for signal generation.
BACKSTEP_ENGINE: (e.g., 5) Specifies the number of historical bars to look back.
Martingale Step Percent: (e.g., 0.5) The percentage price movement against the current position that triggers a Martingale signal.
Labels Transparency: Adjusts the transparency of the on-chart signal labels.
Buy-Color / Sell-Color: Sets the color for primary Buy and Sell signal labels.
Martingale Buy-Color / Martingale Sell-Color: Sets the color for Martingale Buy and Sell signal labels.
Label size: Controls the visual size of the labels.
Label Offset: Adjusts the vertical offset of the labels from the candlesticks.
Risk Warning:
Financial trading inherently carries significant risk. Martingale strategies are particularly high-risk and can lead to substantial losses or even complete liquidation of capital if the market moves strongly and persistently against your position. Always backtest thoroughly and practice with a demo account, fully understanding the associated risks, before engaging with real capital.
DCA Buy v1Key Features
1. Selective Entry Filters
Trend Filter
Enabled through "Enable Trend Filter?" using the "EMA Length" setting to ensure entries align with prevailing trends.
Momentum Filter
Configured using "Enable Momentum Filter?" combined with "RSI Length" and "RSI Source" to detect oversold conditions.
Bollinger Filter
Activated via "Enable Bollinger Filter?" along with "BB Length" and "BB Multiplier" to focus entries on deeper price dips below Bollinger Bands.
2. DCA Configuration
Base Order Settings
Choose between a percentage ("Base Order % of Equity/Initial Capital") or fixed value ("Base Order Value ($)").
Safety Order Settings
Fine-tune "Initial Deviation (%)" and "Price Deviation Multiplier" to control the spacing of safety orders.
Use "Volume Scaling Factor (Qty)" to scale the size of each subsequent safety order.
Customize the "First Safety Order Type" as either value-based or a multiplier of the base order using "1st Safety Order Value ($)" or "1st Safety Order Multiplier (Qty)".
Set the maximum number of safety orders through "Max Safety Orders".
3. Profit and Risk Management
Take Profit Settings
"Take Profit (%)" triggers a sell when a specific profit percentage above the average entry is reached.
Use "Trailing Take Profit (%)" to lock in profits while capturing additional upside if prices continue to rise.
Stop Loss Settings
Configure "Stop Loss (%)" to prevent excessive drawdowns by closing all positions when prices drop below a defined percentage.
4. Time Control & Visualization
Time Filters
Define trading windows with "Start Time" and "End Time".
Use "Cooldown (Seconds)" to avoid frequent entries during rapid price movements.
Visualization
Enable "Show Average Entry Price", "Show Take Profit Level", and "Show Stop Loss Level" to plot key levels on the chart for better monitoring.
5. Performance Metrics
Built-in performance tracking includes:
Net Profit (%): Measures overall profitability.
Win Rate (%): Displays the ratio of winning trades.
Max Drawdown (%): Tracks the largest equity decline.
Trading Days: Calculates the duration of active trades.
Profit/Day (%): Evaluates daily returns.
The performance table also shows average cycle duration and utilization of available capital.

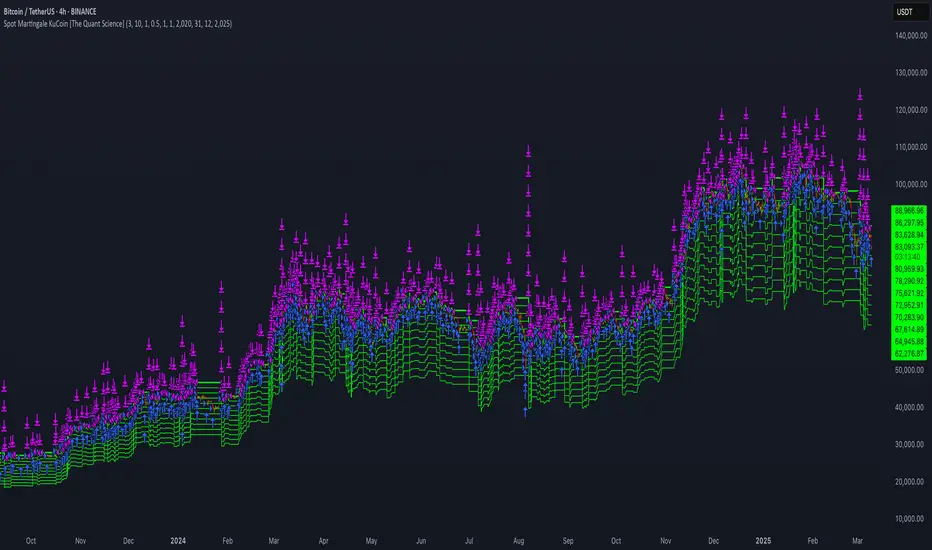
Spot Martingale KuCoin - The Quant ScienceINTRODUCTION
Backtesting software of the Spot Martingale algorithm offered by the KuCoin exchange.
This script replicates the logic used by the KuCoin bot and is useful for analyzing strategy on any cryptocurrency historical series.
It's not intended as an automatic trading algorithm and does not offer the possibility of automatic order execution.
The trader will use this software exclusively to research the best parameters with which to work on KuCoin.
LOGIC OF EXECUTION
The execution of orders is composed as follows:
1) Start Martingale: initial order
2) Martingale-Number: orders following Start Martingale
(A) The software is designed and developed to replicate trading without taking into account technical indicators or particular market conditions. The Initial Order (Start Martingale) will be executed immediately the close of the previous Martingale when the balance of market orders is zero. It will use the capital set in the Properties section for the initial order.
(B) After the first order, the software will open new orders as the price decreases. For orders following Start Martingale, the initial capital, multiplier, and number of orders in the exponential growth context are considered. The multiplier is the factor that determines the proportional increase in capital with each new order. The number of orders, indicates how many times the multiplier is applied to increase the investment.
Example
To find out the capital used in Martingale order number 5, with a Multiple For Position Increase equal to 2 and a starting capital of $100, the formula will be as follows:
Martingale Order = ($100 * (2 * 2 * 2 * 2 * 2)) = $100 * 32 = $3.200
(C) A multiplier is used for each new order that will increase the quantity purchased.
(D) All previously open orders are closed once the take profit is reached.
USER MANUAL
The user interface consists of two main sections:
1. Settings
Percentage Drop for Position Increase (0.1-15%) : percentage distance between Martingale orders. For example, if you set 5% each new order will be opened after a 5% price decrease from the previous one.
Max Position Increases (1-15) : number of Martingale orders to be executed after Start Martingale. For example, if you set 10, up to10 orders will be opened after Start Martingale.
Multiple For Position Increase (1-2x) : capital multiplier. For example, if you set 2 each for each new order, the capital involved will be doubled, order by order.
Take Profit Percentage (0.5-1000%) : percentage take profit, calculated on the average entry price.
2. Date Range Backtesting
The Date Range Backtesting section adjusts the analysis period. The user can easily adjust the UI parameters, and automatically the software will update the data.
LIMITATIONS OF THE MODEL
Although the Martingale model is widely used in position management, even this model has limitations and is subject to real risks during particular market conditions. Knowing these conditions will help you understand which asset is best to use the strategy on.
The main risks in adopting this automatic strategy are 2:
1) The price falls below our last order.
It happens during periods of strong bear-market in which the price collapses abruptly without experiencing any pullback. In this case the algorithm will enter a drawdown phase and the strategy will become a loser. The trader will then have to consider whether to wait for a price recovery or to incur a loss by manually closing the algorithm.
2) The price increases quickly.
It happens during periods of strong bull-market in which the price rises abruptly without experiencing any pullback. In this case the algorithm will not optimize order execution, working only with Start Martingale in the vast majority of trades. Given the exponential nature of the investment, the algorithm will in this case generate a profit that is always less than that of the reference market.
The best market conditions to use this strategy are characterized by high volatility such as correction phases during a bull run and/or markets that exhibit sideways price trends (such as areas of accumulation or congestion where price will generate many false signals).
FEATURES
This script was developed by including features to optimize the user experience.
Includes a dashboard at launch that allows the user to intuitively enter backtesting parameters.
Includes graphical indicator that helps the user analyze the behavior of the strategy.
Includes a date period backtesting feature that allows the user to adjust and choose custom historical periods.
DISCLAIMER
This script was released using parameters researched solely for the BTC/USDT pair, 4H timeframe, traded on the KuCoin Exchange (2017-present). Do not consider this combination of parameters as universal and usable on all assets and timeframes.
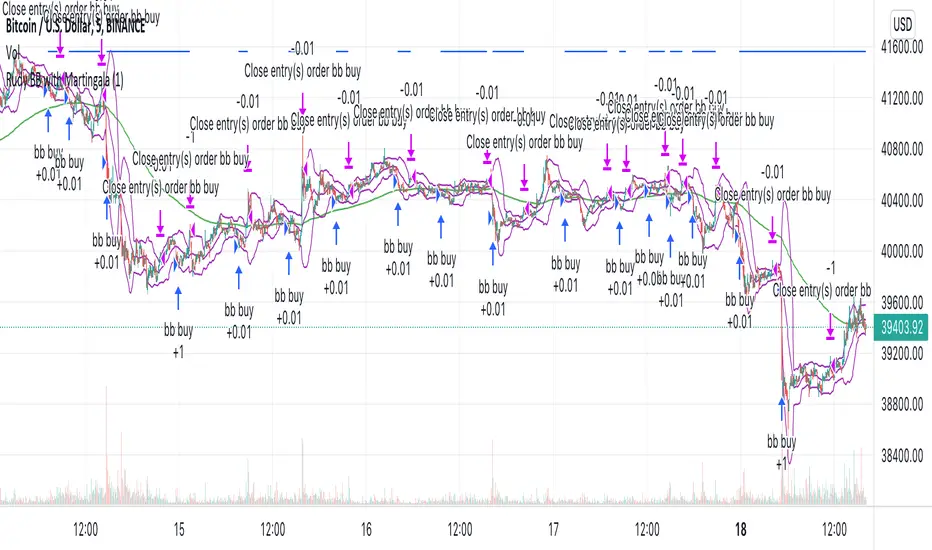
Rudy's BB with MartingaleMy first strategy script that uses Bollinger Bands and Martingale to increase contract size after negative profit.
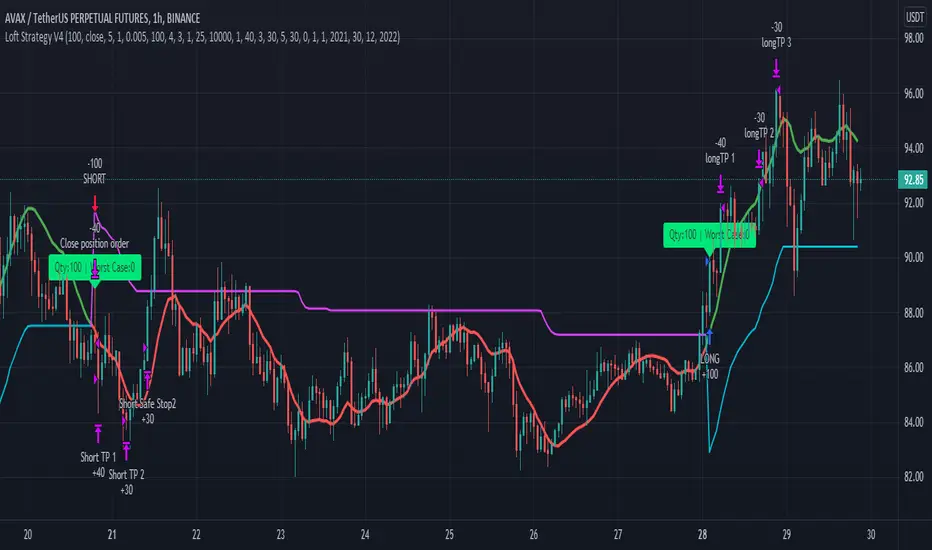
Loft Strategy V4This strategy is an advanced version of the Loft Strategy V1, I shared earlier. (Loft Strategy V1 consists of a kalman filter (by alexgrover ) and a "stop and reverse" line which is following and the kalman filter. If the price goes in the same direction as the position side, the "stop and reverse" line approaches the kalman filter as set on the "Approach Decrease Step" parameter.)
In addition to the previous version, it includes a martingale like deviation and multiple take-profit.
Here it is some parameters definitions of the strategy:
Kalman Filter: The higher this parameter, the faster and more aggressive the filter. Otherwise the filter goes very smoothly
Beginning Approach: First approximation as a percentage of stop-n-reverse line
Final Approach: Minimum approximation of stop-n-reverse line
Approach Decrease Step: If the price moves in the same direction as the strategy, the approach percentage is reduced by this parameter. Otherwise nothing do
Base Order Quantity: Initial capital of position
Max Safe Order Attempt: This parameter determines the maximum number of times the strategy will raise the bet after losing in a row.
Safe Order Deviation: if the last trade is loss, multiply the bet by this parameter (aka. martingale factor)
Profit Deviation: if last trade in loss, multiply the take-profit points
Max Order Quantity: Maximum capital allowed for a position
TP1, TP2, TP3 : Take profit spots in percentage
QT1, QT2, QT3: Amount of take-profit spots
Stop Loss: Maximum stop loss allowed for a trade
Long Entry, Short Entry: Only long side, only short side or both side
Safe Stop After TP2: If the price reaches the TP2 point, move the stop-loss point to the entry price.
Safe Stop After TP1: If the price reaches TP1, move the stop-loss point to the stop-n-reverse line.
Flip a CoinHave you ever wanted a strategy that is completely random? Well here's the Flip-a-Coin strategy that has entirely random and unpredictable trades! With the randomiser to make it a truly unique strategy to you, and the ability to add martingale logic to the risk means you could either be making millions or losing it all in no time! Please do not trade with this! At best it is a good baseline for testing if your own strategy is better or worse than literally flipping a coin. Enjoy!

QaSH DCA DaytraderThis script takes advantage of the power of DCA implemented in the QaSH DCA Algorithm script, and it applies it to new entry conditions. A "Quickfingers Luc" mode has been added, which creates new entry orders whenever a level of support has been identified. If price breaks the support level and quickly drops down, the orders will already be in place to catch the dip. This method can even catch the 1-second long, 50% flash dips that occur in some exchanges.
Four entry conditions are included in this initial release : ASAP, Quickfingers Luc, Bullish Pivot point, and Bearish Pivot point
All order placements are customizable
All take profit % values are based on the average entry price
Take profit % values can change based on how big the price dip was
Entry condition filter has been added and it uses a variable timeframe EMA
Stoploss function is available
Order size can be sent in the alerts, which allows for multiple setups to be running simultaneously in one account
All alerts are sent using the new "Any alert() function call" feature, which means this indicator will only take up one alert slot to cover all entry and exit alerts
Settings advice:
- If you think price is inflated, try conservative settings that either use a stoploss and EMA filter, or no stoploss but have some of your orders placed far below the current price with increasing volume. In a bear market this will beat the buy and hold.
- If you think the market is ready for a new bull run, then try experimenting with very aggressive settings to beat the buy and hold. For example: ASAP mode with 3 layers turned on. Orders placed at 0.5%, 3%, and 5%. Volumes at 30%, 30%, and 40% respectively. No stoploss. These settings were tested on ETH and beat the buy and hold during an extreme bull market period.

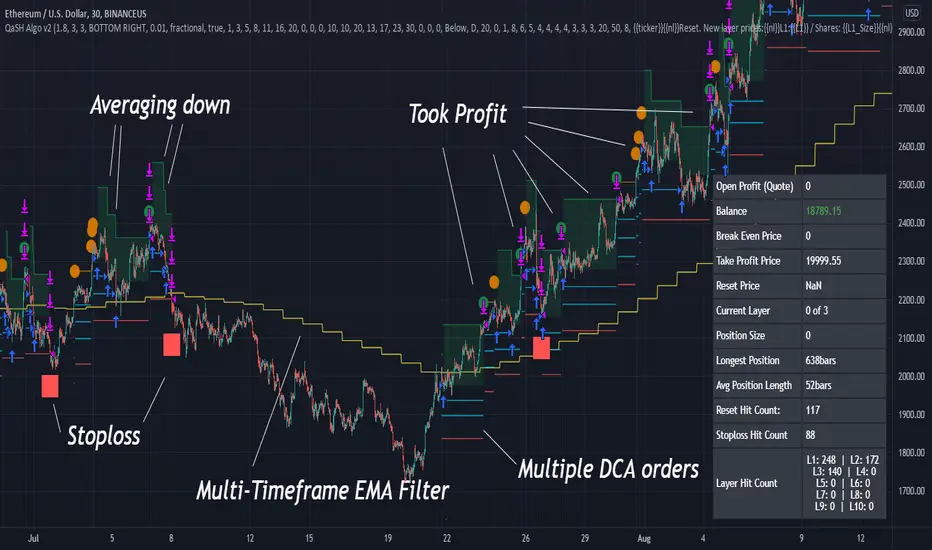
QaSH DCA Algorithm 2.0This is the strategy version of the QaSH DCA Algorithm indicator. This strategy version of the script includes live trading alert functionality, so it can be considered as a replacement that makes the indicator version obsolete. With this version, features have been added and also you can take advantage of TradingView's native backtesting system for more detailed backtest results.
QaSH DCA Algorithm implements a DCA strategy that takes advantage of price volatility by buying dips to average down, and adjusting price targets as the break-even price gets lower.
How does the DCA strategy work?
When the specified entry condition has occurred, the indicator will set up several limit orders below the current price. If price goes up a specified amount, then the layers will be overwritten at the higher prices. If price goes down and fills the first layer (limit order), then the Take Profit price is plotted and will be sent in an alert. If more layers are filled, then the TP price will move down accordingly as it’s based on the average entry price (alerts on each TP update). This action of lowering the average entry and TP price mitigates your risk, and increases the likelihood of a Take Profit event happening. This script uses a simple "ASAP" mode, where each deal will start exactly 2 bars after the last trade ended. An EMA filter and stoploss function was also added for risk management.
How does this differ from other DCA bots?
1) The layer placements, order volume , and “take profit %” for each layer or “safety order” is much more customizable than what you get from other services. For example, I can choose to have my TP% change, depending on how big the price dip was. Maybe on safety order 1 I want 10% TP, but on safety order 7 might want a 2% TP.
2) The entry condition is adjustable. For example, this script has an ema filter for entries.
3) Settings optimization. You can take advantage of the replay feature and TradingView's backtest system to see how trades would have played out, and how much PnL you would have made
4) You can use this indicator on more than just crypto. You can easily set up alerts for manual trades on stocks, or you can integrate it with your stock broker API of choice and automate your trades.
5) When combining this with an automation service, you will get unmatched execution speed by running it on your dedicated machine.
6) I can offer a lifetime subscription to the indicator upon request.
What kind of market is it best used on?
QaSH DCA Algorithm is best used on assets that are volatile. That means large and frequent swings up and down. Also I recommend running this on many uncorrelated assets at the same time. Better yet, run it with a variety of different settings simultaneously on the same asset.
What settings should I use?
The default settings are decent for most markets, and provide a good balance between profit potential and downside protection, although you can use a wide variety of settings. In a strong bull market its best to either bring up your layers to catch smaller dips, or you can go big on the first few layers (maybe 4 layers, 25% on each layer for example). In a sideways or brearish market you'll want more downside protection, so you'll want the larger orders to be at lower prices, or possibly use the stoploss and EMA filter.
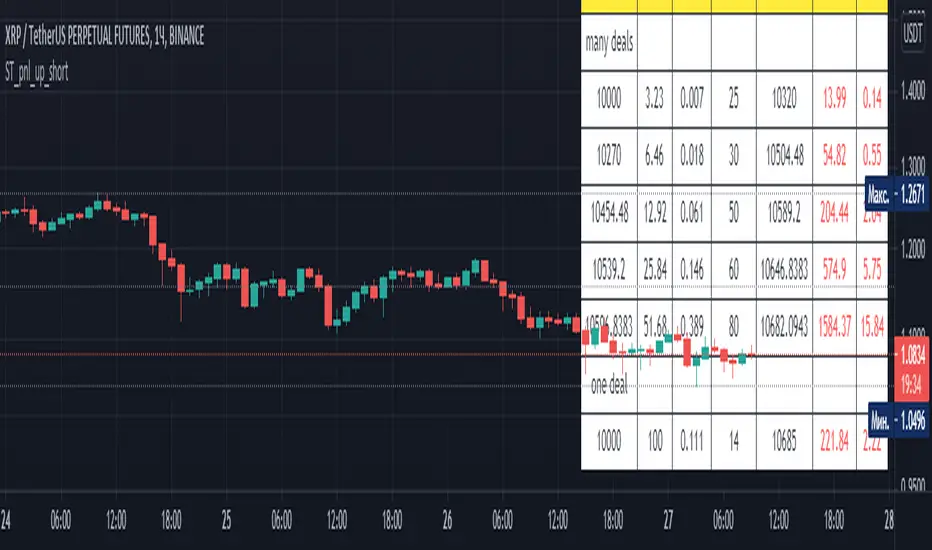
Alferow_pnl_up_shortThis script allows you to determine the leverage required to enter one position based on the set entry price, the price of the expected take profit, stop loss and risk per transaction. It also allows you to schedule this transaction for 5 possible transactions, with different shoulders and a martingale coefficient for each subsequent gain at the same risk, allowing you to qualitatively improve the pnl of the transaction with price fluctuations after entering the transaction. The script is designed for short positions.
Alferow_pnl_up_longThis script allows you to determine the leverage required to enter one position based on the set entry price, the price of the expected take profit, stop loss and risk per transaction. It also allows you to schedule this transaction for 5 possible transactions, with different shoulders and a martingale coefficient for each subsequent gain at the same risk, allowing you to qualitatively improve the pnl of the transaction with price fluctuations after entering the transaction. The script is designed for long positions.

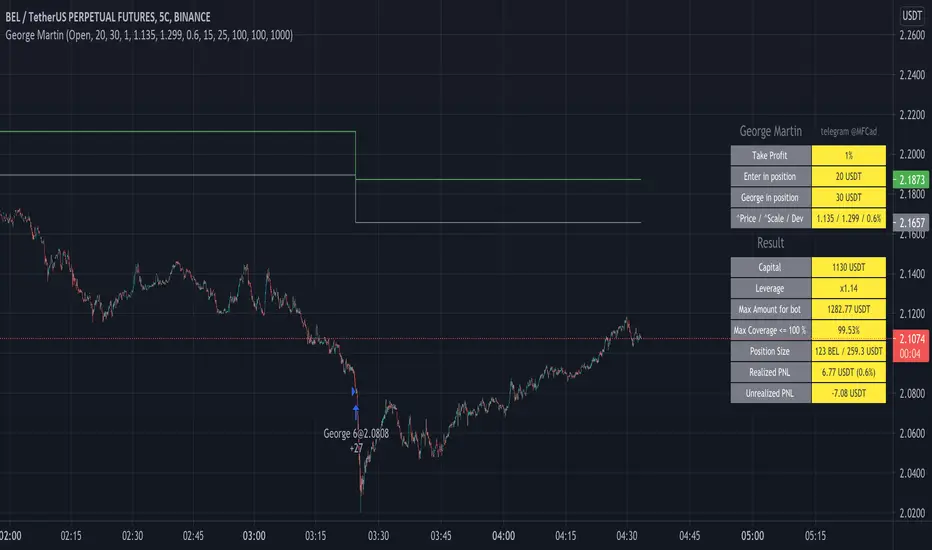
George MartinENG:
This script is based on a simple principle - MartinGale. Each subsequent entry, if the price goes in the wrong direction, increases the number of contracts taking into account the coefficient and also changes the entry price taking into account the coefficient. The coefficients can be configured so that the script keeps the drawdown up to 85%. For instructions and connection - write.
RUS:
Этот скрипт основан на простом принципе - Мартин Гейл. Каждый следующий вход если цена идет не в нужную сторону, увеличивает количество контрактов с учетом коэффициента и также меняется цена входа с учетом коэффициента. Коэффициенты можно настроить таким образом чтобы скрипт держал просадку до 85%. Для инструкций и подключения - пишите.
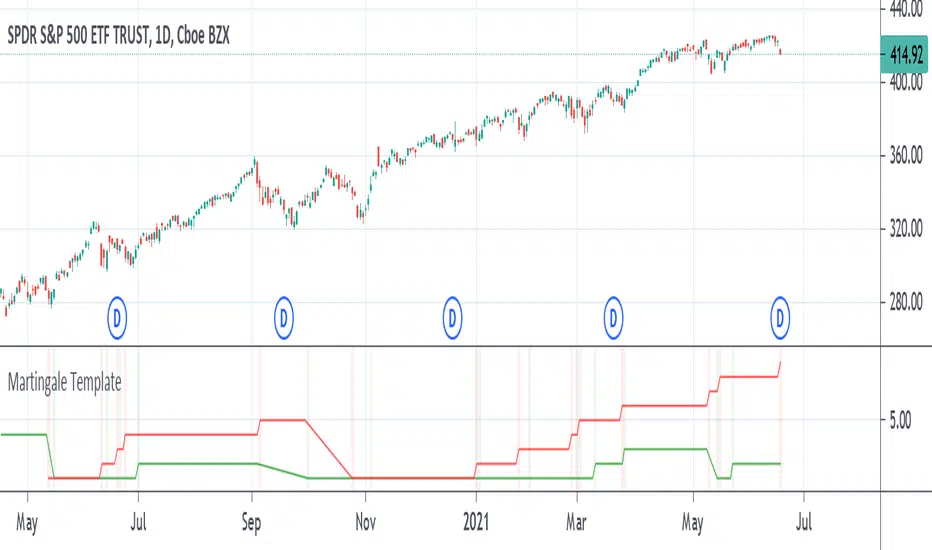
Martingale TemplateA template example on how to apply the famous Martingale gambling strategy. When your strategy gets an exit signal for your long position that leaves you without profit, you re-enter on the next entry long condition with double the capital of the previous amount entered with. You keep doubling the amount of capital entered with until you finally exit with a profit. If the strategy isn't sound enough then it could take several attempts and it can take only as much as a dozen tries to eat away at all your capital as the capital required to double on the next entry increases greatly over time by consecutive products of 2.
The strategy used is just a simple moving average crossover, above the moving average is going long, below the moving average is going short. It can be replaced with whatever strategy that you want. The colored vertical bars show long and short positions and exits. The default option on the tick box under the settings show the number of attempts at entering before finally exiting with a profit, the other option shows the amount of capital it took starting from 1.
Grid System With Fake MartingaleThe proposed strategy is based on a grid system with a money management that tries to replicate the effect of a martingale without having to double your position size after each loss, hence the name "fake martingale". Note that a balance using this strategy is still subject to exponential decay, the risk is not minimized, as such, it would be dangerous to use this strategy.
For more information on the martingale and grid systems see:
Strategy Settings
Point determines the "grid" size and should be adjusted accordingly to the scale of the security you are applying the strategy to. Higher value would require larger price movements in order to trigger a trade, generating fewer trades as a result.
The order size determines the number of contracts/shares to purchase.
The martingale multiplier determines the factor by which the position size is multiplied after a loss, using values higher to 2 will "squarify" your balance, while a value of 1 would use a constant position sizing.
Finally, the anti-martingale parameter determines whether the strategy uses a reverse martingale or not, if set to true then the position size is multiplied after each win.
How It Works
Let's illustrate how we replicate a martingale without doubling our exposure with a simple casino example. Imagine you are playing roulette, and that you are betting on colors (black/red), your payout is 1 to 1, in the case you win, you will have your initial stake back plus a profit equal to your initial stake.
If your strategy is to recover any previous losses, you can double your stake each time you lose, once you win you will get back the previous losses plus a profit equal to your original stake, this is the martingale system. So how can we win back previous losses without having to double our stake? We could do that by doubling the payout ratio after a loss, so after a loss, we must use a payout ratio of 2:1, if we lose once again we must use a payout of 4:1...etc, our payout ratio would be subject to exponential growth instead of our stake.
Of course, the payout ratio is fixed with casino games, but in trading, we can manipulate the position of our take profit in order to replicate such effect, this is what this strategy is doing. So after a loss, we place our take profit such that a win recover our losses back plus generate a profit.
Advantages
The advantage of this approach is that unlike the martingale we don't double our position size, which instead can remain constant, this is a huge advantage as a martingale will require a significant capital in order to tank a series of losses.
Disadvantages
The main disadvantage of this method is that the price might never reach our take profit after a long losing streak, our balance would remain in the red and we couldn't do anything about it except reset the strategy.
Frictional costs are still a disadvantage, as such, we would need to place our take profits in order to account for them, while this is still better than purchasing additional shares, it minimizes the chances of the price reaching the take profit.
Conclusions
An alternative money management system replicating the effect of a martingale as been presented, we can see that such a system is far from being perfect, and it would be foolish to use it, however, it stills offer a convenient alternative to less aggressive progressive position sizing systems.
I have been receiving some messages from users criticizing me for exposing the martingale money management system, and I understand why but I can't agree, talking about it allow me to warn users against it, the grid-martingale methodology is will create more harm than anything else, the reward is only one side of the story and should always be compared against the risk, so always take a look at all the statics in a backtest.
Thanks for reading!
Shout-Out
This post was made possible thanks to my patrons:
@Happymono, @AmariMars, @kkhaial, @Nugehe, @LucF, @Nosmok, @iflostio, @DankBeans, @ecletv, @Neverstorm, @alex.crown.jr, @uk503, @xkingshotss, @vsov, @jbelka, @yatrader2, @hughza, @ganh

Grid Like StrategyIt is possible to use progressive position sizing in order to recover from past losses, a well-known position sizing system being the "martingale", which consists of doubling your position size after a loss, this allows you to recover any previous losses in a losing streak + winning an extra. This system has seen a lot of attention from the trading community (mostly from beginners), and many strategies have been designed around the martingale, one of them being "grid trading strategies".
While such strategies often shows promising results on paper, they are often subjects to many frictions during live trading that makes them totally unusable and dangerous to the trader. The motivations behind posting such a strategy isn't to glorify such systems, but rather to present the problems behind them, many users come to me with their ideas and glorious ways to make money, sometimes they present strategies using the martingale, and it is important to present the flaws of this methodology rather than blindly saying "you shouldn't use it".
Strategy Settings
Point determines the "grid" size and should be adjusted accordingly to the scale of the symbol you are applying the strategy to. Higher value would require larger price movements in order to trigger a trade, as such higher values will generate fewer trades.
The order size determines the number of contracts/shares to purchase.
The martingale multiplier determines the factor by which the position size is multiplied after a loss, using values higher to 2 will "squarify" your balance, while a value of 1 would use a constant position sizing.
Finally, the anti-martingale parameter determines whether the strategy uses a reverse martingale or not, if set to true then the position size is multiplied after any wins.
The Grid
Grid strategies are commons and do not present huge problems until we use certain position sizing methods such as the martingale. A martingale is extremely sensitive to any kind of friction (frictional costs, slippage...etc), the grid strategy aims to provide a stable and simple environment where a martingale might possibly behave well.
The goal of a simple grid strategy is to go long once the price crossover a certain level, a take profit is set at the level above the current one and stop loss is placed at the level below the current one, in a winning scenario the price reach the take profit, the position is closed and a new one is opened with the same setup. In a losing scenario, the price reaches the stop loss level, the position is closed and a short one is opened, the take profit is set at the level below the current one, and a stop loss is set at the level above the current one. Note that all levels are equally spaced.
It follows from this strategy that wins and losses should be constant over time, as such our balance would evolve in a linear fashion. This is a great setup for a martingale, as we are theoretically assured to recover all the looses in a losing streak.
Martingale - Exponential Decays - Risk/Reward
By using a martingale we double our position size (exposure) each time we lose a trade, if we look at our balance when using a martingale we see significant drawdowns, with our balance peaking down significantly. The martingale sequence is subject to exponential growth, as such using a martingale makes our balance exposed to exponential decays, that's really bad, we could basically lose all the initially invested capital in a short amount of time, it follows from this that the theoretical success of a martingale is determined by what is the maximum losing streak you can endure
Now consider how a martingale affects our risk-reward ratio, assuming unity position sizing our martingale sequence can be described by 2^(x-1) , using this formula we would get the amount of shares/contracts we need to purchase at the x trade of a losing streak, we would need to purchase 256 contracts in order to recover from a losing streak of size 9, this is enormous when you take into account that your wins are way smaller, the risk-reward ratio is totally unfair.
Of course, some users might think that a losing streak of size 9 is pretty unlikely, if the probability of winning and losing are both equal to 0.5, then the probability of 9 consecutive losses is equal to 0.5^9 , there are approximately 0.2% of chance of having such large losing streak, note however that under a ranging market such case scenario could happen, but we will see later that the length of a losing streak is not the only problem.
Other Problems
Having a capital large enough to tank 9any number of consecutive losses is not the only thing one should focus on, as we have to take into account market prices and trading dynamics, that's where the ugly part start.
Our first problem is frictional costs, one example being the spread, but this is a common problem for any strategy, however here a martingale is extra sensitive to it, if the strategy does not account for it then we will still double our positions costs but we might not recover all the losses of a losing streak, instead we would be recovering only a proportion of it, under such scenario you would be certain to lose over time.
Another problem are gaps, market price might open under a stop-loss without triggering it, and this is a big no-no.
Equity of the strategy on AMD, in a desired scenario the equity at the second arrow should have been at a higher position than the equity at the first arrow.
In order for the strategy to be more effective, we would need to trade a market that does not close, such as the cryptocurrency market. Finally, we might be affected by slippage, altho only extreme values might drastically affect our balance.
The Anti Martingale
The strategy lets you use an anti-martingale, which double the position size after a win instead of a loss, the goal here is not to recover from a losing strike but instead to profit from a potential winning streak.
Here we are exposing your balance to exponential gross but you might also lose a trade at the end a winning streak, you will generally want to reinitialize your position size after a few wins instead of waiting for the end of a streak.
Alternative
You can use other-kind of progressions for position sizing, such as a linear one, increasing your position size by a constant number each time you lose. More gentle progressions will recover a proportion of your losses in a losing streak.
You can also simulate the effect of a martingale without doubling your position size by doubling your target profit, if for example you have a 10$ profit-target/stop-loss and lose a trade, you can use a 20$ profit target to recover from the lost trade + gain a profit of 10$. While this approach does not introduce exponential decay in your balance, you are betting on the market reaching your take profits, considering the fact that you are doubling their size you are expecting market volatility to increase drastically over time, as such this approach would not be extremely effective for high losing streak.
Conclusion
You will see a lot of auto-trading strategies that are based on a grid approach, they might even use a martingale. While the backtests will look appealing, you should think twice before using such kind of strategy, remember that frictional costs will be a huge challenge for the strategy, and that it assumes that the trader has an important initial capital. We have also seen that the risk/reward ratio is theoretically the worst you can have on a strategy, having a low reward and a high risk. This does not mean that progressive position sizing is bad, but it should not be pushed to the extreme.
It is nice to note that the martingale is originally a betting system designed for casino games, which unlike trading are not subject to frictional costs, but even casino players don't use it, so why would you?
Thx for reading

MMP Indicator 4-step WeeklyFading levels using martingale (limit orders, rebate venue) with no stop-loss orders, long the wings at the end of Support and Resist levels from prior week Friday right before the close. Re-hedge the order book units when there is a breakout.
