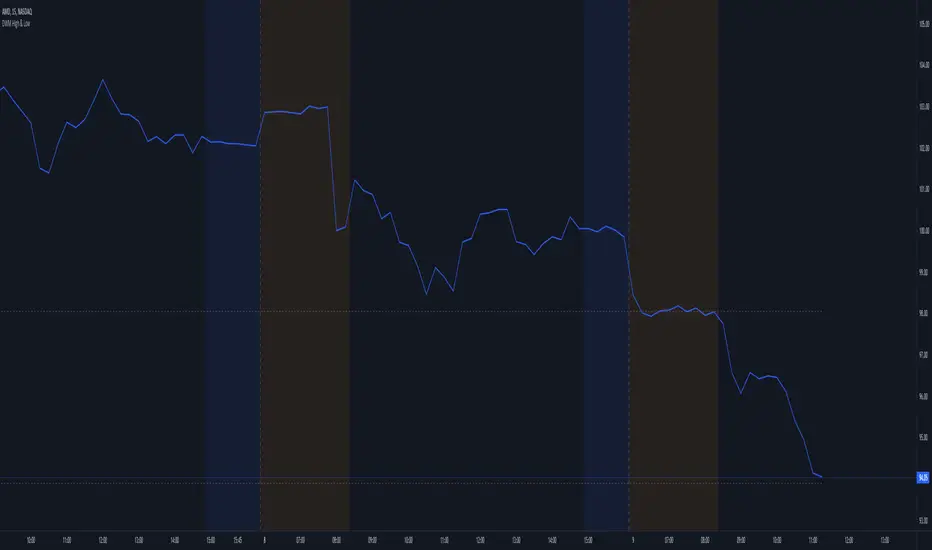
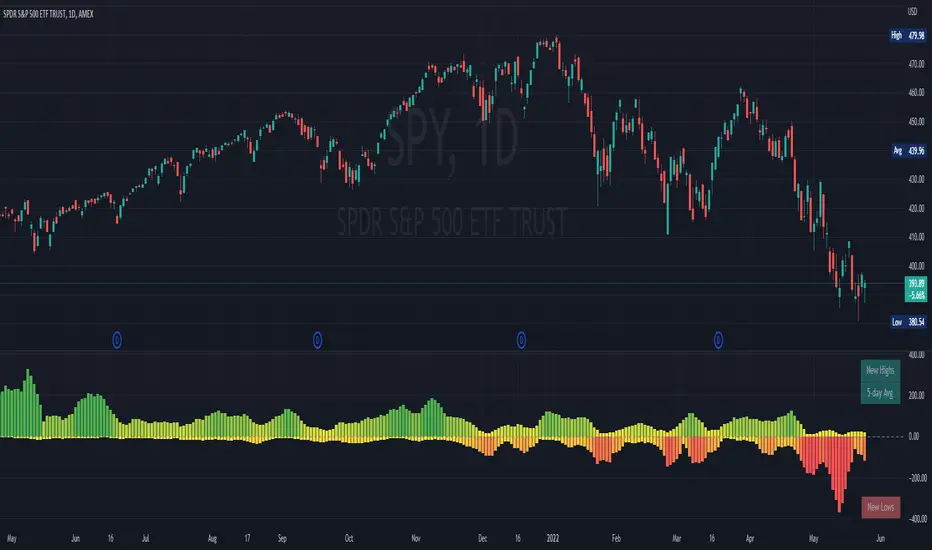
Net New Highs/Lows (With visible code)Basically the same script than Carusolnsights but without hidding the lines of code...
"This indicator displays the net number of stocks on the Nasdaq Composite making 52-week highs or lows. For instance, if there are 60 new 52-week highs and 20 new 52-week lows, the net number will display 40 net new 52 week highs. This indicator is particularty useful in gauging what the breadth is of the Nasdaq.
Three days of net 52-week highs show a healthy market which is conducive to increasing exposure. This condition is highlighted with a green background.
Three days of net 52-week lows show an unhealthy market which is conducive to reducing exposure. This condition is high|lighted with a red background."
LOW

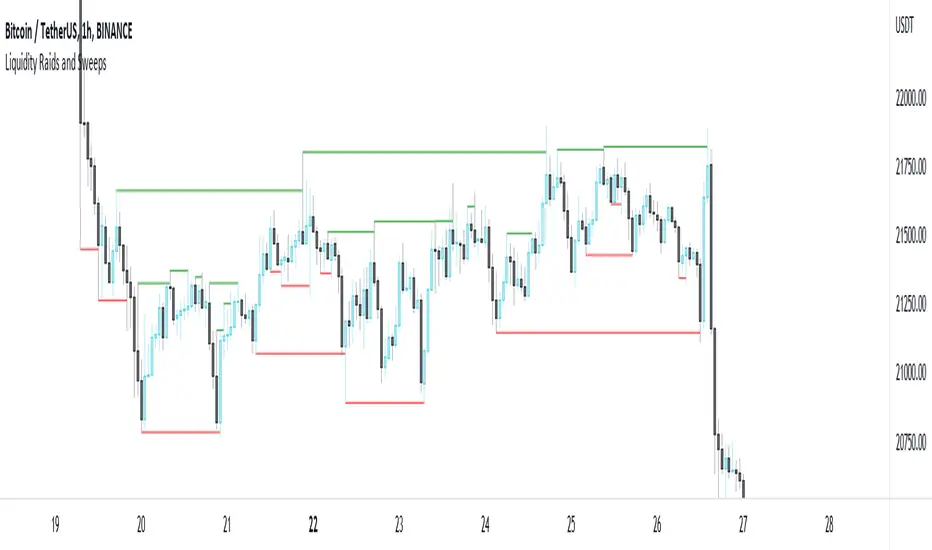
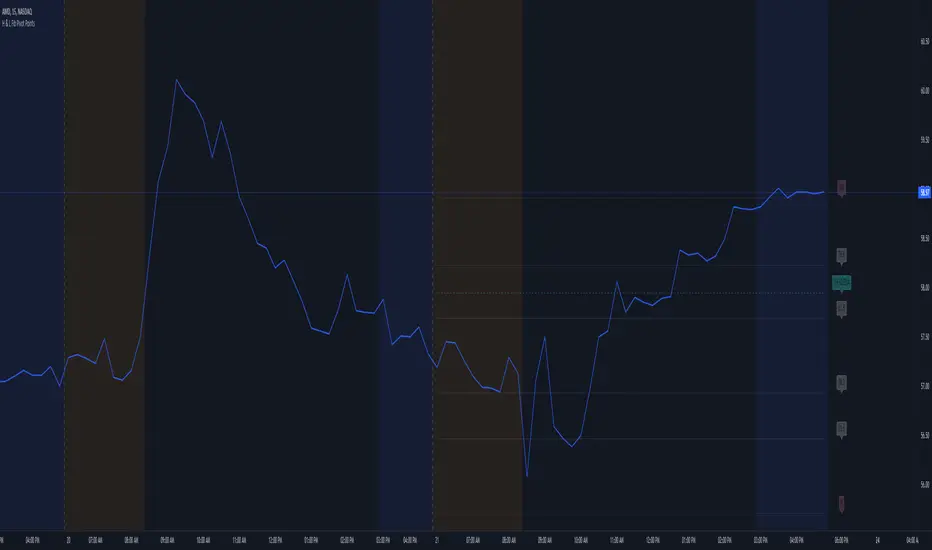
Liquidity Raids and Sweeps by TexmoonbeamLiquidity is a vital concept in trading. It gives us an indication of where buy / sell orders are in the market, and the direction price is likely to move once this liquidity has been taken.
The purpose of this indicator is to show you when and where there has been a 'raid' or 'sweep' of this liquidity, meaning a reversal might occur.
The indicator does this by looking for candle wicks, that go beyond a previous pivot high or low.
Settings:
Timeframe – This settings changes the timeframe that the indicator looks for raids/sweeps. Higher timeframes generally mean stronger moves.
Left bars – the number of bars gap higher/lower to the left of a pivot low/high. A higher number means the high or low was formed from a stronger move.
Right bars – the number of bars gap higher/lower to the right of a pivot low/high. A higher number means the high or low started a stronger move.
Max Gap – the maximum number of candles between a raid or sweep. Reduce this number on higher time frames if there are memory errors.
Min Gap – the minimum number of candles between a raid or sweep.
Alerts Wait For Close – If ticked, this means an alert will not be triggered by the current candle wick, overlapping a previous, until the close of that candle. Unticked you will be alerted as soon as the current candle crosses a previous high/low, though it might close far beyond that point and not actually turn out to be a raid/sweep.
Buy Side/Sell Side – line style and colour preferences for buy and sell side.
Strategy:
As seen in the example chart, the raid/sweep of liquidity, where only a wick reaches beyond a previous high or low, can be followed by a reversal of direction, often to seek other liquidity targets. This indicator could provide an opportunity to enter a trade at this point and the alert feature means you will be able to set up custom alerts on multiple charts or timeframes.
You should use other confluence and a lower time frame confirmation after a raid/sweep, to identify your entry, stop loss and targets. Familiarity with liquidity and smart money concepts are recommended.
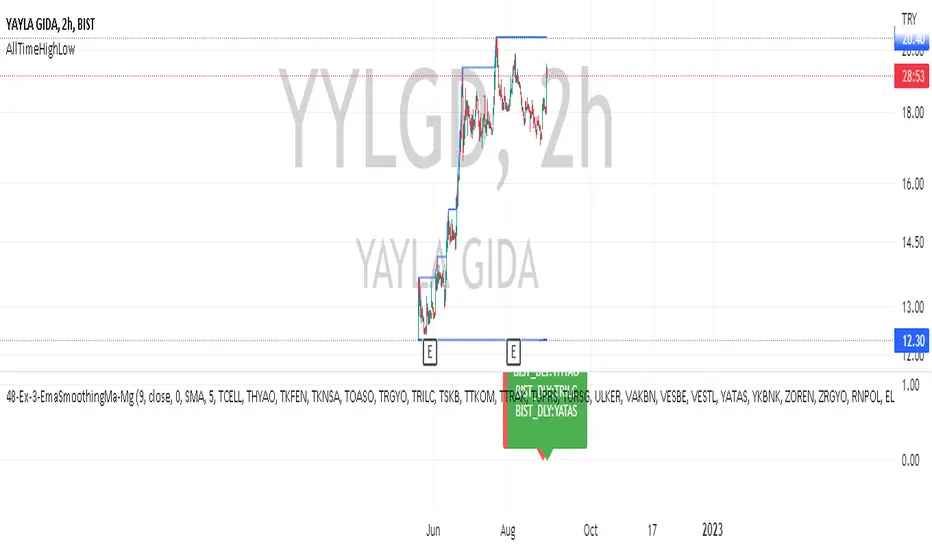
AllTimeHighLowLibrary "AllTimeHighLow"
Provides functions calculating the all-time high/low of values.
hi(val)
Calculates the all-time high of a series.
Parameters:
val : Series to use (`high` is used if no argument is supplied).
Returns: The all-time high for the series.
lo(val)
Calculates the all-time low of a series.
Parameters:
val : Series to use (`low` is used if no argument is supplied).
Returns: The all-time low for the series.
All-In-One Sessions, Weekly, Monday, Previous Highs/LowsWe are forever drawing key levels on our charts with saved drawing templates, but finding the levels, adding the labels, is all tedious stuff. We have indicators, but we have multiple different ones at a time.
What if you could just tick a box on/off?
Well now you can.
This all in one 'levels' indicator is designed to show all the key highs and lows from previous weeks, Monday, the current week, as well as an option to highlight the market sessions and their highs and lows.
There are lots of options available for extending lines and choosing their colors, so once you have set it up how you want, don't forget to save YOUR defaults.
Oorah.

Mark StructureMark Structure is building the market swing structure, minor and sub structure and marks all possible insignificant pivots
Building such structure is really complex task to do, that has a lot of obstacles and challenges. I'm doing my best to develop this indicator behaving in absolutely expectable and right way. Fill free to leave any comments or bug reports.
it supports:
- Marking all pivots with labels or join them continuously with trend lines.
- Marking minor and sub structured swings with labels or join them continuously with trend lines. Marking BOS or SMS BOS, which are mbos. Minor and substructure are structures inside swing structure and it can differ from the structure of lower timeframe
- Marking swings of swing structure with labels or join them continuously with trend lines. Marking BOS or SMS BOS of swing structure
- Changing bullish and bearish colors of each kind of structures
- Changing pivot labelings
- Changing colors of BOSs
Remarks:
- As I told you guys before, it has a lot of challenging cases. eg we have swing low and high on the same candle and in order to decide which pivot goes first I take lower time frame data to figure out what pivot is the first, but it happens that on lower time frame the same issue takes place, due to limitation of TradingView I can't go infinitely to lower timeframes to solve this issue, so I mark those cases with labels
- Another issue is very beginning of the trend its hard to detect swing structure there due to missing historical data. so skip a few waves in the very beginning
- Don't expect to have minor and sub structure in each swing waves, its totally fine when you don't have them at all
- Swing structure is the most significant structure and shows real price direction. Trend change is confirmed when for bull->bear the last HLbull LH>HH and HH-HL-HH are confirmed. You can change labelling for unconfirmed swing trend in the settings. By default its already done

Mondays Range by B1rdPlots mondays range (high, low and optionally average)
Features:
Added the option to extend the range for the entire week or just monday
Added the option to display if the high or low of the range has been taken and removes the level aftwards
Added the option to only display the current week
Added the option to visualize new weekly sessions
Added the option to mark mondays with a seperate background
Will update the script based on suggestions

PharshK RSI and Zigzag with H/LIt is with RSI level
and Zigzag Pattern that Market goes on Maximum level and Lower Level
And it is also Showing High and Law Level of last Moving Candle so it is easy to entry and Hold

Day Week Month High & LowThis is a small little script that helps visually mark the high and lows of the DAY, WEEK or MONTH (of your choosing). It's best when paired with my High and Low Fibonacci Pivot Points indicator to help emphasize the high and lows of the day, week or month.
High and Low Fibonacci Pivot PointsThis is a standard fibonacci retracement level indicator and free to use for all. I couldn't find any decent retracement levels that works for me (and definitely wasted money on paid script access that didn't work so well for my trading style), so I created this for my own use and now sharing it with the TradingView community. Fibonacci retracement levels help traders predict key areas where a stock/security may find support or resistance. The common ratios are available, such as 23.6, 38.2, 61.8 and so forth. You can choose from Day, Week or Month for your fibonacci retracement lines. In order to keep in sync with my particular style of keeping charts nice and clean, I've created this indicator with defaults to use friendly color schemes. You can of course, choose another color, etc... that fits your own taste. All of my published scripts utilize TradingView's version 5 scripting.
Main Features:
- Show or hide pre-market high and lows (the pre-market high & lows are hidden by default)
- Show or hide the 1-hour 20 EMA line (hidden by default, as this is more uncommon than the 1-hour 50 EMA line for potential support or resistance)
- Show or hide the 1-hour 50 EMA line
- Show or hide the fibonacci retracement lines (the 50% line is hidden by default)
- Option to allow the fibonacci retracement lines to start out the first few minutes of market open to use the pre-market high & low. Once the stock/security price breaks either the pre-market high or pre-market low, it reverts to using the day's high and low. This only works on chart timeframes under the daily time frame.
FYI:
All customizable settings have a help/info window. Please refer to the help/info window, if you're unsure of what a setting does what. Also, note that I wrote and published this script after market close, so I haven't had the chance to check/test if everything works, which can only be fully verified during market open hours (for non-crypto securities).
* Please note that this script is in its early beta stage and there could be bugs. This is being provided as is and the information provided by this script is meant for informational/entertainment purposes only.
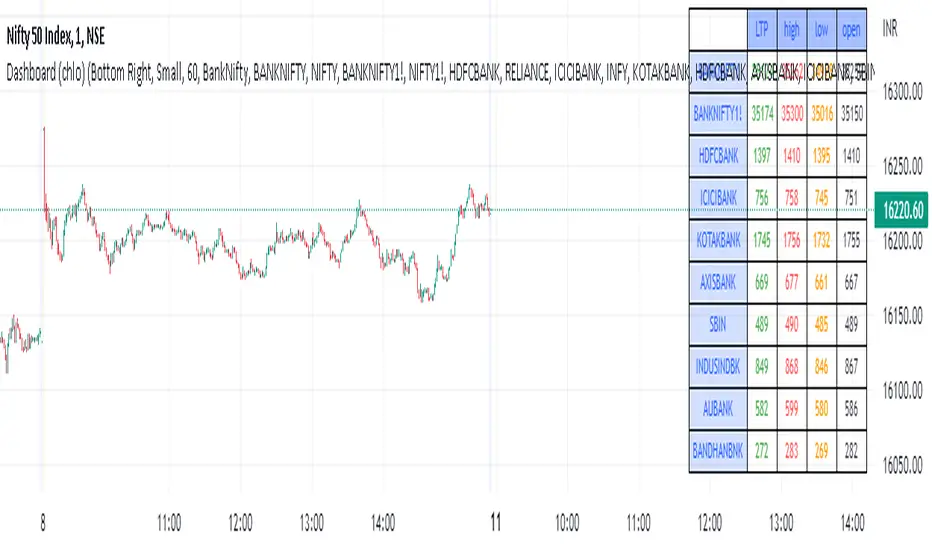
Dashboard (chlo) - v1I am an aircraft maintenance technician who is trying to get into software development in the financial sector.
This is a project in which a dashboard of other security(stocks) with open, close, high, and low will appear.
I could compile this after a detailed study of different dashboards and pine script for several hours
hope you like this.
Rets High/Low (2.0 Special Uncensored Edition)This script can be used as a visual aid in seeing the last highs and lows of price in a specific time period. It automatically updates the plots if new highs or lows are made within the given lookback period.
This is a fairly basic version currently, with new added features coming in future updates such as range between high/low and half and whole number detection.

MTF High LowThis is a Multi-Time Frame High Low Indicator that plots the highest and lowest price levels of the chart timeframe and a user selected higher timeframe.
The length can be optimized by the user from settings (default value is 6 candles) and table position can also be adjusted.
The calculation does not takes into account the last candle price data to form a view using the current close price as described below:
If Close > mid value of High + Low, view is Bullish
If Close < mid value of High + Low, view is Bearish
The above is also calculated for the higher timeframe and view for both timeframe is updated in the chart.
The color coding is dynamic based upon the current close price levels and comparisons with High, Low and Mid values.
The mid values level plot is hidden by default and can be enabled and saved as default if the user likes so.

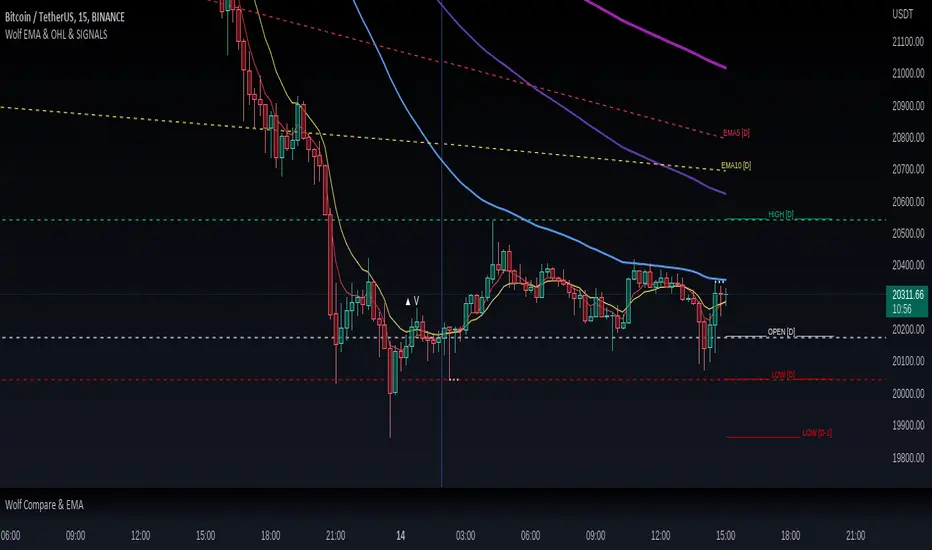
Wolf EMA & OHL & SIGNALSWolf EMA & OHL & SIGNALS
this indicator is mainly used for fast trading techniques (scalping). provides various tools for comprehensive trend analysis.
5 EMAs are used to have possible market entry or exit signals.
EMA
Thanks to the combination of the EMAs of different timeframes,
you can immediately get an idea of the resistances or supports
of the higher timeframes.
HOL
Lines are drawn on the right side indicating the maximum, minimum and opening
of the day, past day, week and past week respectively.
These levels are excellent as price acceleration points.
SIGNALS
There are three types of signals that are monitored by this indicator:
- Shimano
This signal is generated if the price remains compressed between two EMAs, more precisely between the third and the fifth, at the point where the price breaks one of these EMAs there can be a strong price movement.
- Viagra
This signal is generated if the price remains below the second EMA for a long time without ever closing above / below, at the point where it closes by climbing over the EMA there may be a change in trend.
-Bud
This signal is generated if a positive candle is formed and subsequently at least two that close within the high and low of the positive candle. Where the price breaks through the high of the positive candle is a great entry point.
NYSE New Highs vs New LowsNYSE New Highs vs New Lows is a simple market breadth indicator that compares HIGN, the number of new highs during that day, and LOWN, the number of new lows. The new highs are on top and lows are appropriately on bottom. Without averaging, it's a little chaotic so you can smooth them out as much as you want, and the top-right label shows how much you're smoothing.
Interpretation:
Essentially, we use $SPY or $QQQ as a proxy for what's going on in the market, but because the FAANG stocks are so heavily weighted, it's not always representative. If SPY is flat/down, but there are 200 new highs today, then one of the big boys is weighing down an otherwise very bullish market. It's like looking at one of those heatmap charts, but in a single number.
Bullish Trend
- Lots of new highs
- Very few new lows
Bearish Trend
- Lots of new lows
- Very few new highs
Potential Reversal
- Too high, 250+
- Too low, 150+
High/Low/Open/Close Daily, Weekly, Monthly Line
I wrote this for the purpose of saving time while marking up charts by automating the process of drawing and labeling lines at areas of interest on larger
timeframes while still having the option to change the style and size of the lines and labels to adjust for any timeframe and avoid a messy chart.
I also used this as an exercise in menu organization giving users every imaginable option and producing clean readable code.
- This indicator draws a line on the Daily, Weekly, and Monthly bar at the High, Low, Open and Close of each bar as price
tends to react when revisiting these areas.
- Each set of bars has an optional identifying label with its own color set that can be shown with or without the lines
price value, and has drop down menus for size and style of each set of labels.
- Each set of lines has inputs for line/text color, line width and style, and can be hidden if the user doesn't have the need for any particular timeframe.
- Lines and Labels with delete when a new line is created.
- I recommend going into Chart Settings/Status Line and turning off indicator arguments OR moving the script to the top
of the indicator list to avoid an obstructed chart view with this indicators arguments. When Pine allows, I will update it to hide them.
Contains some public domain code from T.V. manuals and tutorial for creating drop down input menus for options.
/ ~For My Pal Jittery~
~ Who likes his clean chart and custom colors~

Lowest / Highest From WidgetRecent events inspired me to create a small widget that allows you to spot from when current value is lowest / highest.
Just add it to chart and script will compute most recent day when price was higher / lower than current and it will display:
Line coming from that value to the current one
A table with previous low/high information
Thanks to @MUQWISHI to help me coding it.
Disclaimer
Please remember that past performance may not be indicative of future results.
Due to various factors, including changing market conditions, the strategy may no longer perform as well as in historical backtesting.
This post and the script don’t provide any financial advice.

3D GATOR %HLThis indicator tracks the 3 day trading bots and measures the high and the low (%).
Usually a trend can change or continue every 3 days.
When volatility decreases and both values are the same gator is going to open its jaws so it's a good time to open a position long. Avoid shorts during low volatility.
On the other hand when volatility increases, and gator has its jaws wide open is a good time to look for shorts.
That's pretty much it.
This indicator was designed by me and created by Marketwatcher.

Scalping The Bull IndicatorName: Scalping The Bull Indicator
Category: Scalping, Trend Following, Mean Reversion.
Timeframe: 1M, 5M, 30M, 1D depending on the specific technique.
Technical Analysis: The indicator supports the operations of the trader named "Scalping The Bull" which uses price action and exponential moving averages.
Suggested usage: Altcoin showing strong trends for scalping and intra-day trades. Trigger points are used as entry and exit points and to be used to understand when a signal has more power.
It is possible to identify the following conformations:
Shimano: look at the price records of a consecutive series of closings between the EMA 60 and the EMA 223 when a certain threshold is reached. Use the trigger points as price structures to identify entry and exit zones (e.g. breakout of the yesterday high as for entry point) .
Bomb: look at the price registers a percentage variation in a single candle, greater than a threshold such as 2%, in particular on shorter timeframes and around the trigger points.
Viagra: look at there is a consecutive series of closes below the EMA 10.
Downward fake: look when, after a cross under (Death Cross), the price returns above the EMA 223 using the yesterday high as a trigger point.
Emergence: look at the EMA 60 is about to cross over the EMA 223.
Anti-crossing: look at, after an important price rise and a subsequent retracement, the EMA 60 is about to cross under the EMA 223 but a bullish impulse brings the price back above the EMAs.
For Sales: look at two types of situations: 1) when the price falls by more than 10% from the opening price and around the yesterday’s low or 2) when the price falls and then reaches, in the last 5 days, a bigger percentage and then breaks a trigger point.
Colour change: look at the opening price of the session - indicated as a trigger point.
Third touch of EMA 60: look for 3 touches below the EMA 60, and enter when there is a close above the EMA 60.
Third touch of EMA 223: look for 3 touches when there are 3 touches below the EMA 223, and enter when there is a close above the EMA 60.
Bud: look at price when it crosses upwards the average 10 and subsequently at least 2 "rest" candles are between the maximum and minimum of the breaking candle.
Fake on EMA 10: look for the open of a candle higher than the EMA 10, the minimum of the candle lower and the closing price returns above the EMA 10..
For Stop Loss and Profit Targets consider a proper R/R depending on Risk Management, using price structures such as the low of the entering candle and a quick Position Management moving quickly the Stop-Loss at Break-Even.
Configuration:
Market
EMA: The indicator automatically configure itself on market it knows (Binance, Piazza Affari and NASDAQ) otherwise it can be configured manually fo Crypto market (5/10/60/223) or Stock Market (5/10/50/200).
Additional Average: You can display an additional average, e.g. 20-period average.
Chart elements:
Session Separators: indicates the beginning of the current session (in blue)
Background: signals with the background in green an uptrend situation ( 60 > 223) and in red background a downtrend situation (60 < 223).
Trigger points:
Today's highs and lows: draw on the chart the opening price of the daily candle and the highs and lows of the day (high in purple, low in red and open in green)
Yesterday's highs and lows: draw on the chart the opening price of the daily candle, the highs and lows of the previous day (high in yellow, low in red).
Credits
Massimo : for refactoring and suggestions.

HTF Liquidity Levels█ OVERVIEW
The indicator introduces a new representation of the previous days, weeks, and months highs & lows ( DWM HL ) with a focus on untapped levels.
█ CONCEPTS
Untapped Levels
It is popularly known that the liquidity is located behind swing points or beyond higher time frames highs/lows (in a sense, an intraday swing point is a day high/low). These key areas are said "liquid" because of the accumulation of resting orders, mainly in the form of stop-loss orders. And this more significantly on higher time frames which have more time for stacking orders. As the result, the indicator aims to keep track of untapped levels that have their liquidity states intact.
Liquidity Pools
Once a liquidity level identified, or better, a cluster of liquidity levels work as magnets for the market. The price is more likely to make its way towards heavier pockets of liquidity, by proximity (the closest liquidity pool), and by difficulty (path with less obstacles). This phenomenon is referred as liquidity run, raid, purge, grab, hunt, sweep, you name it. Consequently, the indicator can help you frame a directional bias during your trading session.
█ NOTES
Drawings
Once a level is tapped, it is highlighted. At the end of each day, all tapped levels are cleared.

4C Daily Levels Suite + Premarket High/LowThis '4C Daily Levels Suite + Premarket High/Low' indicator is a clean way to automatically plot important daily levels including:
Prior Day High
Prior Day Low
Prior Day Close
50% level between Prior High/Low
Today's Open
Today's Premarket Low+High
This Daily Levels indicator is unique in its ability to:
-Plot all of the daily level PLUS premarket high/low levels (extended hours must be turned ON)
-Can hide past days levels, only plotting levels on the current day, to keep chart cleaner
-Can extend line levels right or fullscreen
-Plots the level price at each level on the chart
-Can show/hide price levels labels
-Can add supplemental premarket levels plot to show levels being formed during the premarket time period
-Coded with line.new vs plot so dashed lines are available as a style
-Automatically hides the indicator if the timeframe selected is Daily or greater
SEE SCREENSHOT EXAMPLES BELOW
Default mode, with extended hours showing:
With supplemental premarket plot showing:
Default mode without extended hours showing:
Showing past day’s levels
Extend lines to fullscreen
Some parts of this code were adapted from 'pd Levels' by CryptoCurl

HLC True Strength Indicator (with Vix)HLC True Strength Indicator Volume Weighted with Vix Line by SpreadEagle71
This indicator is a True Strength Indicator with Close, High and Low used together, along with the TSI of the Vix.
The white line is the close. The red line is the lows and the blue is the highs. These are also volume-weighted.
How to Interpret:
1. zero line crosses. If SPY/SPX500 crosses the zero line, then its bullish. If the purple Vix line crosses up, watch out because this is bearish.
2. white/blue/red lines cross purple (Vix). If they cross upwards, this is bullish. If downward, this is bearish. Basically, SPX, ES1!, SPY or even DIA can be used. The security and the Vix should travel in opposite directions and cross the zero-line at the same time. But this is not always the case.
3. Black area infills. These are used between the close and the highs (blue) and the lows(red). Close should not be between these in order to have momentum.
4. Close (white line) leads. Close is the last price so it tends to show where the others (highs and lows) are going. If the close is sagging below a high where the blue lines are on top, this could mean that there is a reversal coming. Same holds true for a white line above a "valley" formed by the blue and red lines; it could mean a reversal to the upside soon.
5. The Black Infill areas as a squeeze or contraction/expansion area. The thinner the black infill areas, the more of a momentum "squeeze" could be present. Wide black infill areas mean increased volatility and what may come next is a reversion to the mean for volatility. See TTM Squeeze Indicator or the Squeeze Momentum Indicator (kudos LazyBear).
Lastly, just remember indicators indicate; they are not magic. :)
SpreadEagle71

Wurucututu's Daily/Weekly/Monthly HLOCThis script draws the High/Low range for a daily, weekly, or monthly periods. By default is set to weekly.
Also it draws the open and close for each period, painting it in red if open greater than close, and green otherwise.
You can forward shift ranges to see how current price action interacts with ranges from past periods. By default this is set to zero.
For instance, here is the interaction of current week with previous week range (i.e. a 1 week shift forward).
And here is a 7 month shift forward.

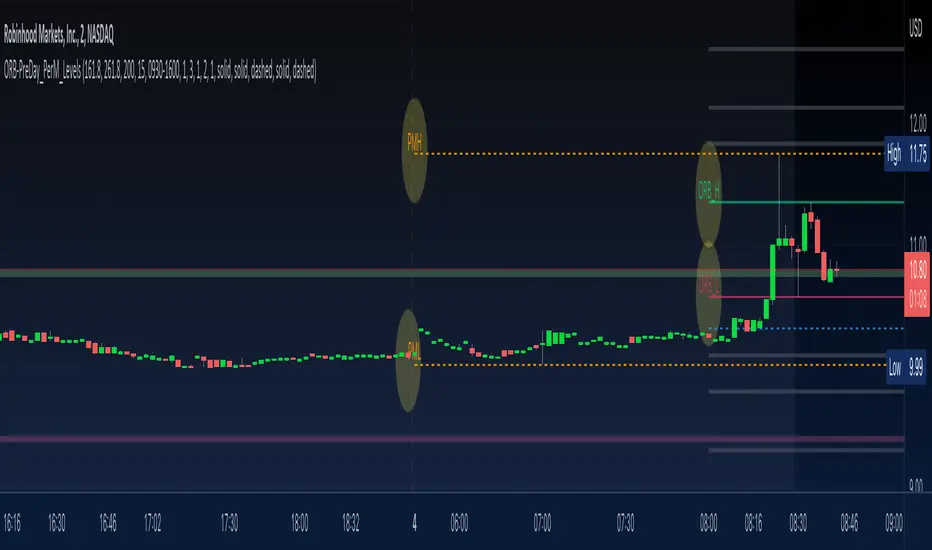
ORB-PreDay_PerM_LevelsThis script provides following levels:
1. ORB Level - You can adjust the timeframe of Opening Range (plots from 9am to 4pm)
2. ORB Fib Extension - 1.618 and 2.618 Fibonacci Extension of ORB High and Low (plots from 9am to 4pm)
3. Previous Day High/Low/Close - You can adjust color/thickness of the lines (plots from two days ago so that you can clearly see the levels)
4. Previous Two Days High/Low (plots from two days ago so that you can clearly see the levels)
5. Pre-Market High/Low (plots from 6:30am to 11am)
All in one indicator gives much better clarity of where current instrument is trading in relation to ORB, Previous Day Levels and Previous Two Days Levels along with Pre Market Levels.
You could combine these levels with your favorite EMA or EMA Cloud to create a trading system.
You could combine these levels with MA Cloud and ATR vs DTR script to gauge the move.
Look at the TWTR Chart today and see how these levels are respected.