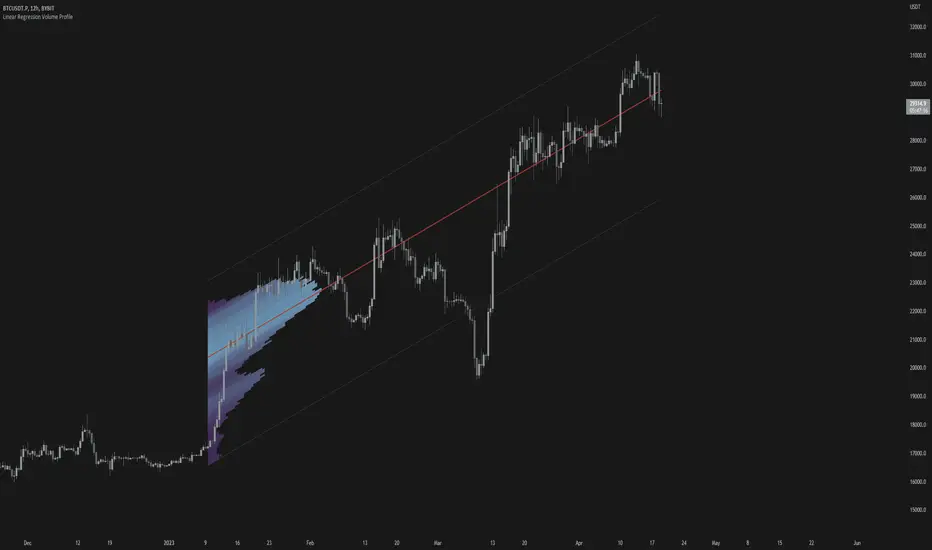
Linear Regression Volume ProfileLinear Regression Volume Profile plots the volume profile fixated on the linear regression of the lookback period rather than statically across y = 0. This helps identify potential support and resistance inside of the price channel.
Settings
Linear Regression
Linear Regression Source: the price source in which to sample when calculating the linear regression
Length: the number of bars to sample when calculating the linear regression
Deviation: the number of standard deviations away from the linear regression line to draw the upper and lower bounds
Linear Regression
Rows: the number of rows to divide the linear regression channel into when calculating the volume profile
Show Point of Control: toggle whether or not to plot the level with highest amount of volume
Usage
Similar to the traditional Linear Regression and Volume Profile this indicator is mainly to determine levels of support and resistance. One may interpret a level with high volume (i.e. point of control) to be a potential reversal point.
Details
This indicator first calculates the linear regression of the specified lookback period and, subsequently, the upper and lower bound of the linear regression channel. It then divides this channel by the specified number of rows and sums the volume that occurs in each row. The volume profile is scaled to the min and max volume.
Linear-regression
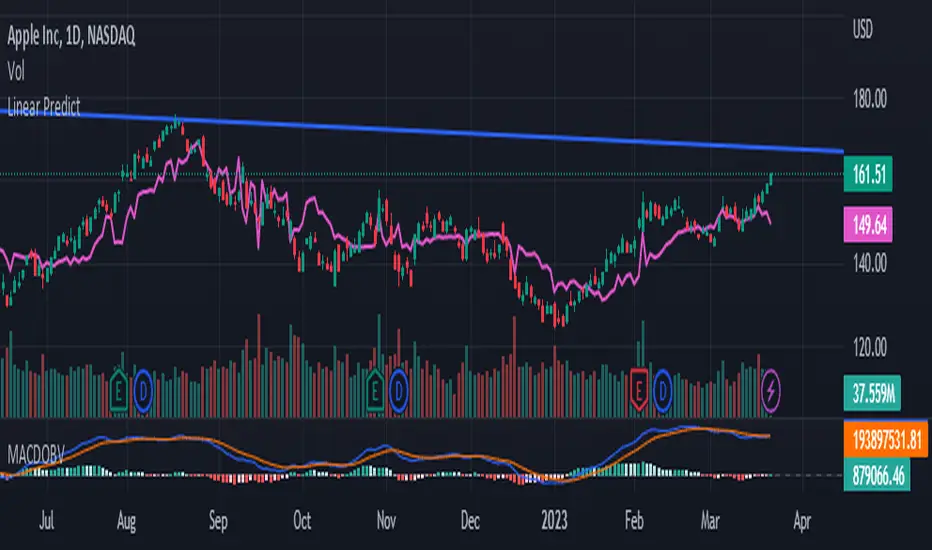
Linear Regress on Price And VolumeLinear regression is a statistical method used to model the relationship between a dependent variable and one or more independent variables. It assumes a linear relationship between the dependent variable and the independent variable(s) and attempts to fit a straight line that best describes the relationship.
In the context of predicting the price of a stock based on the volume, we can use linear regression to build a model that relates the price of the stock (dependent variable) to the volume (independent variable). The idea is to use lookback period to predict future prices based on the volume.
To build this indicator, we start by collecting data on the price of the stock and the volume over a selected of time or by default 21 days. We then plot the data on a scatter plot with the volume on the x-axis and the price on the y-axis. If there is a clear pattern in the data, we can fit a straight line to the data using a method called least squares regression. The line represents the best linear approximation of the relationship between the price and the volume.
Once we have the line, we can use it to make predictions. For example, if we observe a certain volume, we can use the line to estimate the corresponding price.
It's worth noting that linear regression assumes a linear relationship between the variables. In reality, the relationship between the price and the volume may be more complex, and other factors may also influence the price of the stock. Therefore, while linear regression can be a useful tool, it should be used in conjunction with other methods and should be interpreted with caution.
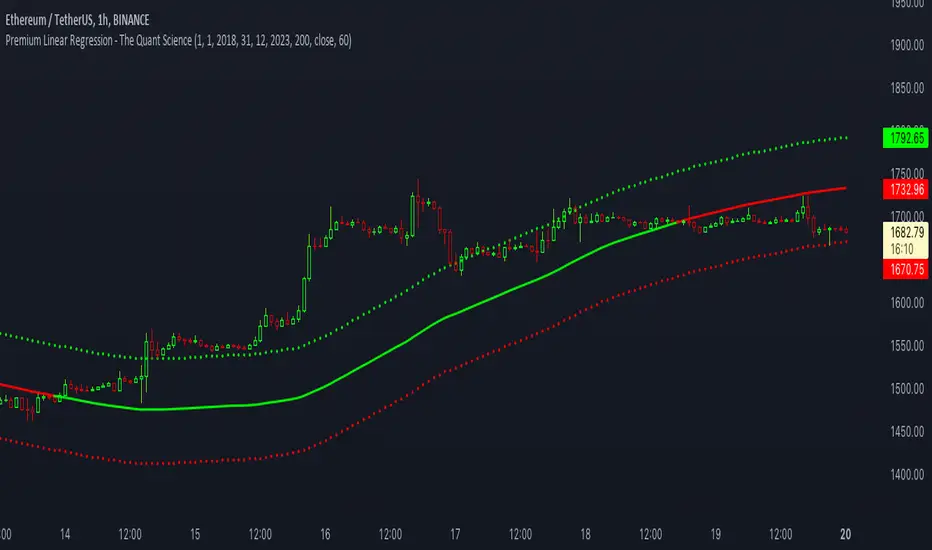
Premium Linear Regression - The Quant ScienceThis script calculates the average deviation of the source data from the linear regression. When used with the indicator, it can plot the data line and display various pieces of information, including the maximum average dispersion around the linear regression.
The code includes various user configurations, allowing for the specification of the start and end dates of the period for which to calculate linear regression, the length of the period to use for the calculation, and the data source to use.
The indicator is designed for multi-timeframe use and to facilitate analysis for traders who use regression models in their analysis. It displays a green linear regression line when the price is above the line and a red line when the price is below. The indicator also highlights areas of dispersion around the regression using circles, with bullish areas shown in green and bearish areas shown in red.
VHF Adaptive Linear Regression KAMAIntroduction
Heyo, in this indicator I decided to add VHF adaptivness, linear regression and smoothing to a KAMA in order to squeeze all out of it.
KAMA:
Developed by Perry Kaufman, Kaufman's Adaptive Moving Average (KAMA) is a moving average designed to account for market noise or volatility. KAMA will closely follow prices when the price swings are relatively small and the noise is low. KAMA will adjust when the price swings widen and follow prices from a greater distance. This trend-following indicator can be used to identify the overall trend, time turning points and filter price movements.
VHF:
Vertical Horizontal Filter (VHF) was created by Adam White to identify trending and ranging markets. VHF measures the level of trend activity, similar to ADX DI. Vertical Horizontal Filter does not, itself, generate trading signals, but determines whether signals are taken from trend or momentum indicators. Using this trend information, one is then able to derive an average cycle length.
Linear Regression Curve:
A line that best fits the prices specified over a user-defined time period.
This is very good to eliminate bad crosses of KAMA and the pric.
Usage
You can use this indicator on every timeframe I think. I mostly tested it on 1 min, 5 min and 15 min.
Signals
Enter Long -> crossover(close, kama) and crossover(kama, kama )
Enter Short -> crossunder(close, kama) and crossunder(kama, kama )
Thanks for checking this out!
--
Credits to
▪️@cheatcountry – Hann Window Smoohing
▪️@loxx – VHF and T3
▪️@LucF – Gradient
Dynamic Linear Regression Oscillator | AdulariDescription:
This dynamic linear regression oscillator visualizes the general price trend of specific ranges in the chart based on the linear regression calculation, it automatically determines these ranges with pivot detection. The central line of the indicator is the baseline of the linear regression itself. This is a good tool to use to determine when a price is unusually far away from its baseline. The lines above or below it are overbought and oversold zones. These zones are based on the high or low of the range, in combination with the set multipliers.
The overbought and oversold lines indicate support and resistance; when the prices stay outside these levels for a significant period of time, a reversal can be expected soon. When the oscillator's value crosses above the signal or smoothed line the trend may become bullish. When it crosses below, the trend may become bearish.
This indicator is quite special, as it first determines price ranges using pivot detection. It then uses the middle of the range to determine how far the current price is from the baseline. This value is then rescaled compared to a set amount of bars back, putting it into relevant proportions with the current price action.
How do I use it?
Never use this indicator as standalone trading signal, it should be used as confluence.
When the value crosses above the signal this indicates the current bearish trend is getting weak and may reverse upwards.
When the value crosses below the signal this indicates the current bullish trend is getting weak and may reverse downwards.
When the value is above the middle line this shows the bullish trend is strong.
When the value is below the middle line this shows the bearish trend is strong.
When the value crosses above the upper line this indicates the trend may reverse downwards.
When the value crosses below the lower line this indicates the trend may reverse upwards.
Features:
Oscillator value indicating how far the price has currently deviated from the middle of the range. Proportioned to data from a set amount of bars ago.
Signal value to indicate whether or not the price is abnormally far from the middle of the range.
Horizontal lines such as oversold, overbought and middle lines, indicating possible reversal zones.
Automatic range detection using pivots.
Built-in rescaling functionality to ensure values are proportionate with the latest data.
How does it work? (simplified)
1 — Calculate the middle of the range.
2 — Define whether the current price is above the middle of the range or below.
3 — If above the middle of the range, calculate the difference of the current high and the middle line. If below, calculate the difference of the current low and the middle line.
4 — Smooth the value using a set moving average type.
5 — Rescale the value to proportionate it with the latest data.

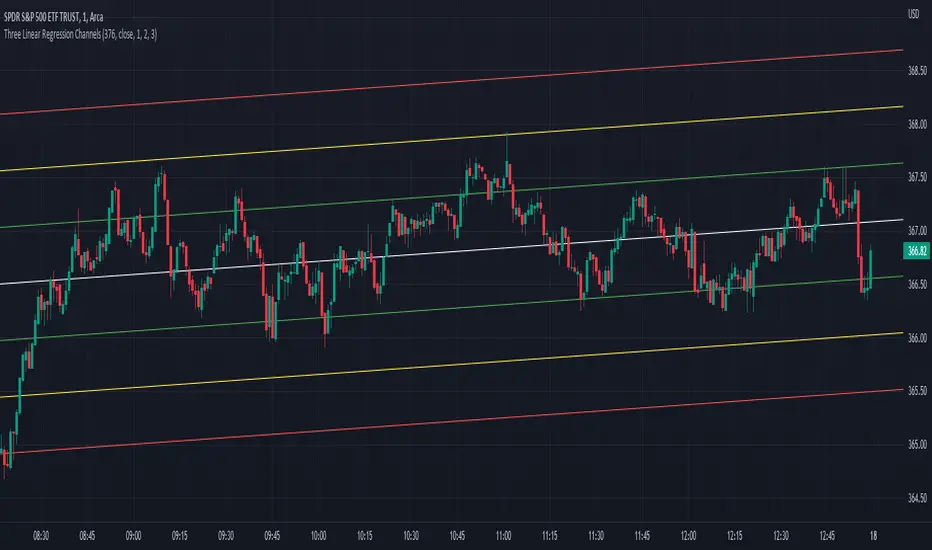
Three Linear Regression ChannelsPlot three linear regression channels using alexgrover 's Computing The Linear Regression Using The WMA And SMA indicator for the linear regression calculations.
Settings
Length : Number of inputs to be used
Source : Source input of the indicator
Midline Colour : The colour of the midline
Channel One, Two, and Three Multiplicative Factor : Multiplication factor for the RMSE, determine the distance between the upper and lower level
Channel One, Two, and Three Colour : The channel's lines colour
Usage
For usage details, please refer to alexgrover 's Computing The Linear Regression Using The WMA And SMA indicator.
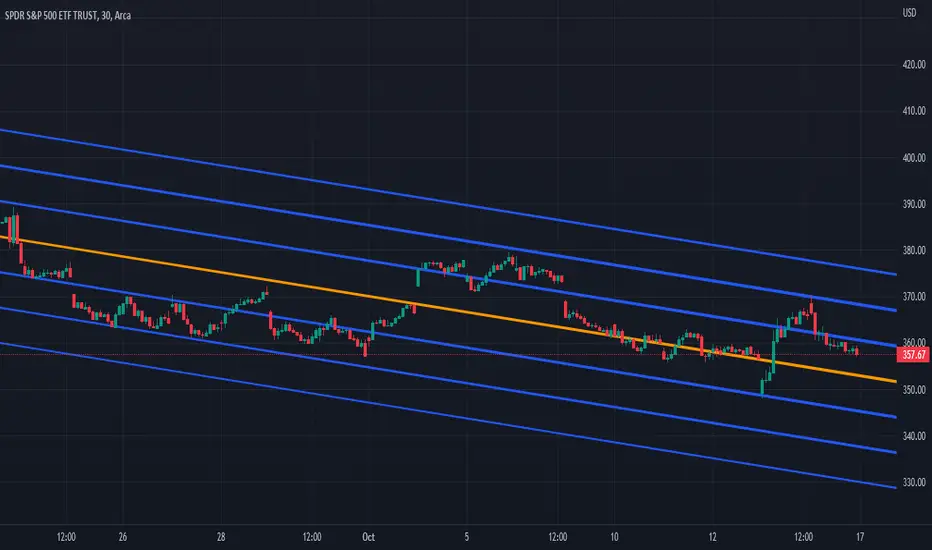
Multi-Optimized Linear Regression ChannelA take on alexgrover 's Optimized Linear Regression Channel script which allows users to apply multiple linear regression channel with unique multiplicative factors.
Multiplicative Factors
Adjust the amount of channels and multiplicative factors of existing or additional channels using the "Mults" input.
An input of "1" creates a single linear regression channel with the multiplicative factor of one.
An input of "4" creates a single linear regression channel with the multiplicative factor of four.
An input of "1,4" creates two linear regression channels with multiplicative factors of one and four.
An input of "1,2,3" creates three linear regression channels with multiplicative factors of one, two, and three.
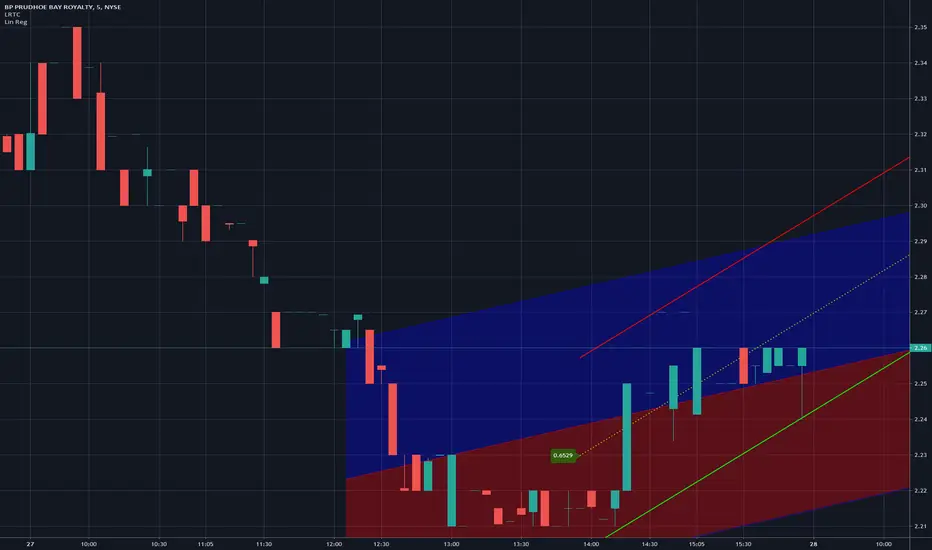
DB Change Forecast ProDB Change Forecast Pro
What does the indicator do?
The DB Change Forecast Pro is a unique indicator that uses price change on HLC3 to detect buy and sell periods along with plotting a linear regression price channel with oversold and undersold zones. It also has a linear regression change forecast mode to optionally project market direction.
Change is calculated by taking a two-bar change of HLC3 and dividing that by the price or, optionally, a fixed divisor.
A fast-moving change cloud is then calculated and displayed as the "regular version" plot (shown in light gray). When the cloud bottom is above low, a buy zone is detected. When the cloud top is below the high, a sell zone is detected.
The linear regression price channel is calculated similarly but using a much slower change rate. The linear regression price channel shows reasonable high, low and HLC3 ranges. At the bar's opening, the channel will be more compact and come fairly accurate about 1/4 into the bar timeframe.
The change forecasted price is projected on the right side of the current bar to indicate the current timeframe direction. Please note this forecasting feature is shown in orange when it's early in the timeframe and gray when the timeframe is more likely to produce an accurate direction forecast for the upcoming bar.
You can use these projected dashed lines to see possible market movements for the Current bar and possible market direction for the next bar. Kindly note these projects change; they should be used to understand possible extreme highs/lows for the current bar or market direction.
The indicator includes an optional change forecast projection feature hidden by default. It will project the market forecast channel with an offset of 1. The forecast is defaulted to an offset of 1 to show market direction. However, you can modify to zero the offset to show the current bar forecast and forecast history.
How should this indicator be used?
First, very important,
1. Settings > Set Symbol to Desired
2. Settings > Set High Timeframe to "Chart"
3. Settings > Ensure "Use price as divisor" is checked.
It's recommended to use this indicator in higher timeframes. Buy and sell signals are displayed in real-time. However, waiting until 1/4 to 1/2 into the current bar is recommended before taking action, and change can happen.
The buy/sell signals (zones) provide recommendations on playing a long vs. a short. When in a buy sone, only play longs. When in a sell zone, only play shorts.
Then use the linear regression price channel oversold and undersold zones to optionally open and close positions within the buy/sell zones.
For example, consider opening a long in a buy zone when the linear regression price channel shows undersold. Then consider closing the long when the price moves into the linear regression oversold or higher. Then repeat as long as it's in the buy zone. Then vice versa for sell zones and shorting.
At basic design, buy in the buy zone, sell or short in the sell zone. If you are up for higher trading frequencies, use the linear regression price channel as described in the example above.
Please note, as, with all indicators, you may need to adjust to fit the indicator to your symbol and desired timeframe.
This is only an example of use. Please use this indicator as your own risk and after doing your due diligence.
Does the indicator include any alerts?
Yes,
"DB CFHLC3: Signal BUY" - Is triggered when a buy signal is fired.
"DB CFHLC3: Signal SELL" - Is triggered when a sell signal is fired.
"DB CFHLC3: Zone BUY" - Is triggered when a buy zone is detected.
"DB CFHLC3: Zeon SELL" - Is triggered when a sell zone is detected.
"DB CFHLC3: Oversold SELL" - Is triggered when the price exceeds the oversold level.
"DB CFHLC3: Undersold BUY" - Is triggered when the price goes below the undersold level.
Any other tips?
Once you have configured the indicator for your symbol and chart timeframe. Meaning the plots are displayed over the price. Check out larger timeframes such as W, 2W, 3W, 4W, M, and 4M. It works wonderfully for showing market lows and highs for long-term investing too!
Another, tip is to combine it with your favorite indicator, such as TTM Squeeze or MACD for confirmation purposes. You may be surprised how fast the indicator shows market direction changes on higher timeframes.
You can just as easily use a high timeframe such as D, 2D, or 3D for day trading due to how the linear price channel works.
Why am I not selling this indicator?
I would like to bless the TradingView community, and I enjoy publishing custom indicators.
If you enjoy this indicator, please consider leaving a thumbs up or a comment for others to know about your experience or recommendations.
Enjoy!
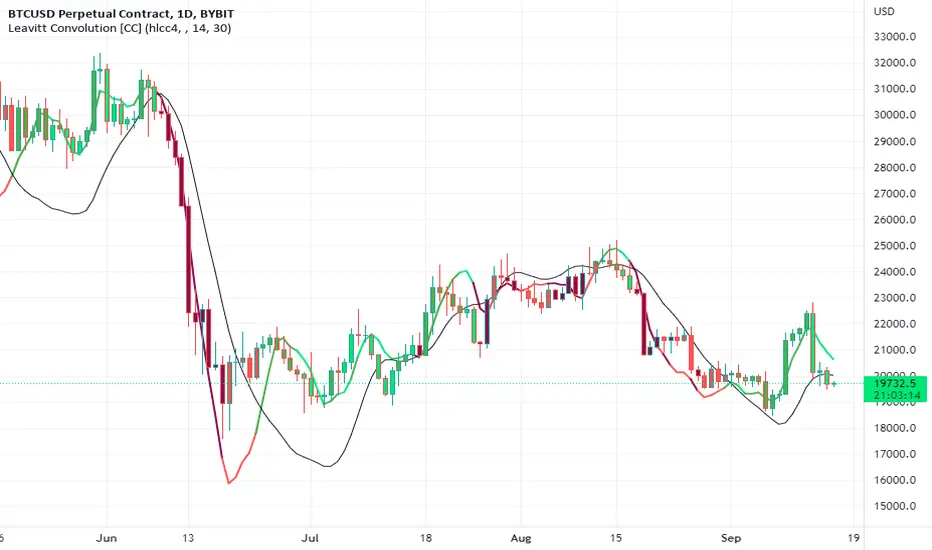
Leavitt Convolution [CC]The Leavitt Convolution indicator was created by Jay Leavitt (Stocks and Commodities Oct 2019, page 11), who is most well known for creating the Volume-Weighted Average Price indicator. This indicator is very similar to my Leavitt Projection script and I forgot to mention that both of these indicators are actually predictive moving averages. The Leavitt Convolution indicator doubles down on this idea by creating a prediction of the Leavitt Projection which is another prediction for the next bar. Obviously this means that it isn't always correct in its predictions but it does a very good job at predicting big trend changes before they happen. The recommended strategy for how to trade with these indicators is to plot a fast version and a slow version and go long when the fast version crosses over the slow version or to go short when the fast version crosses under the slow version. I have color coded the lines to turn light green for a normal buy signal or dark green for a strong buy signal and light red for a normal sell signal, and dark red for a strong sell signal.
This is another indicator in a series that I'm publishing to fulfill a special request from @ashok1961 so let me know if you ever have any special requests for me.
RSI + MA, LinReg, ZZ (HH HL LH LL), Div, Ichi, MACD and TSI HistRelative Strength Index with Moving Average, Linear Regression, Zig Zag (Highs and Lows), Divergence, Ichimoku Cloud, Moving Average Convergence Divergence and True Strength Index Histogram
This script is based on zdmre's RSI script, I revamped a lot of things and added a few indicators from ParkF's RSI script.
Disable Labels in the Style tab and the histogram if you don't enlarge the indicator and it seems too small.
Look to buy in the oversold area and bounce of the support of the linear regression.
Look to sell in the overbought area and bounce of the resistance of the linear regression.
Look for retracement to the moving average or horizontal lines, and divergences for potential reversal.
RSI
The Relative Strength Index (RSI) is a well versed momentum based oscillator which is used to measure the speed (velocity) as well as the change (magnitude) of directional price movements.
Moving Average
Moving Average (MA) is a good way to gauge momentum as well as to confirm trends, and define areas of support and resistance.
Linear Regression
The Linear Regression indicator visualizes the general price trend of a specific part of the chart based on the Linear Regression calculation.
Zig Zag (Highs and Lows)
The Zig Zag indicator is used to identify price trends, and in doing so plots points on the chart to mark whenever prices reverse by a larger percentage point than a predetermined variable or marker.
Divergence
The divergence indicator warns traders and technical analysts of changes in a price trend, oftentimes that it is weakening or changing direction.
Ichimoku Cloud
The Ichimoku Cloud is a package of multiple technical indicators that signal support, resistance, market trend, and market momentum.
MACD and TSI Histogram
MACD can be used to identify aspects of a security's overall trend.
The True Strength Index indicator is a momentum oscillator designed to detect, confirm or visualize the strength of a trend.

Relative Andean ScalpingThis is an experimental signal providing script for scalper that uses 2 of open source indicators.
First one provides the signals for us called Andean Oscillator by @alexgrover . We use it to create long signals when bull line crosses over signal line while being above the bear line. And reverse is true for shorts where bear line crosses over signal line while being above bull line.
Second one is used for filtering out low volatility areas thanks to great idea by @HeWhoMustNotBeNamed called Relative Bandwidth Filter . We use it to filter out signals and create signals only when the Relative Bandwith Line below middle line.
The default values for both indicators changed a bit, especially used linreg values to create relatively better signals. These can be changed in settings. Please be aware that i did not do extensive testing with this indicator in different market conditions so it should be used with caution.

Linear Regression ChannelsThese channels are generated from the current values of the linear regression channel indicator, the standard deviation is calculated based off of the RSI . This indicator gives an idea of when the linear regression model predicts a change in direction.
You are able to change the length of the linear regression model, as well as the size of the zone. A negative zone size will make the zone stretch away from the center, and a positive zone size will make it stretch towards the centerline.

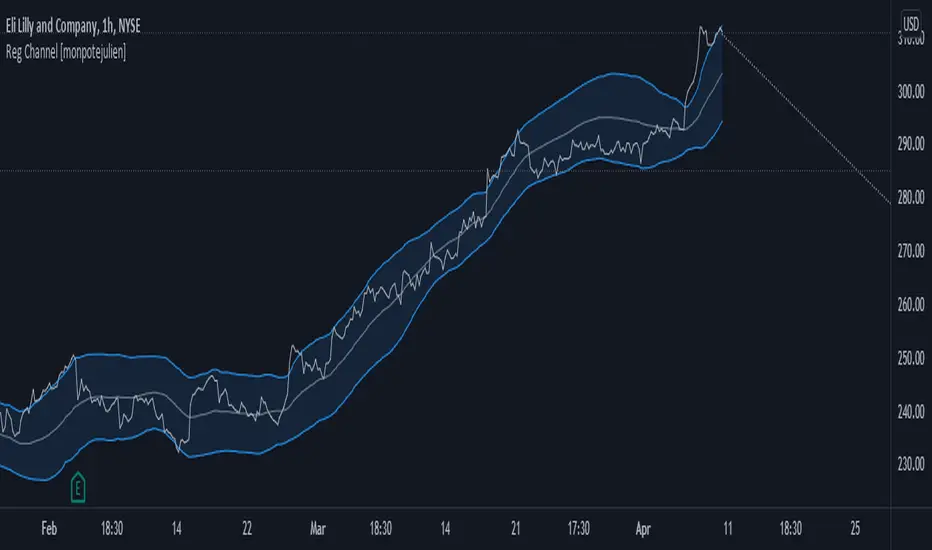
Regression Channel with projectionEXPERIMENTAL:
Auto adjusting regressive channel with projection.
Linear regression is a linear approach to modeling the relationship between a dependent variable and one or more independent variables.
In linear regression , the relationships are modeled using linear predictor functions whose unknown model parameters are estimated from the data.
Disclaimer :
Success in trading is all about following your trading strategy and indicators should fit into your own strategy, and not be traded purely on.
This script is for informational and educational purposes only. Use of the script does not constitute professional and / or financial advice. You are solely responsible for evaluating the outcome of the script and the risks associated with using the script. In exchange for the use of the script, you agree not to hold monpotejulien TradingView user responsible for any possible claims for damages arising out of any decisions you make based on the use of the script.
Relative slopeRelative slope metric
Description:
I was in need to create a simple, naive and elegant metric that was able to tell how strong is the trend in a given rolling window. While abstaining from using more complicated and arguably more precise approaches, I’ve decided to use Linearly Weighted Linear Regression slope for this goal. Outright values are useful, but the problem was that I wasn’t able to use it in comparative analysis, i.e between different assets & different resolutions & different window sizes, because obviously the outputs are scale-variant.
Here is the asset-agnostic, resolution-agnostic and window size agnostic version of the metric.
I made it asset agnostic & resolution agnostic by including spread information to the formula. In our case it's weighted stdev over differenced data (otherwise we contaminate the spread with the trend info). And I made it window size agnostic by adding a non-linear relation of length to the output, so finally it will be aprox in (-1, 1) interval, by taking square root of length, nothing fancy. All these / 2 and * 2 in unexpected places all around the formula help us to return the data to it’s natural scale while keeping the transformations in place.
Peace TV
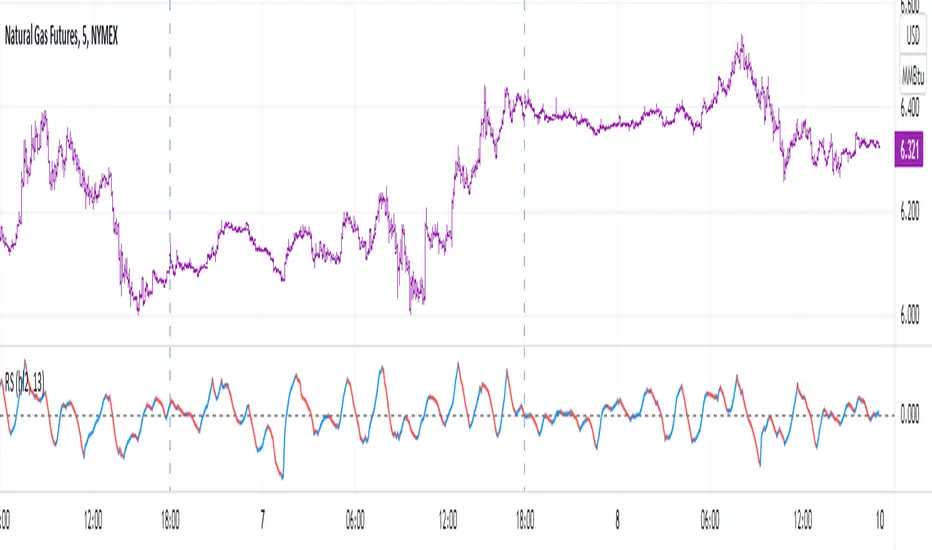
StrengthA mathematically elegant, native & modern way how to measure velocity/ strength/ momentum. As you can see it looks like MACD, but !suddenly! has N times shorter code (disregard the functions), and only 1 parameter instead of 3. OMG HOW DID HE DO IT?!?
MACD: "Let's take one filter (1 parameter), than another filter (2 parameters), then let's take dem difference, then let's place another filter over the difference (3rd parameter + introduction of a nested calculation), and let's write a whole book about it, make thousands of multi-hours YouTube videos about it, and let's never mention about the amount of uncertainty being introduced by multiple parameters & introduction of the nested calculation."
Strength: "let's get real, let's drop a weighted linear regression & usual linear regression over the data of the same length, take dem slopes, then make the difference over these slopes, all good. And then share it with people w/o putting an ® sign".
Fyi, regressions were introduced centuries ago, maybe decades idk, the point is long time ago, and computational power enough to calculate what I'm saying is slightly more than required for macd.
Rationale.
Linearly weighted linear regression has steeper slope (W) than the usual linear regression slope (S) due to the fact that the recent datapoints got more weight. This alone is enough of a metric to measure velocity. But still I've recalled macd and decided to make smth like it cuz I knew it'll might make you happy. I realized that S can be used instead of smoothing the W, thus eliminating the nested calculation and keeping entropy & info loss in place. And see, what we get is natural, simple, makes sense and brings flex. I also wanna remind you that by applying regression we maximize the info gain by using all the data in the window, instead of taking difference between the first and the last datapoints.
This script is dedicated to my friend Fabien. Man, you were the light in the darkness in that company. You'll get your alien green Lambo if you'll really want it, no doubts on my side bout that.
Good hunting

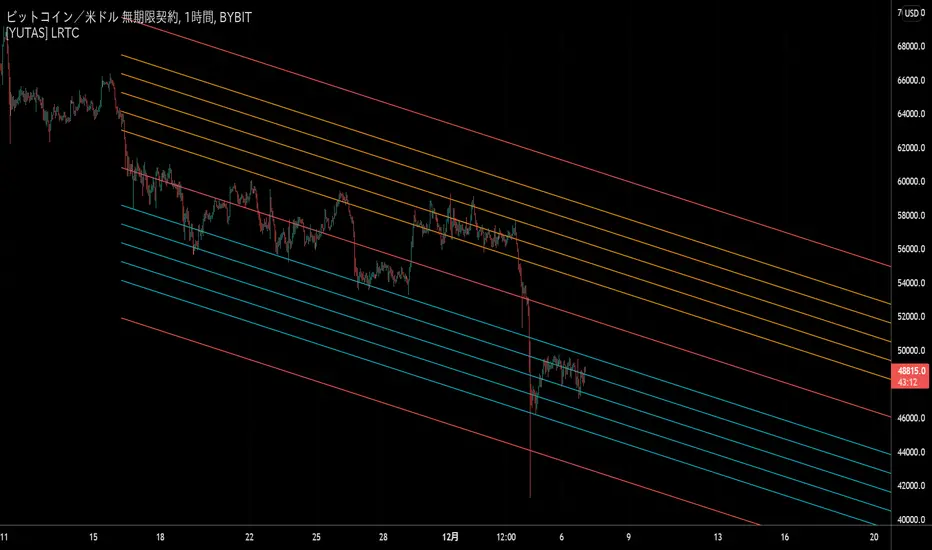
[YUTAS] Linear Regression Trend Channel
・Indicator for linear regression channel.
・Multiple deviations can be displayed.
・The color changes by reading the angle of the center line according to the direction of the market.
Rising market → blue
Down market → Red
----------------------------------------------
・線形回帰チャネルのインジケーター。
・偏差を複数表示可能。
・相場の向きに合わせてセンターラインの角度を読み取り色が変わります。
上げ相場 → 青
下げ相場 → 赤
Linear Regression & RSI Multi-Function Screener with Table-LabelHi fellow traders..
Happy to share a Linear Regression & RSI Multi-Function Custom Screener with Table-Labels...
The Screener scans for Linear Regression 2-SD Breakouts and RSI OB/OS levels for the coded tickers and gives Summary alerts
Uses Tables (dynamica resizing) for the scanner output instead of standard labels!
This Screener cum indicator collection has two distinct objectives..
1. Attempt re-entry into trending trades.
2. Attempt Counter trend trades using linear regression , RSI and Zigzag.
Briefly about the Screener functions..
a. It uses TABLES as Labels a FIRST for any Screener on TV.
b. Tables dynamically resize based on criteria..
c. Alerts for breakouts of the UPPER and the LOWER regression channels.(2 SD)
d. In addition to LinReg it also Screens RSI for OB/OS levels so a multifunction Screener.
e. Of course has the standard summary Alerts and programmable format for Custom functions.
f. Uses only the inbuilt Auto Fib and Lin Reg code for the screener.(No proprietary stuff)
g. The auto Zigzag code is derived(Auto fib).
Question what are all these doing in a single screener ??
ZigZag is very useful in determining Trend Up or Down from one Pivot to another.
So Once you have a firm view of the Current Trend for your chosen timeframe and ticker…
We can consider few possible trading scenarios..
a. Re-entry in an Up Trend - Combination of OS Rsi And a Lower Channel breach followed by a re-entry back into the regression channel CAN be used as an effective re-entry.
b. Similarily one can join a Down Trend on OB Rsi and Upper Channel line breach followed by re-entry into the regression channel.
If ZigZag signals a range-bound market, bound within channel lines then the Upper breakout can be used to Sell and vice-versa!
In short many possibilities for using these functions together with Scanner and Alerts.
This facilitates timely PROFITABLE Trending and Counter trend opportunities across multiple tickers.
You must give a thorough READ to the various available tutorials on ZigZag / Regression and Fib retracements before attempting counter trend trades using these tools!!
A small TIP – Markets are sideways or consolidating 70% of the time!!
Acknowledgements: - Thanks a lot DGTRD for the Auto ZigZag code and also for the eagerness to help wherever possible..Respect!!
Disclaimer: The Alerts and Screener are just few tools among many and not any kind of Buy/Sell recommendations. Unless you have sufficient trading experience please consult a Financial advisor before investing real money.
*The alerts are set for crossovers however for viewing tickers trading above or below the channel use code in line 343 and 344 after setting up the Alerts!
** RSI alerts are disabled by default to avoid clutter, but if needed one can activate code lines 441,442,444 and 445
Wish you all, Happy Profitable Trading!

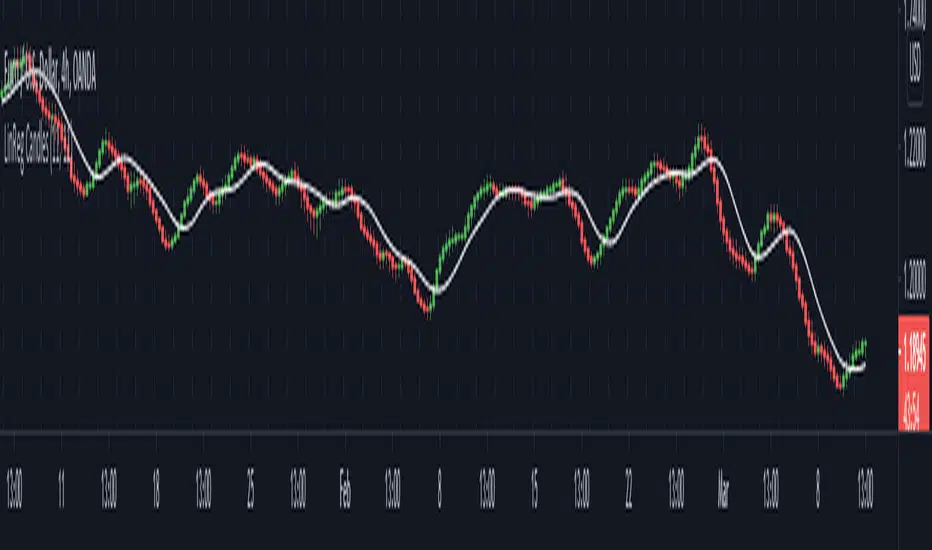
Linear Regression CandlesThere are many linear regression indicators out there, most of them draw lines or channels, but this one actually draws a chart.
Linear Regression ChannelHello Traders,
There are several nice Linear Regression Channel scripts in the Public Library. and I tried to make one with some extra features too. This one can check if the Price breaks the channel and it shows where is was broken. Also it checks the momentum of the channel and shows it's increasing/decreasing/equal in a label, shape of the label also changes. The line colors change according to direction.
using the options, you can;
- Set the Source (Close, HL2 etc)
- Set the Channel length
- Set Deviation
- Change Up/Down Line colors
- Show/hide broken channels
- Change line width
meaning of arrows:
⇑ : Uptrend and moment incresing
⇗ : Uptrend and moment decreasing
⇓ : Downtrend and moment incresing
⇘ : Downtrend and moment decreasing
⇒ : No trend
An example for how color of lines, arrow direction and shape of label change.
Enjoy!

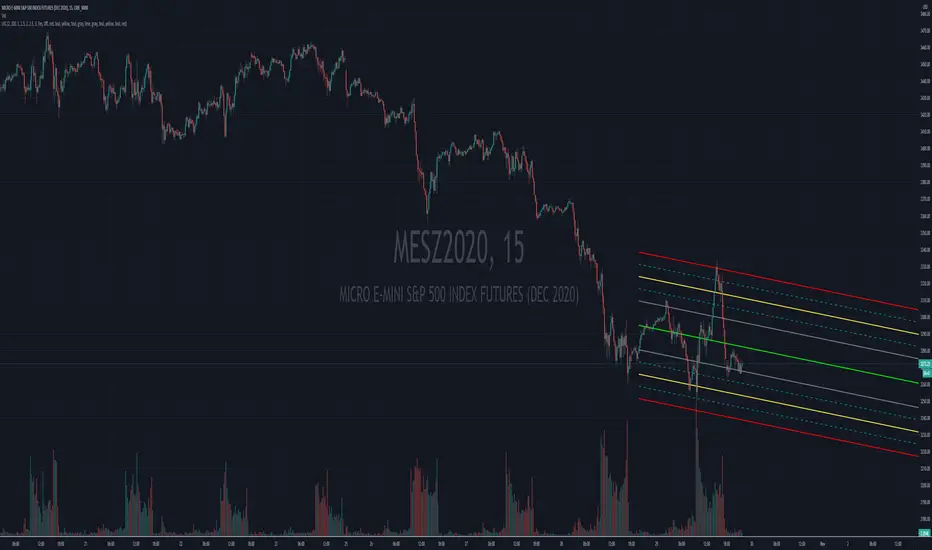
Auto Linear Regression ChannelA Linear Regression Channel gives more objective potential buy and sell signals based on price volatility. It consists of three parts:
Linear Regression Line: A Linear Regression Line is a straight line that best fits the prices between a starting price point and an ending price point. A "best fit" means that a line is constructed where there is the least amount of space between the price points and the actual Linear Regression Line. The Linear Regression Line is mainly used to determine trend direction.
Traders usually view the Linear Regression Line as the fair value price for the stocks. When prices deviate above or below, traders may expect prices to go back towards the Linear Regression Line. As a consequence, when prices are below the Linear Regression Line, this could be viewed by some traders as a good time to buy, and when prices are above the Linear Regression Line, a trader might sell. Of course other technical indicators would be used to confirm these inexact buy and sell signals.
Upper Channel Line: A line that runs parallel to the Linear Regression Line and is usually one to two standard deviations above the Linear Regression Line.
Lower Channel Line: This line runs parallel to the Linear Regression Line and is usually one to two standard deviations below the Linear Regression Line.
The upper and lower channel lines contain between themselves either 68% of all prices (if 1 standard deviation is used) or 95% of all prices (if 2 standard deviations are used). When prices break outside of the channels, either: Buy or sell opportunities are present. Or the prior trend could be ending.
Linear Regression Channel Possible Buy Signal
When price falls below the lower channel line, and a trader expects a continuation of the trend, then a trader might consider it as a buy signal.
Linear Regression Channel Possible Sell Signal
An opportunity for selling might occur when prices break above the upper channel line, but a continuation of the trend is expected by the trader. Other confirmation signs like prices closing back inside the linear regression channel might be used to initiate potential buy or sell orders. Also, other technical indicators might be used to confirm.
Trend Reversals
When price closes outside of the Linear Regression Channel for long periods of time, this is often interpreted as an early signal that the past price trend may be breaking and a significant reversal might be near. Linear Regression Channels are quite useful technical analysis charting tools. In addition to identifying trends and trend direction, the use of standard deviation gives traders ideas as to when prices are becoming overbought or oversold relative to the long term trend.
Default Parameters:
Period: (100) The number of bars to use in the calculation.
This Linear Regression Channel Has 1st, 2nd, and 3rd Deviation lines also the MId Deviation Lines are added for 1.5 and 2.5 area.
Trend Lines ProHello Traders!
We need to make things better & better to solve the puzzle and I try to do my best on this way. now I am here with my new Trend Lines Pro script.
As you know, Trend Lines is very subjective and many people (even professionals) draw different Trend Lines on the same chart. This is confusing and there must be an automation to make the life easer. with this tool I tried to automate it.
The idea in this script is different from my previous trend lines scripts. In this, I use channel idea so it can check number of pivot points it contains, it checks H/L/C in the channels as well. it also checks the angle while choosing trend lines. then we get stronger and useful Trend Lines automatically.
There are some option in the script, let see one by one:
Pivot Period: The Length to calculate Pivot Highs/Lows
Source : Option to use "High/Low" or "Close" as the source for Pivot Points
Threshold Rate : This rate is used for channel width. it you give bigger numbers then you get bigger channels. it's 4 by default
Minimum Angle Rate for new Trendline: if there are different trend lines, there must be an angle between them to choose best trend lines. you can set the angle with this option.
Minimum Strength: there can be many trend lines but we need to choose/use stronger ones. with this option you can set the number of pivot points a trend channel have to contains.
Maximum Loopback Length: by default the script can check 40 pivot highs and 40 pivot lows but to make the script faster and useful I needed to add a limitation for the number of bars that the script can go back.
Show Trendlines as: you can see trend lines as "Trendline", "Channel", "Trend Channel". you can see examples below.
Enable Weak Trend Lines: if there is no trend lines strong enough (as defined in "Minimum Strength" option) you have option to see a weak trend line. that is useful sometimes. if you enable this option weak lines are shown as dotted lines.
Show Price Labels on Trendlines: the script can show the price levels to break trend lines. the examples are below
Line Style: trend lines can be Solid or Dashed as you wish
Color theme: colors of the Up/Down Trend lines can be set. 'Red', Lime, Blue, White, Black, Olive, Gray
you can see the Trend Lines as channels:
you can see Trend Channels to see the big picture.also there is dotted trend line as weak trend line defined above.
you can set color/width of trend lines as you wish.
the script is fast enough to run on 1sec chart:
you can use this script on any chart, fx pairs, stocks, indices etc
I made a short video to explain how to use it and some options:
Please PM for access.
Enjoy!
DISCLAIMER: No sharing, copying, reselling, modifying, or any other forms of use are authorized for our documents, script / strategy, and the information published with them. This informational planning script / strategy is strictly for individual use and educational purposes only. This is not financial or investment advice. Investments are always made at your own risk and are based on your personal judgement. I am not responsible for any losses you may incur. Please invest wisely.
Bezahltes Script

Auto Trend Channel [Anan]Hello Friends..
This is Auto Trend Channel using linear regression ,,
So helpful and smart !
Play with the options to adjust the precision.
*Note that the selected time frame in options must be > your current time frame (logic) to draw lines.

Linear Regression Trend ChannelThis is my first public release of indicator code and my PSv4.0 version of "Linear Regression Channel", as it is more commonly known. It replicates TV's built-in "Linear Regression" without the distraction of heavy red/blue fill bleeding into other indicators. We can't fill() line.new() at this time in Pine Script anyways. I entitled it Linear Regression Trend Channel, simply because it seems more accurate as a proper description. I nicely packaged this to the size of an ordinary napkin within 20 lines of compact code, simplifying the math to the most efficient script I could devise that fits in your pocket. This is commonly what my dense intricate code looks like behind the veil, and if you are wondering why there is no notes, that's because the notation is in the variable naming. I excluded Pearson correlation because it doesn't seem very useful to me, and it would comprise of additional lines of code I would rather avoid in this public release. Pearson correlation is included in my invite-only advanced version of "Enhanced Linear Regression Trend Channel", where I have taken Linear Regression Channeling to another level of fully featured novel attainability using this original source code.
Features List Includes:
"Period" adjustment
"Deviation(s)" adjustment
"Extend Method" option to extend or not extend the upper, medial, and lower channeling
Showcased in the chart below is my free to use "Enhanced Schaff Trend Cycle Indicator", having a common appeal to TV users frequently. If you do have any questions or comments regarding this indicator, I will consider your inquiries, thoughts, and ideas presented below in the comments section, when time provides it. As always, "Like" it if you simply just like it with a proper thumbs up, and also return to my scripts list occasionally for additional postings. Have a profitable future everyone!