Cross-Asset Correlation Trend IndicatorCross-Asset Correlation Trend Indicator
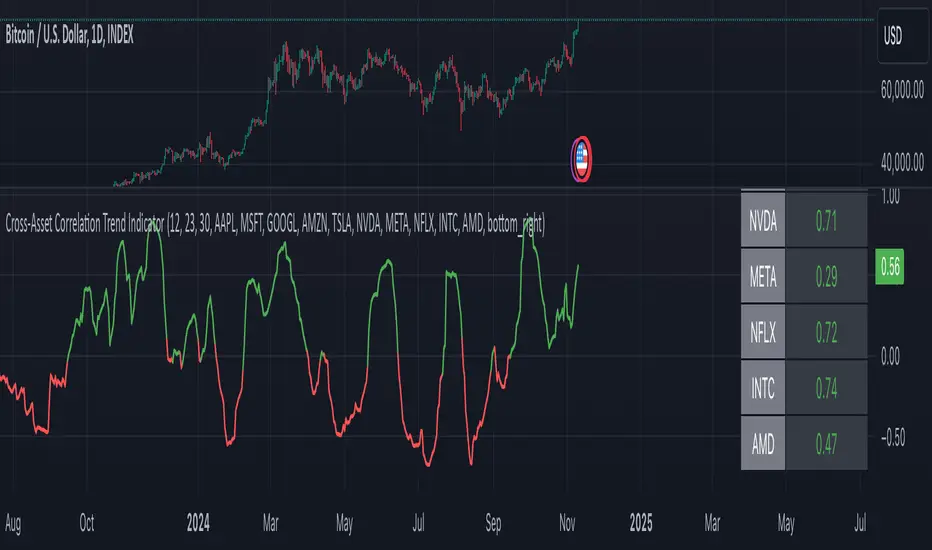
This indicator uses correlations between the charted asset and ten others to calculate an overall trend prediction. Each ticker is configurable, and by analyzing the trend of each asset, the indicator predicts an average trend for the main asset on the chart. The strength of each asset's trend is weighted by its correlation to the charted asset, resulting in a single average trend signal. This can be a rather robust and effective signal, though it is often slow.
Functionality Overview :
The Cross-Asset Correlation Trend Indicator calculates the average trend of a charted asset based on the correlation and trend of up to ten other assets. Each asset is assigned a trend signal using a simple EMA crossover method (two customizable EMAs). If the shorter EMA crosses above the longer one, the asset trend is marked as positive; if it crosses below, the trend is negative. Each trend is then weighted by the correlation coefficient between that asset’s closing price and the charted asset’s closing price. The final output is an average weighted trend signal, which combines each trend with its respective correlation weight.
Input Parameters :
EMA 1 Length : Sets the period of the shorter EMA used to determine trends.
EMA 2 Length : Sets the period of the longer EMA used to determine trends.
Correlation Length : Defines the lookback period used for calculating the correlation between the charted asset and each of the other selected assets.
Asset Tickers : Each of the ten tickers is configurable, allowing you to set specific assets to analyze correlations with the charted asset.
Show Trend Table : Toggle to show or hide a table with each asset’s weighted trend. The table displays green, red, or white text for each weighted trend, indicating positive, negative, or neutral trends, respectively.
Table Position : Choose the position of the trend table on the chart.
Recommended Use :
As always, it’s essential to backtest the indicator thoroughly on your chosen asset and timeframe to ensure it aligns with your strategy. Feel free to modify the input parameters as needed—while the defaults work well for me, they may need adjustment to better suit your assets, timeframes, and trading style.
As always, I wish you the best of luck and immense fortune as you develop your systems. May this indicator help you make well-informed, profitable decisions!
Investing
Trend Titan Neutronstar [QuantraSystems]Trend Titan NEUTRONSTAR
Credits
The Trend Titan NEUTRONSTAR is a comprehensive aggregation of nearly 100 unique indicators and custom combinations, primarily developed from unique and public domain code.
We'd like to thank our TradingView community members: @IkKeOmar for allowing us to add his well-built "Normalized KAMA Oscillator" and "Adaptive Trend Lines " indicators to the aggregation, as well as @DojiEmoji for his valuable "Drift Study (Inspired by Monte Carlo Simulations with BM)".
Introduction
The Trend Titan NEUTRONSTAR is a robust trend following algorithm meticulously crafted to meet the demands of crypto investors. Designed with a multi layered aggregation approach, NEUTRONSTAR excels in navigating the unique volatility and rapid shifts of the cryptocurrency market. By stacking and refining a variety of carefully selected indicators, it combines their individual strengths while reducing the impact of noise or false signals. This "aggregation of aggregators" approach enables NEUTRONSTAR to produce a consistently reliable trend signal across assets and timeframes, making it an exceptional tool for investors focused on medium to long term market positioning.
NEUTRONSTAR ’s powerful trend following capabilities provide investors with straightforward, data driven analysis. It signals when tokens exhibit sustained upward momentum and systematically removes allocations from assets showing signs of weakness. This structure aids investors in recognizing peak market phases. In fact, one of NEUTRONSTAR ’s most valuable applications is its potential to help investors time exits near the peak of bull markets. This aims to maximize gains while mitigating exposure to downturns.
Ultimately, NEUTRONSTAR equips investors with a high precision, adaptable framework for strategic decision making. It offers robust support to identify strong trends, manage risk, and navigate the dynamic crypto market landscape.
With over a year of rigorous forward testing and live trading, NEUTRONSTAR demonstrates remarkable robustness and effectiveness, maintaining its performance without succumbing to overfitting. The system has been purposefully designed to avoid unnecessary optimization to past data, ensuring it can adapt as market conditions evolve. By focusing on aggregating valuable trend signals rather than tuning to historical performance, the NEUTRONSTAR serves as a reliable universal trend following system that aligns with the natural market cycles of growth and correction.
Core Methodology
The foundation of the NEUTRONSTAR lies in its multi aggregated structure, where five custom developed trend models are combined to capture the dominant market direction. Each of these aggregates has been carefully crafted with a specific trend signaling period in mind, allowing it to adapt seamlessly across various timeframes and asset classes. Here’s a breakdown of the key components:
FLARE - The original Quantra Signaling Matrix (QSM) model, best suited for timeframes above 12 hours. It forms the foundation of long term trend detection, providing stable signals.
FLAREV2 - A refined and more sophisticated model that performs well across both high and low timeframes, adding a layer of adaptability to the system.
NEBULA - An advanced model combining FLARE and FLAREV2. NEBULA brings the advantages of both components together, enhancing reliability and capturing smoother, more accurate trends.
SPARK - A high speed trend aggregator based on the QSM Universal model. It focuses on fast moving trends, providing early signals of potential shifts.
SUNBURST - A balanced aggregate that combines elements of SPARK and FLARE, confirming SPARK’s signals while minimizing false positives.
Each of these models contributes its own unique perspective on market movement. By layering fast, medium, and slower trend following signals, NEUTRONSTAR can confirm strong trends while filtering out shorter term noise. The result is a comprehensive tool that signals clear market direction with minimized false signals.
A Unique Approach to Trend Aggregation
One of the defining characteristics of NEUTRONSTAR is its deliberate choice to avoid perfectly time coherent indicators within its aggregation. In simpler terms, NEUTRONSTAR purposefully incorporates trend following indicators with slightly different signal periods, rather than synchronizing all components to a single signaling period. This choice brings significant benefits in terms of diversification, adaptability, and robustness of the overall trend signal.
When aggregating multiple trend following components, if all indicators were perfectly time coherent - meaning they responded to market changes in exactly the same way and over the time periods - the resulting signal would effectively be no different from a single trend following indicator. This uniformity would limit the system’s ability to capture a variety of market conditions, leaving it vulnerable to the same noise or false signals that any single indicator might encounter. Instead, NEUTRONSTAR leverages a balanced mix of indicators with varied timing: some fast, some slower, and some in the medium range. This choice allows the system to extract the unique strengths of each component, creating a combined signal that is stronger and more reliable than any single indicator.
By incorporating different signal periods, NEUTRONSTAR achieves what can be thought of as a form of edge accumulation. The fast components within NEUTRONSTAR , for example, are highly sensitive to quick shifts in market direction. These indicators excel at identifying early trend signals, enabling NEUTRONSTAR to react swiftly to emerging momentum. However, these fast indicators alone would be prone to reacting to market noise, potentially generating too many premature signals. This is where the medium term indicators come into play. These components operate with a slower reaction time, filtering out the short term fluctuations and confirming the direction of the trend established by the faster indicators. The combination of these varying signal speeds results in a balanced, adaptive response to market changes.
This approach also allows NEUTRONSTAR to adapt to different market regimes seamlessly. In fast moving, volatile markets, the faster indicators provide an early alert to potential trend shifts, while the slower components offer a stabilizing influence, preventing overreaction to temporary noise. Conversely, in steadier or trending markets, the medium and slower indicators sustain the trend signal, reducing the likelihood of premature exits. This flexible design enhances NEUTRONSTAR ’s ability to operate effectively across multiple asset classes and timeframes, from short term fluctuations to longer term market cycles.
The result is a powerful, multi-layered trend following tool that remains adaptive, capturing the benefits of both fast and medium paced reactions without becoming overly sensitive to short term noise. This unique aggregation methodology also supports NEUTRONSTAR ’s robustness, reducing the risk of overfitting to historical data and ensuring that the system can perform reliably in forward testing and live trading environments. The slightly staggered signal periods provide a greater degree of resilience, making NEUTRONSTAR a dependable choice for traders looking to capitalize on sustained trends while minimizing exposure during periods of market uncertainty.
In summary, the lack of perfect time coherence among NEUTRONSTAR ’s sub components is not a flaw - but a deliberate, robust design choice.
Risk Management through Market Mode Analysis
An essential part of NEUTRONSTAR is its ability to assess the market's underlying behavior and adapt accordingly. It employs a Market Mode Analysis mechanism that identifies when the market is either in a “Trending State” or a “Mean Reverting State.” When enough confidence is established that the market is trending, the system confirms and signals a “Trending State,” which is optimal for maintaining positions in the direction of the trend. Conversely, if there’s insufficient confidence, it labels the market as “Mean Reverting,” alerting traders to potentially avoid trend trades during likely sideways movement.
This distinction is particularly valuable in crypto, where asset prices often oscillate between aggressive trends and consolidation periods. The Market Mode Analysis keeps traders aligned with the broader market conditions, minimizing exposure during periods of potential whipsaws and maximizing gains during sustained trends.
Zero Overfitting: Design and Testing for Real World Resilience
Unlike many trend following indicators that rely heavily on backtesting and optimization, NEUTRONSTAR was built to perform well in forward testing and live trading without post design adjustments. Over a year of live market exposure has all but proven its robustness, with the system’s methodology focused on universal applicability and simplicity rather than curve fitting to past data. This approach ensures the aggregator remains effective across different market cycles and maintains relevance as new data unfolds.
By avoiding overfitting, NEUTRONSTAR is inherently more resistant to the common issue of strategy degradation over time, making it a valuable tool for traders seeking reliable market analysis you can trust for the long term.
Settings and Customization Options
To accommodate a range of trading styles and market conditions, NEUTRONSTAR includes adjustable settings that allow for fine tuning sensitivity and signal generation:
Calculation Method - Users can choose between calculating the NEUTRONSTAR score based on aggregated scores or by using the state of individual aggregates (long, neutral, short). The score method provides faster signals with slightly more noise, while the state based approach offers a smoother signal.
Sensitivity Threshold - This setting adjusts the system’s sensitivity, defining the width of the neutral zone. Higher thresholds reduce sensitivity, allowing for a broader range of volatility before triggering a trend reversal.
Market Regime Sensitivity - A sensitivity adjustment, ranging from 0 to 100, that affects the sensitivity of the sub components in market regime calculation.
These settings offer flexibility for users to tailor NEUTRONSTAR to their specific needs, whether for medium term investment strategies or shorter term trading setups.
Visualization and Legend
For intuitive usability, NEUTRONSTAR uses color coded bar overlays to indicate trend direction:
Green - indicates an uptrend.
Gray - signals a neutral or transition phase.
Purple - denotes a downtrend.
An optional background color can be enabled for market mode visualization, indicating the overall market state as either trending or mean reverting. This feature allows traders to assess trend direction and strength at a glance, simplifying decision making.
Additional Metrics Table
To support strategic decision making, NEUTRONSTAR includes an additional metrics table for in depth analysis:
Performance Ratios - Sharpe, Sortino, and Omega ratios assess the asset’s risk adjusted returns.
Volatility Insights - Provides an average volatility measure, valuable for understanding market stability.
Beta Measurement - Calculates asset beta against BTC, offering insight into asset volatility in the context of the broader market.
These metrics provide deeper insights into individual asset behavior, supporting more informed trend based allocations. The table is fully customizable, allowing traders to adjust the position and size for a seamless integration into their workspace.
Final Summary
The Trend Titan NEUTRONSTAR indicator is a powerful and resilient trend following system for crypto markets, built with a unique aggregation of high performance models to deliver dependable, noise reduced trend signals. Its robust design, free from overfitting, ensures adaptability across various assets and timeframes. With customizable sensitivity settings, intuitive color coded visualization, and an advanced risk metrics table, NEUTRONSTAR provides traders with a comprehensive tool for identifying and riding profitable trends, while safeguarding capital during unfavorable market phases.

Universal Trend and Valuation System [QuantAlgo]Universal Trend and Valuation System 📊🧬
The Universal Trend and Valuation System by QuantAlgo is an advanced indicator designed to assess asset valuation and trends across various timeframes and asset classes. This system integrates multiple advanced statistical indicators and techniques with Z-score calculations to help traders and investors identify overbought/sell and oversold/buy signals. By evaluating valuation and trend strength together, this tool empowers users to make data-driven decisions, whether they aim to follow trends, accumulate long-term positions, or identify turning points in mean-reverting markets.
💫 Conceptual Foundation and Innovation
The Universal Trend and Valuation System by QuantAlgo provides a unique framework for assessing market valuation and trend dynamics through a blend of Z-score analysis and trend-following algorithm. Unlike traditional indicators that only reflect price direction, this system incorporates multi-layered data to reveal the relative value of an asset, helping users determine whether it’s overvalued, undervalued, or approaching a trend reversal. By combining high quality trend-following tools, such as Dynamic Score Supertrend, DEMA RSI, and EWMA, it evaluates trend stability and momentum quality, while Z-scores of performance ratios like Sharpe, Sortino, and Omega standardize deviations from historical trends, enabling traders and investors to spot extreme conditions. This dual approach allows users to better identify accumulation (undervaluation) and distribution (overvaluation) phases, enhancing strategies like Dollar Cost Averaging (DCA) and overall timing for entries and exits.
📊 Technical Composition and Calculation
The Universal Trend-Following Valuation System is composed of several trend-following and valuation indicators that create a dynamic dual scoring model:
Risk-Adjusted Ratios (Sharpe, Sortino, Omega): These ratios assess trend quality by analyzing an asset’s risk-adjusted performance. Sharpe and Sortino provide insight into trend consistency and risk/reward, while Omega evaluates profitability potential, helping traders and investors assess how favorable a trend or an asset is relative to its associated risk.
Dynamic Z-Scores: Z-scores are applied to various metrics like Price, RSI, and RoC, helping to identify statistical deviations from the mean, which indicate potential extremes in valuation. By combining these Z-scores, the system produces a cumulative score that highlights when an asset may be overbought or oversold.
Aggregated Trend-Following Indicators: The model consolidates multiple high quality indicators to highlight probable trend shifts. This helps confirm the direction and strength of market moves, allowing users to spot reversals or entry points with greater clarity.
📈 Key Indicators and Features
The Universal Trend and Valuation System combines various technical and statistical tools to deliver a well-rounded analysis of market trends and valuation:
The indicator utilizes trend-following indicators like RSI with DEMA smoothing and Dynamic Score Supertrend to minimize market noise, providing clearer and more stable trend signals. Sharpe, Sortino, and Omega ratios are calculated to assess risk-adjusted performance and volatility, adding a layer of analysis for evaluating trend quality. Z-scores are applied to these ratios, as well as Price and Rate of Change (RoC), to detect deviations from historical trends, highlighting extreme valuation levels.
The system also incorporates multi-layered visualization with gradient color coding to signal valuation states across different market conditions. These adaptive visual cues, combined with threshold-based alerts for overbought and oversold zones, help traders and investors track probable trend reversals or continuations and identify accumulation or distribution zones, adding reliability to both trend-following and mean-reversion strategies.
⚡️ Practical Applications and Examples
✅ Add the Indicator: Add the Universal Trend-Following Valuation System to your favourites and to your chart.
👀 Monitor Trend Shifts and Valuation Levels: Watch the average Z score, trend probability state and gradient colors to identify overbought and oversold conditions. During undervaluation, consider using a DCA strategy to gradually accumulate positions (buy), while overvaluation may signal distribution or profit-taking phases (sell).
🔔 Set Alerts: Configure alerts for significant trend or valuation changes, ensuring you can act on market movements promptly, even when you’re not actively monitoring the charts.
🌟 Summary and Usage Tips
The Universal Trend and Valuation System by QuantAlgo is a highly adaptable tool, designed to support both trend-following and valuation analysis across different market environments. By combining valuation metrics with high quality trend-following indicators, it helps traders and investors identify the relative value of an asset based on historical norms, providing more reliable overbought/sell and oversold/buy signals. The tool’s flexibility across asset types and timeframes makes it ideal for both short-term trading and long-term investment strategies like DCA, allowing users to capture meaningful trends while minimizing noise.

Dynamic Score SMA [QuantAlgo]Dynamic Score SMA 📈🌊
The Dynamic Score SMA by QuantAlgo offers a powerful trend-following approach that combines the simplicity of the Simple Moving Average (SMA) with an innovative dynamic trend scoring technique . By continuously evaluating price movement relative to the SMA over a customizable window, this indicator adapts to varying market conditions, providing traders and investors with clearer, more adaptable trend signals. With this dynamic scoring approach, the Dynamic Score SMA helps identify trend shifts, allowing for more strategic decision-making.
🌟 Conceptual Foundation and Innovation
At the core of the Dynamic Score SMA is its dynamic trend score system , which assesses price movements by comparing them to the SMA over a series of historical data points. This technique goes beyond traditional SMA indicators by offering a dynamic, probabilistic evaluation of trend strength, delivering a more responsive and nuanced view of market direction. The integration of this scoring system enables traders and investors to navigate both trending and sideway markets with greater confidence and precision.
⚙️ Technical Composition and Calculation
The Dynamic Score SMA leverages the Simple Moving Average to establish a baseline trend, with customizable SMA length to control the indicator’s sensitivity. The dynamic trend scoring technique then evaluates price behavior relative to the SMA over a specified window, generating a trend score that reflects the current market bias.
When the score crosses the designated uptrend or downtrend thresholds, the indicator signals a potential trend shift. By adjusting the SMA length, window duration, and thresholds, users can refine the indicator’s responsiveness to match their preferred trading or investing strategy, making it suitable for both volatile and steady markets.
📈 Features and Practical Applications
Customizable SMA Length: Set the length of the SMA to control how sensitive the trend is to price changes. Longer lengths produce smoother trends, while shorter lengths increase responsiveness.
Window Length for Dynamic Scoring: Adjust the window length to determine how many data points are considered in the dynamic trend score calculation, allowing for more tailored analysis of recent versus long-term trends.
Uptrend/Downtrend Thresholds: Define thresholds for triggering trend signals. Higher thresholds reduce sensitivity, providing clearer signals in volatile markets, while lower thresholds capture shorter-term movements.
Bar and Background Coloring: Visual cues, including bar coloring and background fills, provide a quick reference for current trend direction, making it easier to monitor market conditions.
Trend Confirmation: The dynamic trend scoring system verifies trend strength, offering more reliable entry and exit points by filtering out potential false signals.
⚡️ How to Use
✅ Add the Indicator: Add the Dynamic Score SMA to your favourites, then apply it to your chart. Customize the SMA length, window size, and thresholds to match your trading or investing preferences.
👀 Monitor Trend Shifts: Observe the trend in relation to the SMA and watch for signals when the score crosses key thresholds. Bar and/or background coloring will help identify the current trend direction and any shifts in momentum.
🔔 Set Alerts: Configure alerts for significant trend crossovers and reversals, enabling you to act on market changes in real-time without needing constant chart observation.
💫 Summary and Usage Tips
The Dynamic Score SMA by QuantAlgo is a sophisticated trend-following indicator that combines the familiarity of the SMA with a dynamic trend scoring system, providing a more adaptable and probabilistic approach to trend analysis. By tailoring the SMA length, scoring window, and thresholds, traders and investors can fine-tune the indicator for both short-term adjustments and long-term trend following. For optimal use, adjust sensitivity based on market volatility, and rely on the visual cues for clear trend confirmation. Whether you’re navigating choppy markets or stable trends, the Dynamic Score SMA offers a refined approach to capturing market direction with enhanced precision.

Dynamic Score Supertrend [QuantAlgo]Dynamic Score Supertrend 📈🚀
The Dynamic Score Supertrend by QuantAlgo introduces a sophisticated trend-following tool that combines the well-known Supertrend indicator with an innovative dynamic trend scoring technique . By tracking market momentum through a scoring system that evaluates price behavior over a customizable window, this indicator adapts to changing market conditions. The result is a clearer, more adaptive tool that helps traders and investors detect and capitalize on trend shifts with greater precision.
💫 Conceptual Foundation and Innovation
At the core of the Dynamic Score Supertrend is the dynamic trend score system , which measures price movements relative to the Supertrend’s upper and lower bands. This scoring technique adds a layer of trend validation, assessing the strength of price trends over time. Unlike traditional Supertrend indicators that rely solely on ATR calculations, this system incorporates a scoring mechanism that provides more insight into trend direction, allowing traders and investors to navigate both trending and choppy markets with greater confidence.
✨ Technical Composition and Calculation
The Dynamic Score Supertrend utilizes the Average True Range (ATR) to calculate the upper and lower Supertrend bands. The dynamic trend scoring technique then compares the price to these bands over a customizable window, generating a trend score that reflects the current market direction.
When the score exceeds the uptrend or downtrend thresholds, it signals a possible shift in market direction. By adjusting the ATR settings and window length, the indicator becomes more adaptable to different market conditions, from steady trends to periods of higher volatility. This customization allows users to refine the Supertrend’s sensitivity and responsiveness based on their trading or investing style.
📈 Features and Practical Applications
Customizable ATR Settings: Adjust the ATR length and multiplier to control the sensitivity of the Supertrend bands. This allows the indicator to smooth out noise or react more quickly to price shifts, depending on market conditions.
Window Length for Dynamic Scoring: Modify the window length to adjust how many data points the scoring system considers, allowing you to tailor the indicator’s responsiveness to short-term or long-term trends.
Uptrend/Downtrend Thresholds: Set thresholds for identifying trend signals. Increase these thresholds for more reliable signals in choppy markets, or lower them for more aggressive entry points in trending markets.
Bar and Background Coloring: Visual cues such as bar coloring and background fills highlight the direction of the current trend, making it easier to spot potential reversals and trend shifts.
Trend Confirmation: The dynamic trend score system provides a clearer confirmation of trend strength, helping you identify strong, sustained movements while filtering out false signals.
⚡️ How to Use
✅ Add the Indicator: Add the Dynamic Score Supertrend to your favourites, then apply it to your chart. Adjust the ATR length, multiplier, and dynamic score settings to suit your trading or investing strategy.
👀 Monitor Trend Shifts: Track price movements relative to the Supertrend bands and use the dynamic trend score to confirm the strength of a trend. Bar and background colors make it easy to visualize key trend shifts.
🔔 Set Alerts: Configure alerts when the dynamic trend score crosses key thresholds, so you can act on significant trend changes without constantly monitoring the charts.
🌟 Summary and Usage Tips
The Dynamic Score Supertrend by QuantAlgo is a robust trend-following tool that combines the power of the Supertrend with an advanced dynamic scoring system. This approach provides more adaptable and reliable trend signals, helping traders and investors make informed decisions in trending markets. The customizable ATR settings and scoring thresholds make it versatile across various market conditions, allowing you to fine-tune the indicator for both short-term momentum and long-term trend following. To maximize its effectiveness, adjust the settings based on current market volatility and use the visual cues to confirm trend shifts. The Dynamic Score Supertrend offers a refined, probabilistic approach to trading and investing, making it a valuable addition to your toolkit.

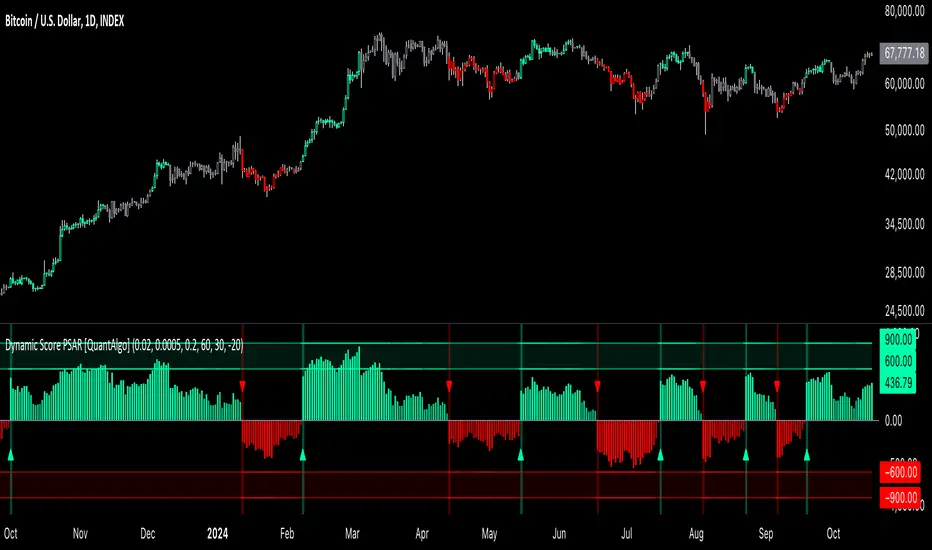
Dynamic Score PSAR [QuantAlgo]Dynamic Score PSAR 📈🧬
The Dynamic Score PSAR by QuantAlgo introduces an innovative approach to trend detection by utilizing a dynamic trend scoring technique in combination with the Parabolic SAR. This method goes beyond traditional trend-following indicators by evaluating market momentum through a scoring system that analyzes price behavior over a customizable window. By dynamically adjusting to evolving market conditions, this indicator provides clearer, more adaptive trend signals that help traders and investors anticipate market reversals and capitalize on momentum shifts with greater precision.
💫 Conceptual Foundation and Innovation
At the core of the Dynamic Score PSAR is the dynamic trend score system, which assesses price movements by comparing normalized PSAR values across a range of historical data points. This dynamic trend scoring technique offers a unique, probabilistic approach to trend analysis by evaluating how the current market compares to past price movements. Unlike traditional PSAR indicators that rely on static parameters, this scoring mechanism allows the indicator to adjust in real time to market fluctuations, offering traders and investors a more responsive and insightful view of trends. This innovation makes the Dynamic Score PSAR particularly effective in detecting shifts in momentum and potential reversals, even in volatile or complex market environments.
✨ Technical Composition and Calculation
The Dynamic Score PSAR is composed of several advanced components designed to provide a higher probability of detecting accurate trend shifts. The key innovation lies in the dynamic trend scoring technique, which iterates over historical PSAR values and evaluates price momentum through a dynamic scoring system. By comparing the current normalized PSAR value with previous data points over a user-defined window, the system generates a score that reflects the strength and direction of the trend. This allows for a more refined and responsive detection of trends compared to static, traditional indicators.
To enhance clarity, the PSAR values are normalized against an Exponential Moving Average (EMA), providing a standardized framework for comparison. This normalization ensures that the indicator adapts dynamically to market conditions, making it more effective in volatile markets. The smoothing process reduces noise, helping traders and investors focus on significant trend signals.
Additionally, users can adjust the length of the data window and the sensitivity thresholds for detecting uptrends and downtrends, providing flexibility for different trading and investing environments.
📈 Features and Practical Applications
Customizable Window Length: Adjust the window length to control the indicator’s sensitivity to recent price movements. This provides flexibility for short-term or long-term trend analysis.
Uptrend/Downtrend Thresholds: Set customizable thresholds for identifying uptrends and downtrends. These thresholds define when trend signals are triggered, offering adaptability to different market conditions.
Bar Coloring and Gradient Visualization: Visual cues, including color-coded bars and gradient fills, make it easier to interpret market trends and identify key moments for potential trend reversals.
Momentum Confirmation: The dynamic trend scoring system evaluates price action over time, providing a probabilistic measure of market momentum to confirm the strength and direction of a trend.
⚡️ How to Use
✅ Add the Indicator: Add the Dynamic Score PSAR to your favourites, then to your chart and adjust the PSAR settings, window length, and trend thresholds to match your preferences. Customize the sensitivity to price movements by tweaking the window length and thresholds for different market conditions.
👀 Monitor Trend Shifts: Watch for trend changes as the normalized PSAR values cross key thresholds, and use the dynamic score to confirm the strength and direction of trends. Bar coloring and background fills visually highlight key moments for trend shifts, making it easier to spot reversals.
🔔 Set Alerts: Configure alerts for significant trend crossovers and reversals, ensuring you can act on market movements promptly, even when you’re not actively monitoring the charts.
🌟 Summary and Usage Tips
The Dynamic Score PSAR by QuantAlgo is a powerful tool that combines traditional trend-following techniques with the flexibility of a dynamic trend scoring system. This innovative approach provides clearer, more adaptive trend signals, reducing the risk of false entries and exits while helping traders and investors capture significant market moves. The ability to adjust the indicator’s sensitivity and thresholds makes it versatile across different trading and investing environments, whether you’re focused on short-term pivots or long-term trend reversals. To maximize its effectiveness, fine-tune the sensitivity settings based on current market conditions and use the visual cues to confirm trend shifts.
Adaptive Volatility-Controlled LSMA [QuantAlgo]Adaptive Volatility-Controlled LSMA by QuantAlgo 📈💫
Introducing the Adaptive Volatility-Controlled LSMA (Least Squares Moving Average) , a powerful trend-following indicator that combines trend detection with dynamic volatility adjustments. This indicator is designed to help traders and investors identify market trends while accounting for price volatility, making it suitable for a wide range of assets and timeframes. By integrating LSMA for trend analysis and Average True Range (ATR) for volatility control, this tool provides clearer signals during both trending and volatile market conditions.
💡 Core Concept and Innovation
The Adaptive Volatility-Controlled LSMA leverages the precision of the LSMA to track market trends and combines it with the sensitivity of the ATR to account for market volatility. LSMA fits a linear regression line to price data, providing a smoothed trend line that is less reactive to short-term noise. The ATR, on the other hand, dynamically adjusts the volatility bands around the LSMA, allowing the indicator to filter out false signals and respond to significant price moves. This combination provides traders with a reliable tool to identify trend shifts while managing risk in volatile markets.
📊 Technical Breakdown and Calculations
The indicator consists of the following components:
1. Least Squares Moving Average (LSMA): The LSMA calculates a linear regression line over a defined period to smooth out price fluctuations and reveal the underlying trend. It is more reactive to recent data than traditional moving averages, allowing for quicker trend detection.
2. ATR-Based Volatility Bands: The Average True Range (ATR) measures market volatility and creates upper and lower bands around the LSMA. These bands expand and contract based on market conditions, helping traders identify when price movements are significant enough to indicate a new trend.
3. Volatility Extensions: To further account for rapid market changes, the bands are extended using additional volatility measures. This ensures that trend signals are generated when price movements exceed both the standard volatility range and the extended volatility range.
⚙️ Step-by-Step Calculation:
1. LSMA Calculation: The LSMA is computed using a least squares regression method over a user-defined length. This provides a trend line that adapts to recent price movements while smoothing out noise.
2. ATR and Volatility Bands: ATR is calculated over a user-defined length and is multiplied by a factor to create upper and lower bands around the LSMA. These bands help detect when price movements are substantial enough to signal a new trend.
3. Trend Detection: The price’s relationship to the LSMA and the volatility bands is used to determine trend direction. If the price crosses above the upper volatility band, a bullish trend is detected. Conversely, a cross below the lower band indicates a bearish trend.
✅ Customizable Inputs and Features:
The Adaptive Volatility-Controlled LSMA offers a variety of customizable options to suit different trading or investing styles:
📈 Trend Settings:
1. LSMA Length: Adjust the length of the LSMA to control its sensitivity to price changes. A shorter length reacts quickly to new data, while a longer length smooths the trend line.
2. Price Source: Choose the type of price (e.g., close, high, low) that the LSMA uses to calculate trends, allowing for different interpretations of price data.
🌊 Volatility Controls:
ATR Length and Multiplier: Adjust the length and sensitivity of the ATR to control how volatility is measured. A higher ATR multiplier widens the bands, making the trend detection less sensitive, while a lower multiplier tightens the bands, increasing sensitivity.
🎨 Visualization and Alerts:
1. Bar Coloring: Customize bar colors to visually distinguish between uptrends and downtrends.
2. Volatility Bands: Enable or disable the display of volatility bands on the chart. The bands provide visual cues about trend strength and volatility thresholds.
3. Alerts: Set alerts for when the price crosses the upper or lower volatility bands, signaling potential trend changes.
📈 Practical Applications
The Adaptive Volatility-Controlled LSMA is ideal for traders and investors looking to follow trends while accounting for market volatility. Its key use cases include:
Identifying Trend Reversals: The indicator detects when price movements break through volatility bands, signaling potential trend reversals.
Filtering Market Noise: By applying ATR-based volatility filtering, the indicator helps reduce false signals caused by short-term price fluctuations.
Managing Risk: The volatility bands adjust dynamically to account for market conditions, helping traders manage risk and improve the accuracy of their trend-following strategies.
⭐️ Summary
The Adaptive Volatility-Controlled LSMA by QuantAlgo offers a robust and flexible approach to trend detection and volatility management. Its combination of LSMA and ATR creates clearer, more reliable signals, making it a valuable tool for navigating trending and volatile markets. Whether you're detecting trend shifts or filtering market noise, this indicator provides the tools you need to enhance your trading and investing strategy.
Note: The Adaptive Volatility-Controlled LSMA is a tool to enhance market analysis. It should be used in conjunction with other analytical tools and should not be relied upon as the sole basis for trading or investment decisions. No signals or indicators constitute financial advice, and past performance is not indicative of future results.

Adaptive EMA with ATR and Standard Deviation [QuantAlgo]Adaptive EMA with ATR and Standard Deviation by QuantAlgo 📈✨
Introducing the Adaptive EMA with ATR and Standard Deviation , a comprehensive trend-following indicator designed to combine the smoothness of an Exponential Moving Average (EMA) with the volatility adjustments of Average True Range (ATR) and Standard Deviation. This synergy allows traders and investors to better identify market trends while accounting for volatility, delivering clearer signals in both trending and volatile market conditions. This indicator is suitable for traders and investors seeking to balance trend detection and volatility management, offering a robust and adaptable approach across various asset classes and timeframes.
💫 Core Concept and Innovation
The Adaptive EMA with ATR and Standard Deviation brings together the trend-smoothing properties of the EMA and the volatility sensitivity of ATR and Standard Deviation. By using the EMA to track price movements over time, the indicator smooths out minor fluctuations while still providing valuable insights into overall market direction. However, market volatility can sometimes distort simple moving averages, so the ATR and Standard Deviation components dynamically adjust the trend signals, offering more nuanced insights into trend strength and reversals. This combination equips traders with a powerful tool to navigate unpredictable markets while minimizing false signals.
📊 Technical Breakdown and Calculations
The Adaptive EMA with ATR and Standard Deviation relies on three key technical components:
1. Exponential Moving Average (EMA): The EMA forms the base of the trend detection. Unlike a Simple Moving Average (SMA), the EMA gives more weight to recent price changes, allowing it to react more quickly to new data. Users can adjust the length of the EMA to make it more or less responsive to price movements.
2. Standard Deviation Bands: These bands are calculated from the standard deviation of the EMA and represent dynamic volatility thresholds. The upper and lower bands expand or contract based on recent price volatility, providing more accurate signals in both calm and volatile markets.
3. ATR-Based Volatility Filter: The Average True Range (ATR) is used to measure market volatility over a user-defined period. It helps refine the trend signals by filtering out false positives caused by minor price swings. The ATR filter ensures that the indicator only signals significant market movements.
⚙️ Step-by-Step Calculation:
1. EMA Calculation: First, the indicator calculates the EMA over a specified period based on the chosen price source (e.g., close, high, low).
2. Standard Deviation Bands: Then, it computes the standard deviation of the EMA and applies a multiplier to create upper and lower bands around the EMA. These bands adjust dynamically with the level of market volatility.
3. ATR Filtering: In addition to the standard deviation bands, the ATR is applied as a secondary filter to help refine the trend signals. This step helps eliminate signals generated by short-term price spikes or corrections, ensuring that the signals are more reliable.
4. Trend Detection: When the price crosses above the upper band, a bullish trend is identified, while a move below the lower band signals a bearish trend. The system accounts for both the standard deviation and ATR bands to generate these signals.
✅ Customizable Inputs and Features
The Adaptive EMA with ATR and Standard Deviation provides a range of customizable options to fit various trading/investing styles:
📈 Trend Settings:
1. Price Source: Choose the price type (e.g., close, high, low) to base the EMA calculation on, influencing how the trend is tracked.
2. EMA Length: Adjust the length to control how quickly the EMA reacts to price changes. A shorter length provides a more responsive EMA, while a longer period smooths out short-term fluctuations.
🌊 Volatility Controls:
1. Standard Deviation Multiplier: This parameter controls the sensitivity of the trend detection by adjusting the distance between the upper and lower bands from the EMA.
2. TR Length and Multiplier: Fine-tune the ATR settings to control how volatility is filtered, adjusting the indicator’s responsiveness during high or low volatility phases.
🎨 Visualization and Alerts:
1. Bar Coloring: Select different colors for uptrends and downtrends, providing a clear visual cue when trends change.
2. Alerts: Set up alerts to notify you when the price crosses the upper or lower bands, signaling a potential long or short trend shift. Alerts can help you stay informed without constant chart monitoring.
📈 Practical Applications
The Adaptive EMA with ATR and Standard Deviation is ideal for traders and investors looking to balance trend-following strategies with volatility management. Key uses include:
Detecting Trend Reversals: The dynamic bands help identify when the market shifts direction, providing clear signals when a trend reversal is likely.
Filtering Market Noise: By applying both Standard Deviation and ATR filtering, the indicator helps reduce false signals during periods of heightened volatility.
Volatility-Based Risk Management: The adaptability of the bands ensures that traders can manage risk more effectively by responding to shifts in volatility while keeping focus on long-term trends.
⭐️ Comprehensive Summary
The Adaptive EMA with ATR and Standard Deviation is a highly customizable indicator that provides traders with clearer signals for trend detection and volatility management. By dynamically adjusting its calculations based on market conditions, it offers a powerful tool for navigating both trending and volatile markets. Whether you're looking to detect early trend reversals or avoid false signals during periods of high volatility, this indicator gives you the flexibility and accuracy to improve your trading and investing strategies.
Note: The Adaptive EMA with ATR and Standard Deviation is designed to enhance your market analysis but should not be relied upon as the sole basis for trading or investing decisions. Always combine it with other analytical tools and practices. No statements or signals from this indicator constitute financial advice. Past performance is not indicative of future results.

Volume on levels @gauranshgVolume on Levels @gauranshg is a powerful Pine Script designed to visualize trading volume across price levels directly on the chart. This script allows users to observe volume intensity, offering a clearer perspective on price action and potential support/resistance areas. By utilizing a dynamic, customizable multiplier, the volume is normalized and displayed in proportion, ensuring better scalability across various timeframes and assets.
Usage:
Normalization of Volume: Users can input a multiplier to adjust the normalization of volume. This is useful when analyzing assets with differing price and volume ranges.
Input of 1 means 1 Million volume will be marked with green color of opacity 1 and 2 Million as 2 and so on. In case you are looking at chart with very high volume, you might want to increase the multiplies
Default multiplier is set to 1, and can be customized for different scales.
Volume Visualization: The volume is displayed on the chart as background boxes behind price levels, with the opacity of the boxes changing based on the normalized volume. This helps to quickly visualize areas of high and low trading activity.
This script is ideal for investors who wish to enhance their volume analysis by visualizing it directly on price levels in a clear, normalized format.

Stef's Enterprise Value CalculatorI have learned the hard way why Enterprise Value is far more superior than Market Cap. That's why I made this indicator, but more importantly, why I added several features that other similar indicators just don't have. The key thing is to not just show you Enterprise Value of a company (it's true worth) but also the capability to see that line colored in a specific way, with key stats as a neat table, and the ability to chart the key facts that go into Enterprise Value, which are debt and cash.
I'll say it again: Market Cap is not nearly as good as Enterprise Value. Don't get tricked by what Market Cap does NOT show you and instead focus on Enterprise Value. I hope my indicator, and the features you see below, help investors and traders all over the world better understand this.
Here are the key features:
Enterprise Value Indicator Features:
1. Real-Time Enterprise Value (EV) Display: Track the EV of a company directly on your chart, providing a comprehensive measure of its true market value.
2. Custom Color Trends: Customize the color of your EV line based on specific trends you’re monitoring, allowing for personalized and insightful visual analysis.
3. Debt & Cash Visualization: Plot both debt and cash & equivalents on the same chart, offering a clear and concise view of a company’s financial health.
4. Key Metrics Table: View a table displaying essential metrics including:
- Average EV
- Highest EV
- Lowest EV
- MC-EV (Market Cap minus Enterprise Value)
MC-EV Charting: Easily chart MC-EV to understand how much debt a company has relative to its market cap, providing insight into financial leverage and growth potential.
Why MC-EV Matters: This metric is crucial for evaluating a company’s financial risk and operational efficiency, giving you an edge in making informed investment decisions.
Thanks for reading and I hope you find some value in this! More updates to come.

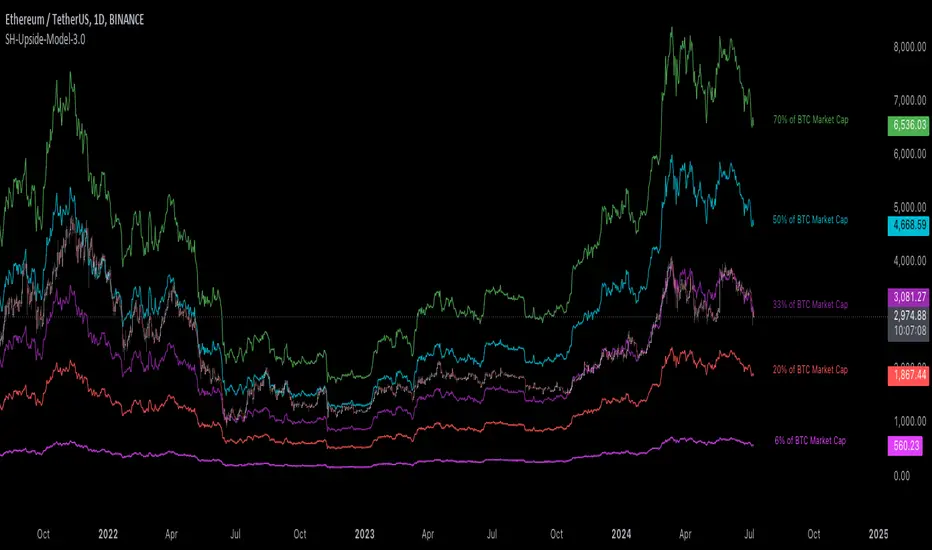
[Suitable Hope] Crypto Upside Model 3.0The "Crypto Upside Model 3.0" indicator dynamically calculates the potential price of any cryptocurrency based on various percentages of Ethereum or Bitcoin's market capitalization.
By fetching and analyzing marketcap data from TradingView sources, it allows traders to visualize potential price targets if their chosen cryptocurrency reaches specific market dominance levels. This tool is designed for daily timeframe analysis and can be used to set informed price expectations and strategic investment goals, providing valuable insights for long-term investment planning.
Why using the Crypto Upside Model 3.0?
Strategic Planning: Helps traders and investors set realistic price targets and investment goals by visualizing potential market cap scenarios.
Informed Decision-Making: Provides a data-driven approach to understanding how a cryptocurrency might perform relative to major assets like Bitcoin and Ethereum.
Customizable Analysis: Allows users to choose different comparison assets (ETH or BTC) and visualize various market cap dominance percentages, offering tailored insights.
Daily Timeframe Focus: Ideal for swing traders and long-term investors who operate on a daily analysis timeframe, providing relevant and actionable data.
Bull Markets: Identify potential price targets if your cryptocurrency's market cap increases significantly.
Bear Markets: Assess how much value could be retained relative to major cryptocurrencies.
Strategic Entry/Exit Points: Use the visualized targets to plan entry or exit points in your trading strategy.
Comparative Advantage
Dynamic Adaptation: Unlike fixed indicators, this tool adapts to any active chart, making it versatile for multiple cryptocurrencies.
Market Cap Insights: Provides a unique perspective by linking price targets to market cap dominance, a critical factor in the crypto market.
User Instructions
Setup: Add the " Upside Model 3.0" indicator to your TradingView chart.
Configuration: Use the input settings to select the comparison cryptocurrency (ETH or BTC) and enable the desired market cap percentage plots.
Analysis: The indicator will display potential price targets based on the selected market cap percentages, providing a visual guide for setting price expectations.
Limitations
Marketcap Data Availability: The indicator relies on marketcap data from TradingView, which may not be available for all cryptocurrencies. If the data is unavailable, the indicator will not function for that asset. This tool is more likely to work with older, established cryptocurrencies, as marketcap data for newer cryptocurrencies may not yet be available.
Daily Timeframe Restriction: The indicator is designed to work exclusively on the daily timeframe, limiting its applicability for intraday trading.
Assumptions of Market Dynamics: The calculations assume a direct correlation between market dominance and price, which may not account for other market dynamics and external factors influencing prices.
Data Accuracy: The accuracy of the indicator depends on the reliability of the data provided by TradingView, which may sometimes experience delays or inaccuracies.
Currently available cryptocurrencies: Bitcoin, Ethereum, Solana, Binance Coin, Cardano, Ripple, Polkadot, Avalanche, Chainlink, Litecoin, Dogecoin, Terra, Uniswap, VeChain, Stellar, Internet Computer, Hedera, Filecoin, Monero, Aave, TRON, NEAR Protocol, Compound, Maker,... For all compatible cryptocurrencies, please consult CRYPTOCAP's documentation.
Final notes
Although various sources ask a payment or user data for similar kind of private indicators, this one is entirely free and open source. "Uncanny" isn't it? I hope this indicator will provide you value. Feel free to leave a message if you have any questions or constructive feedback.
Examples of how I use this indicator
When using ETH's historical price as a reference compared to Bitcoin's marketcap, we can notice that price generally has been held between the +-30% and 50% lines of BTC's marketcap. If history is repeating again, we can expect major resistances around the 50% looking ahead into the future. This for me would be a great area to potentially reduce my ETH spot position.
When using SOL's historical price action, we can notice that the 15% line of ETH's marketcap has been a top in the previous cycle. Today SOL (July 2024), is back at this level. Could this be a top again or could price break this 15% level and head perhaps towards 30% which currently sits around $260? Time will tell.
These are 2 simple example of how I interpret the data. I'm keen to hear what other findings with other pairs you can find.
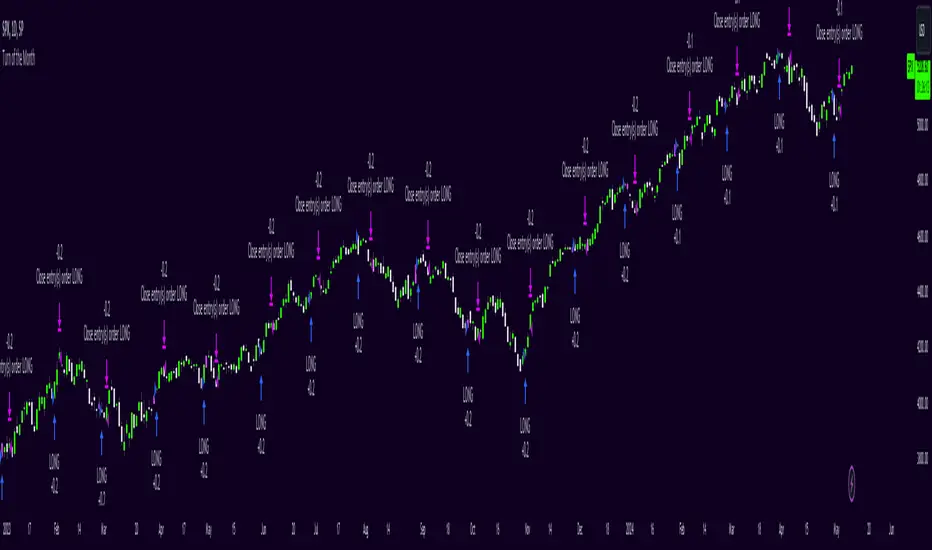
Turn of the Month Strategy [Honestcowboy]The end of month effect is a well known trading strategy in the stock market. Quite simply, most stocks go up at the end of the month. What's even better is that this effect spills over to the next phew days of the next month.
In this script we backtest this theory which should work especially well on SP500 pair.
By default the strategy buys 2 days before the end of each month and exits the position 3 days into the next month.
The strategy is a long only strategy and is extremely simple. The SP500 is one of the #1 assets people use for long term investing due to it's "9.8%" annualised return. However as a trader you want the best deal possible. This strategy is only inside the market for about 25% of the time while delivering a similar return per exposure with a lower drawdown.
Here are some hypothesis why turn of the month effect happens in the stock markets:
Increased inflow from savings accounts to stocks at end of month
Rebalancing of portfolios by fund managers at end of month
The timing of monthly cash flows received by pension funds, which are reinvested in the stock market.
The script also has some inputs to define how many days before end of the month you want to buy the asset and how long you want to hold it into the next month.
It is not possible to buy the asset exactly on this day every month as the market closes on the weekend. I've added some logic where it will check if that day is a friday, saturdady or sunday. If that is the case it will send the buy signal on the end of thursday, this way we enter on the friday and don't lose that months trading opportunity.
The backtest below uses 4% exposure per trade as to show the equity curve more clearly and because of publishing rules. However, most fund managers and investors use 100% exposure. This way you actually risk money to earn money. Feel free to adjust the settings to your risk profile to get a clearer picture of risks and rewards before implementing in your portfolio.
Index investingThe Index Investing indicator simplifies decision-making for adding to Index ETF's Long-term investments. By utilizing a percentage discount methodology, it highlights potential opportunities to enhance portfolios. This straightforward tool aids in identifying favorable moments to invest based on calculated price discounts from selected reference points, making the process more systematic and less subjective.
🔶 SETTINGS
Reference Price: Choose between 'All-Time-High' or 'Start of the Year' as the basis for calculating discount levels. This allows for flexibility in strategy depending on market conditions or investment philosophy.
Discount 1 %, Discount 2 %, Discount 3 %: These inputs define the percentage below the reference price at which buy signals are generated. They represent strategic entry points at discounted prices.
🔶 Default Parameters
The default parameters of 4.13%, 8.26%, and 12.39% for the discount levels are chosen based on the average 5-year return of the NSE:NIFTY Index, which stands at approximately 12.39%. By dividing this return into three parts, we obtain a structured approach to capturing potential upside at varying levels of market retracement, providing a logical basis for the selected default values.
Users have the flexibility to modify these parameters, tailoring the indicator to fit their unique approach and market outlook.
🔶 How Levels Are Calculated
Discount levels are calculated using the formula: Discount Price = Reference Price * (1 - Discount %) . This succinct approach establishes specific entry points below the chosen reference, such as an all-time high or the year's start price.
🔶 How Are the Buy Labels Generated
Buy signals are generated when the market price(Low of the candle) crosses under any of the defined discount levels. Each level has a corresponding buy label ('Buy 1', 'Buy 2', 'Buy 3'), which is activated upon the price crossing below the specified discount level and is only reset at the beginning of a new year or upon reaching a new reference high, ensuring signals are not repetitive for the same price level.
🔶 Other Features
Alerts: The indicator provides alerts for each buy signal, notifying potential entry points at their defined discount levels. The alert triggers only once per candle.
Year Marker: A vertical line with an accompanying label marks the start of each trading year on the chart. This feature aids in visualizing the temporal context of buy signals and reference price adjustments.

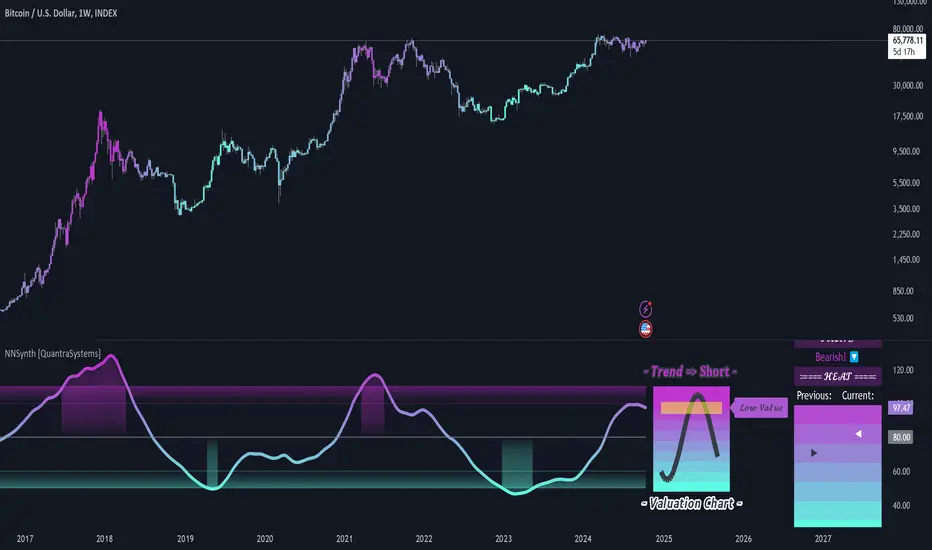
Neural Network Synthesis: Trend and Valuation [QuantraSystems]Neural Network Synthesis - Trend and Valuation
Introduction
The Neural Network Synthesis (𝓝𝓝𝒮𝔂𝓷𝓽𝓱) indicator is an innovative technical analysis tool which leverages neural network concepts to synthesize market trend and valuation insights.
This indicator uses a bespoke neural network model to process various technical indicator inputs, providing an improved view of market momentum and perceived value.
Legend
The main visual component of the 𝓝𝓝𝒮𝔂𝓷𝓽𝓱 indicator is the Neural Synthesis Line , which dynamically oscillates within the valuation chart, categorizing market conditions as both under or overvalued and trending up or down.
The synthesis line coloring can be set to trend analysis or valuation modes , which can be reflected in the bar coloring.
The sine wave valuation chart oscillates around a central, volatility normalized ‘fair value’ line, visually conveying the natural rhythm and cyclical nature of asset markets.
The positioning of the sine wave in relation to the central line can help traders to visualize transitions from one market phase to another - such as from an undervalued phase to fair value or an overvalued phase.
Case Study 1
The asset in question experiences a sharp, inefficient move upwards. Such movements suggest an overextension of price, and mean reversion is typically expected.
Here, a short position was initiated, but only after the Neural Synthesis line confirmed a negative trend - to mitigate the risk of shorting into a continuing uptrend.
Two take-profit levels were set:
The midline or ‘fair value’ line.
The lower boundary of the 𝓝𝓝𝒮𝔂𝓷𝓽𝓱 indicators valuation chart.
Although mean-reversion trades are typically closed when price returns to the mean, under circumstances of extreme overextension price often overcorrects from an overbought condition to an oversold condition.
Case Study 2
In the above study, the 𝓝𝓝𝒮𝔂𝓷𝓽𝓱 indicator is applied to the 1 Week Bitcoin chart in order to inform long term investment decisions.
Accumulation Zones - Investors can choose to dollar cost average (DCA) into long term positions when the 𝓝𝓝𝒮𝔂𝓷𝓽𝓱 indicates undervaluation
Distribution Zones - Conversely, when overvalued conditions are indicated, investors are able to incrementally sell holdings expecting the market peak to form around the distribution phase.
Note - It is prudent to pay close attention to any change in trend conditions when the market is in an accumulation/distribution phase, as this can increase the likelihood of a full-cycle market peak forming.
In summary, the 𝓝𝓝𝒮𝔂𝓷𝓽𝓱 indicator is also an effective tool for long term investing, especially for assets like Bitcoin which exhibit prolonged bull and bear cycles.
Special Note
It is prudent to note that because markets often undergo phases of extreme speculation, an asset's price can remain over or undervalued for long periods of time, defying mean-reversion expectations. In these scenarios it is important to use other forms of analysis in confluence, such as the trending component of the 𝓝𝓝𝒮𝔂𝓷𝓽𝓱 indicator to help inform trading decisions.
A special feature of Quantra’s indicators is that they are probabilistically built - therefore they work well as confluence and can easily be stacked to increase signal accuracy.
Example Settings
As used above.
Swing Trading
Smooth Length = 150
Timeframe = 12h
Long Term Investing
Smooth Length = 30
Timeframe = 1W
Methodology
The 𝓝𝓝𝒮𝔂𝓷𝓽𝓱 indicator draws upon the foundational principles of Neural Networks, particularly the concept of using a network of ‘neurons’ (in this case, various technical indicators). It uses their outputs as features, preprocesses this input data, runs an activation function and in the following creates a dynamic output.
The following features/inputs are used as ‘neurons’:
Relative Strength Index (RSI)
Moving Average Convergence-Divergence (MACD)
Bollinger Bands
Stochastic Momentum
Average True Range (ATR)
These base indicators were chosen for their diverse methodologies for capturing market momentum, volatility and trend strength - mirroring how neurons in a Neural Network capture and process varied aspects of the input data.
Preprocessing:
Each technical indicator’s output is normalized to remove bias. Normalization is a standard practice to preprocess data for Neural Networks, to scale input data and allow the model to train more effectively.
Activation Function:
The hyperbolic tangent function serves as the activation function for the neurons. In general, for complete neural networks, activation functions introduce non-linear properties to the models and enable them to learn complex patterns. The tanh() function specifically maps the inputs to a range between -1 and 1.
Dynamic Smoothing:
The composite signal is dynamically smoothed using the Arnaud Legoux Moving Average, which adjusts faster to recent price changes - enhancing the indicator's responsiveness. It mimics the learning rate in neural networks - in this case for the output in a single layer approach - which controls how much new information influences the model, or in this case, our output.
Signal Processing:
The signal line also undergoes processing to adapt to the selected assets volatility. This step ensures the indicator’s flexibility across assets which exhibit different behaviors - similar to how a Neural Network adjusts to various data distributions.
Notes:
While the indicator synthesizes complex market information using methods inspired by neural networks, it is important to note that it does not engage in predictive modeling through the use of backpropagation. Instead, it applies methodologies of neural networks for real-time market analysis that is both dynamic and adaptable to changing market conditions.
Weighted Average Volume Depth [QuantraSystems]Weighted Average Volume Depth
Introduction
The Weighted Average Volume Depth (𝓦𝓐𝓥𝓓) indicator is calibrated to provide extensive insights, calculated using volumetric price action and volume depth, and provides dynamic adjustments based upon historical volatility.
This indicator is a valuable asset for traders and investors, aiming to capture trends, measure dynamic volatility, and provide market reversion analysis in a systematic way.
Legend
Volumetric Top Cap: Plotted at y = 0, this line represents the probabilistic maximum value, or ‘cap’ for the signal line. It is colored using a binary color scheme, and indicates the dominant trend direction - green for an uptrend and purple for a downtrend.
Base Line: Calculated using a volume-weighted volatility measurement, this line is used as the benchmark to calculate momentum in the 𝓦𝓐𝓥𝓓 indicator.
Signal Line: The signal line represents the volume and volatility weighted measurements, and oscillates between the Base Line and Top Cap. Its position between these levels provides the depth of insights available in this script.
When the signal line is remaining in close proximity to the base line, this is indicative of a low volatility market environment. These periods are also reflected as muted bar coloring when the ‘Trend Intensity’ setting is enabled.
Conversely, when the signal line approaches, or even breaks above the Top Cap, this is characteristic of an unsustainable trending action - and probabilistically speaking, a reversion or consolation is likely to occur at these levels.
Highlighting: When this setting is enabled, background coloring is applied when the Signal Line breaks above the Top Cap. This highlights green as an oversold zone, and purple as an overbought zone.
Reversal Signals: When price begins to reverse from a zone of overextension, a signal is plotted when this reversion occurs from a high probability zone.
Circle - Shows a possible bullish reversal.
Cross - Shows a possible bearish reversal.
Case Study
In the above image, we showcase three distinct trades in short succession, showcasing the 𝓦𝓐𝓥𝓓’s speed and accuracy under the right conditions.
The first long trade was initiated upon receiving a bullish reversal signal. The trade was then closed after the price experienced a sharp upwards movement - and an overbought signal was indicated by the purple shading.
The second, short trade was entered on the next bar, after a bearish reversal signal was printed by the indicator (a white cross). Similarly, this trade was closed upon the oversold signal.
Once again, a reversal signal was indicated by the 𝓦𝓐𝓥𝓓 indicator. This time a bullish signal (a white circle), and hence a long position was opened. However, this trade was held until a negative trend confirmation (signaled by the Top Cap’s shift in color). This makes apparent the indicator’s flexible nature, and showcases the multiple signaling types available for traders to use.
Recommended Settings
The optimal settings for the 𝓦𝓐𝓥𝓓 indicator will vary upon the chosen asset’s average level volatility, as well as the timeframe it is applied to.
Due to increased volatility levels on lower timeframes, it is recommended to increase the 'Top Cap Multiplier' to take into account the increased frequency of false signals found in these trading environments. The same can be said when used on highly volatile assets - a trader will likely benefit from using a higher 'Top Cap Multiplier.'
On more price-stable assets, as well as any asset on higher timeframes, there is merit to tightening the length of the 'Top Cap Multiplier,' due to the slower nature of price action.
Methodology
The 𝓦𝓐𝓥𝓓 starts with calculating the volume weighted average price and the volume weighted variance - which is the expectation of the squared deviation of a variable from its mean, giving insights into the distribution of trading volume.
Using the volume weighted variance, a standard deviation value is calculated based on user input. This value acts as the ‘Volumetric Top Cap’ - seen in the 𝓦𝓐𝓥𝓓 indicator window as the zero line.
The signal line is calculated as the difference between the current price and the theoretical upper or lower VWAP deviation bands. This line acts as the trigger for identifying prevailing trends and high probability reversal points.
The base line serves as a reference point for historical momentum. It is calculated using an exponential moving average of the lowest signal line values over a defined lookback period. This baseline helps in assessing whether the current momentum is high or low relative to historical norms.
Notes
Bar coloring can be turned off - especially useful when stacking multiple indicators as recommended, or set to 'Trend Intensity,' or 'Binary Trend' (which reflects the top cap coloring).
It is always recommended to never rely on a single indicator - and instead build and test multiple strategies utilizing more than one indicator as confirmation.

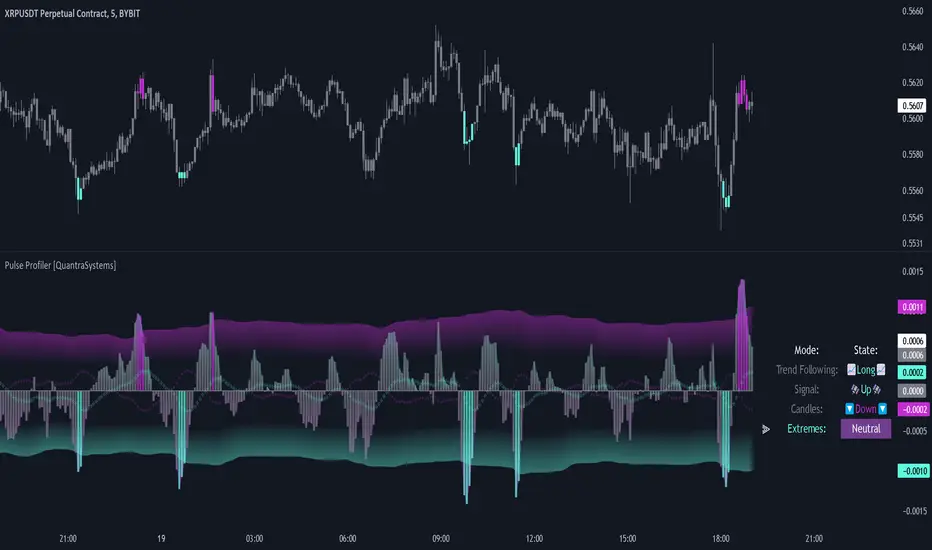
Pulse Profiler [QuantraSystems]Pulse Profiler
Introduction
The Pulse Profiler ( ℙℙ ) is specifically designed to unambiguously indicate weakening momentum after a strong impulse. The upper and lower standard deviation bands also allow the user to assess the strength of an impulse and differentiate it from general noise.
Due to the ℙℙ ’s rapid responsiveness to exhaustion in price movement it is ideally used for the trader to recognize when to start taking profit when combined with other indicators.
The novum is that by dynamically balancing its sensitivity to recent movements the ℙℙ considers the asset’s inherent volatility. By reducing noise without sacrificing signal, and by visualizing it in our typical modern QuantraAI style, the ℙℙ enhances the traders’ ability to distinguish impulses with weakening momentum from strong trending movements.
Legend
Impulse: The ℙℙ showing strength based on momentum and volume.
Dynamic standard deviation bands: Rolling probability based bands based on a rolling normal distribution. Adjustable, recommended are σ = 1.5 to σ = 2.5.
Neutral lines: Dynamic thresholds which get often respected as support or resistance.
Case Study
To properly employ the ℙℙ , the trader should use it to identify out-of-the-ordinary 𝓲𝓶𝓹𝓾𝓵𝓼𝓮𝓼 which cause a following exhaustion.
The rolling standard deviation bands incorporate the asset’s historical behavior in regards to its inherent volatility on a rolling basis. If the asset shows strong 𝓲𝓶𝓹𝓾𝓵𝓼𝓮𝓼 that go beyond the rolling standard deviation, the event has been highly improbable. The trader then needs to determine if the price change was caused by critical external factors. If not, it is highly probable that the momentum exhausts and that price movement plateaus to enter a range.
These signals indicate that it is highly probable that closing a position upon these conditions is the correct choice.
If the 𝓲𝓶𝓹𝓾𝓵𝓼𝓮 reverses and retraces into the opposite direction, while moving more than 1.5σ across just 3 bars on the 4H chart, the signal indicates that a reversal is pushing the price down – in both momentum and volume.
A sharp reversal thus becomes more probable than not.
The ℙℙ can also be calibrated to find possible trend exhaustions on a longer timeframe (1D).
Please always use multiple Quantra indicators to add confirmations to your signals.
Recommended Settings
Swing Trading (4H chart)
Standard Deviation Lookback: 150
Standard Deviation Multiplier (σ): 2.5
Display Variant: Classic
Choose Mode for Bar Coloring: Signal
Trend exhaustion (1D chart)
Standard Deviation Lookback: 200
Standard Deviation Multiplier (σ): 2.0
Display Variant: Classic
Choose Mode for Bar Coloring: Extremes
Notes
Quantra Standard Value Contents:
The Heikin-Ashi (HA) candle visualization smoothes out the signal line to provide more informative insights into momentum and trends. This allows earlier entries and exits by observing the indicator values transformed by the HA.
Various visualization options are available to adjust the indicator to the user’s preference: Aside from HA, a classic line, or a hybrid of both.
A special feature of Quantra’s indicators is that they are probabilistically built - therefore they work well as confluence and can easily be stacked to increase signal accuracy.
To add to Quantra's indicators’ utility we have added the option to change the price bars colors based on different signals:
Choose Mode for Coloring
Trend Following (Indicator above mid line counts as uptrend, below is downtrend)
Extremes (Everything beyond the SD bands is highlighted to signal mean reversion)
Candles (Color of HA candles as barcolor)
Reversions (Only for HA) (Reversion Signals via the triangles if HA candles change trend while beyond the SD bands, high probability entries/exits)
The ℙℙ is also sensitive to divergences for those interested in utilizing this feature.
Through a special combination of price, volume and momentum you get a holistic overview on the impulse strengths of movements.
The two neutral lines in the center act as dynamic, volume and volatility adjusted thresholds. Often the signal line respects them as support and resistance.
The upper and lower standard deviation lines express the rarity of an impulse based on the asset’s inherent volatility.
The indicator needs a long enough timespan to build up its probability estimation, therefore the asset needs sufficient price history.
The indicator requires thorough volume data. If the source of an asset pair does not forward it, try to find another source or exchange for the same pair.
Signal Mode on the 4H chart is a relevant part of this indicator when used in isolation and helps to analyze momentum adjusted by volatility.
Methodology
The ℙℙ combines the Arnaud Legoux Moving Average (ALMA) with a bespoke volume and momentum calculation, with a classical Exponential Moving Average (EMA) on price data.
The ℙℙ itself integrates ALMA for volume and momentum with an EMA calculation on price, creating a unique blend that expresses impulses using their three raw main components.
The indicator calculates dynamic standard deviation bands based on an adjustable lookback period and the adjustable sigma (σ), to signal when the impulse strength is just uncommon or even extraordinary when compared to the usual price movements:
σ = 1.5 the probability of similar impulse strength occuring is 13.37% / 2, hence ~ 6.69%
σ = 2.0 the probability of similar impulse strength occuring is ~ 2.28%
σ = 2.5 the probability of similar impulse strength occuring is ~ 0.62%
By detecting extremely improbable conditions the indicator can create an inversely highly probable signal to its user.
Neutral bands are calculated based on the ℙℙ alongside a rolling, dynamic multiplier. This effectively provides dynamic thresholds for approximating common volatility.
Heikin Ashi method: The indicator uses a custom function to calculate Heikin Ashi values, useful for smoothing impulse data and identifying trends.
Reversion Signals: Specifically for Heikin Ashi displays, we plot triangles as signals, useful to easily spot potential reversals.
The Signal Mode uses these different thresholds to highlight significant market moves.
Rate of Change Suite [QuantraSystems]Rate of Change Suite
Introduction
The "Rate of Change Suite" (𝓡𝓸𝓒 𝓢𝓾𝓲𝓽𝓮) refines traditional RoC concepts by incorporating additional elements that provide more nuanced views of market trends, potential reversions, and momentum shifts.
Its main benefits are that it allows traders to detect momentum changes and frontrun trend shifts.
The suite is designed to be highly adaptable, catering to various trading styles, timeframes and market conditions. It is comprised of 3 metrics:
The RoC base line plots the rate of change, the Signal Histogram to confirm trends, and the Signal Confirmation Oscillator to inform reversal probabilities. For the early detection of trend shifts, the 𝓡𝓸𝓒 𝓢𝓾𝓲𝓽𝓮 is a comprehensive tool for the toolkit of modern traders.
A core component of the 𝓡𝓸𝓒 𝓢𝓾𝓲𝓽𝓮 is the ability to apply its processing techniques to any other indicator found on TradingView - essentially leveraging the signal power of existing analysis methods. This is achieved by modifying the ‘Source’ input.
Legend
𝓡𝓸𝓒 base line: The primary component of the suite, the RoC Line, offers a direct view of market momentum. An upward trending RoC line informs the potential for a long position, while a downward trend might signal the opportunity for a short position. Both include a secondary confirmation by the color change of the line itself. The Heikin Ashi transformed version of the RoC line provides greater resistance to rapid movements, or outliers.
Signal Histogram: This feature works in tandem with the base RoC Line, providing an additional third confirmation of trends. A rising histogram supports the presence of an upward trend. Conversely, a declining histogram aligns with downward trends.
Signal Confirmation Oscillator: This dotted-line is crucial for detecting peaks or troughs in market momentum: These can precede reversals or shifts in the prevailing trend. Traders can use this signal to anticipate and prepare for potential changes quicker than others.
Case Study
Primarily a tool to follow trends, the 𝓡𝓸𝓒 𝓢𝓾𝓲𝓽𝓮 implies much more – you can trade with a confirmed trend signal entry and a mean reversion signal for the exit:
Here we see two practical cases of the 𝓡𝓸𝓒 𝓢𝓾𝓲𝓽𝓮 on the 1h BTC chart.
In the first scenario, the trader waits for three confirmations from the indicator.
The 𝓡𝓸𝓒 baseline to lead the run and looks for confirmation two and three:
𝓡𝓸𝓒 base line color shifts
and the Signal Histogram follows past the null midline.
The trader has adjusted their risk beforehand and enters the long position.
The 𝓡𝓸𝓒 𝓢𝓾𝓲𝓽𝓮 shows traders when to take profit:
The Signal Confirmation Oscillator (SCO, dotted line) moves beyond the 𝓡𝓸𝓒 baseline and the Signal Histogram. The trader can take 50% of the profit already.
The trader waits patiently, and if the SCO reverses, the rest of the position is closed.
The same works inversely for the second trade, which successfully frontran the decline shortly after.
Recommended Settings
Day Trading (1H chart)
Length: 30
Smooth Length: 10
Display Variant: Classic
Choose Mode: Trend Following
Investing – Follow Trend (1D chart)
Default settings
Notes
Quantra Standard Value Contents:
The Heikin-Ashi (HA) candle visualization smoothes out the signal line to provide more informative insights into momentum and trends. This allows earlier entries and exits by observing the indicator values transformed by the HA.
Various visualization options are available to adjust the indicator to the user’s preference: Aside from HA, a classic line, or a hybrid of both.
A special feature of Quantra’s indicators is that they are probabilistically built - therefore they work well as confluence and can easily be stacked to increase signal accuracy.
To add to Quantra's indicators’ utility we have added the option to change the price bars’ colors based on different signals:
Choose Mode for Coloring
Trend Following (Indicator above mid line counts as uptrend, below is downtrend)
Extremes (Everything beyond the SD bands is highlighted to signal mean reversion)
Candles (Color of HA candles as barcolor)
Reversions (Only for HA) (Reversion Signals via the triangles if HA candles change trend while beyond the SD bands, high probability entries/exits)
Divergence Sensitivity: Quantra’s 𝓡𝓸𝓒 𝓢𝓾𝓲𝓽𝓮 is finely tuned to detect divergences, a key feature for identifying possible trend reversals.
Trend Following and Reversions: Primarily a tool for trend following, the 𝓡𝓸𝓒 𝓢𝓾𝓲𝓽𝓮 is also adept at spotting potential reversions and slowdowns in momentum.
Range Trading Compatibility: In its Heikin Ashi Candles mode, the suite becomes particularly effective for range trading strategies.
High Customizability: Traders can customize the suite with various visualization options, including classic line representation, HA transformation, and bar coloring. These can be based on Heikin Ashi Candles or Trend Following approaches, providing flexibility to adapt to different trading scenarios.
Methodology
The 𝓡𝓸𝓒 𝓢𝓾𝓲𝓽𝓮 is built on a foundation of functions that define and calculate the Rate of Change. They employ a variety of moving average types (SMA, EMA, DEMA, TEMA, WMA, etc.) which can be selected to optimize the RoC line.
A bespoke function to calculate Heikin-Ashi values is engineered to offer a more consistent view of the trend.
The Signal Histogram is derived by mathematically processing the base RoC signal. The Signal Confirmation Oscillator is based on a modified formula, adjusted to align with the RoC dynamics.
With a range of customization options for its visual presentation, including color schemes and display styles, the 𝓡𝓸𝓒 𝓢𝓾𝓲𝓽𝓮 is designed to cater to both trend following indications as well as finding signals for mean reversion trades. This multifaceted approach enables the 𝓡𝓸𝓒 𝓢𝓾𝓲𝓽𝓮 to allow the trader to combine signals of both types to de-risk his positions.
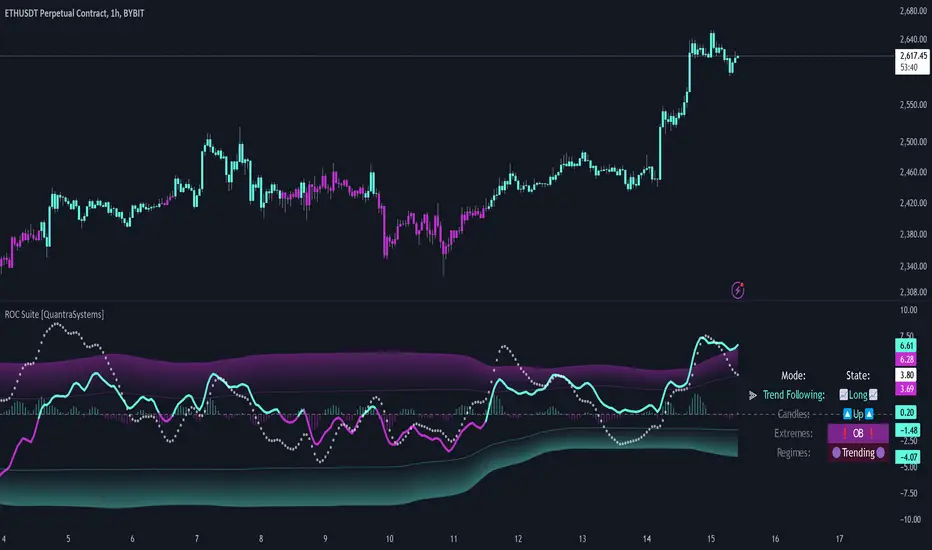
Regression Sloped RSI [QuantraSystems]Regression Sloped RSI
Introduction
The Regression Sloped RSI (𝓡𝓢-𝓡𝓢𝓘) enhances the classical RSI by incorporating a form of linear regression analysis, which adjusts the traditional RSI in relation to the calculated slope over a specified lookback period.
Its innovative approach reduces the occurrence of false signals compared to the classical RSI. Furthermore, it is particularly effective in markets characterized by strong trends. This is because it responds faster while retaining a high level of whipsaw resistance. The Heikin-Ashi style processing is critical to this.
It also provides robust reversal signals from dynamic overbought and oversold zones to further enhance mean-reversion trading.
Legend
The coloring of the 𝓡𝓢-𝓡𝓢𝓘 changes based on trend direction: A bright green when upwards, lilac when downwards. The strength of the trend is expressed in its distance to Null. Its acceleration is found in the Heikin-Ashi (HA) candles.
The 𝓡𝓢-𝓡𝓢𝓘 in combination with the HA bars can be used to achieve earlier entries, when the former passes across the latter in an obvious divergence.
Case Study
In this example the 𝓡𝓢-𝓡𝓢𝓘 is used to make a few intra-day trades on the Ethereum 15 minute chart. Each trade was open for approximately 5 hours. On the first trade we enter a long in an early entry. The indicator gives us three confirmations which we should all check for. First we have a positive candle developing, secondly the 𝓡𝓢-𝓡𝓢𝓘 (line) rises above the Heikin-Ashi candles, thirdly the classical RSI (the saturated surface in the background) rises as well.
The trader should then calculate their position sizing responsibly and enter into a short daytrade. Please always have invalidation rules, for example a) if the initial HA candle closes negative b) you can place your stop loss at 1SD into the opposite direction.
Always use adequate risk management, never risk more than 1% of your portfolio, unless you are a seasoned trader with your own calculated position sizes.
Always forward test your rules, assets, timeframe and settings sufficiently.
It is always recommended to use multiple Quantra indicators to add confirmations to your signals - this is by design.
Recommended Settings
Please reset to defaults before enabling recommended settings.
Intra-Day Trading (15min chart)
RSI Length: 22
LR Length: 25
Smoothing: EMA
Toggle SD Bands: On
Mode for Coloring: Candles
Trend Following (4H chart)
RSI Length: 40
LR Length: 35
Smoothing: LSMA
Toggle SD Bands: Off
Mode for Coloring: Extremes or Trend Following
Notes
Quantra Standard Value Contents:
The Heikin-Ashi (HA) candle visualization smoothes out the signal line to provide more informative insights into momentum and trends. This allows earlier entries and exits by observing the indicator values transformed by the HA.
Various visualization options are available to adjust the indicator to the user’s preference: Aside from HA, a classic line, or a hybrid of both.
A special feature of Quantra’s indicators is that they are probabilistically built - therefore they work well as confluence and can easily be stacked to increase signal accuracy.
To add to Quantra's indicators’ utility we have added the option to change the price bars colors based on different signals:
Choose Mode for Coloring
Trend Following (Indicator above mid line counts as uptrend, below is downtrend)
Extremes (Everything beyond the SD bands is highlighted to signal mean reversion)
Candles (Color of HA candles as barcolor)
Reversions (Only for HA) (Reversion Signals via the triangles if HA candles change trend while beyond the SD bands, high probability entries/exits)
The 𝓡𝓢-𝓡𝓢𝓘 is finely tuned to detect divergences.
Primarily utilized for trend following, the 𝓡𝓢-𝓡𝓢𝓘 also demonstrates effectiveness in identifying reversions, intensity of movements and the navigation of range-bound markets.
Allows for easy identification of slowdowns in momentum and thus negative rate of change.
Methodology
The 𝓡𝓢-𝓡𝓢𝓘 takes the classical RSI using a specified lookback length and computes the slope of a linear regression line applied to the RSI values. This slope is used to adjust the RSI.
This sloped RSI can be further smoothed using various Moving Averages with customizable lengths.
For a more nuanced view of market trends, the 𝓡𝓢-𝓡𝓢𝓘 applies a specialized Heikin Ashi method. This transformation modifies the Sloped RSI values in order to weigh and reflect the average price, offering a smoother representation compared to traditional candlestick patterns.
The 𝓡𝓢-𝓡𝓢𝓘 calculates upper and lower bounds based on a specified standard deviation multiplier and adjustable lookback period, providing a dynamic framework to identify extrema and thus overbought and oversold conditions.
Particularly in the Heikin Ashi mode, the 𝓡𝓢-𝓡𝓢𝓘 can display reversion signals. These are plotted as shapes on the chart, indicating high probability reversal points in the market trend.

Wave Pendulum Trend [QuantraSystems]Wave Pendulum Trend
Introduction
The Wave Pendulum Trend (𝓟𝓮𝓷𝓭𝓾𝓵𝓾𝓶 𝓣𝓻𝓮𝓷𝓭) extrapolates market trends using physical principles derived from waves and pendulums. This indicator is a bespoke build, and its performance and behavior cannot be compared to existing indicators.
It is designed for trend following but is also effective for identifying mean reversions, momentum strength, and shows range-bound market periods within the dynamic bands.
In order to ascertain a smooth yet rapid trend direction of the market, the 𝓟𝓮𝓷𝓭𝓾𝓵𝓾𝓶 𝓣𝓻𝓮𝓷𝓭 combines several factors. A bespoke set of functions captures the momentum of price movements and dynamically weighs it over time. The indicator then extrapolates acceleration from the change in delta of price movements.
Legend
With bar coloring enabled, the price section mirrors current trend conditions. Please keep this feature disabled if you intend to use multiple indicators to avoid confusion.
The 𝓟𝓮𝓷𝓭𝓾𝓵𝓾𝓶 𝓣𝓻𝓮𝓷𝓭 presents extensive market insights. The purple and green bands around the oscillator signal the selected standard deviation (default σ = 2), for the trader to calculate how common the trending movements are in relation to the selected asset’s history.
The inner, dynamic thresholds, indicated by the blue “Range-bound market” label in the graphic above, border the area that signals a ranging market if both 𝓐𝓬𝓬𝓮𝓵𝓮𝓻𝓪𝓽𝓲𝓸𝓷 and 𝓜𝓸𝓶𝓮𝓷𝓽𝓾𝓶 signals remain inside. If either line exceeds these thresholds, care is advised as a shift in market behavior is underway.
“Trend strength” in the graphic provides a good estimate for the trending movements strength.
If the signal lines exceed the set standard deviation in non-classic mode, a reversal is very likely.
Case Study
As shown in the above case study we see two profitable swing trades on the 4H chart of Ethereum. Please note the display variant here is set to “Heikin-Ashi”.
We always recommend using a multitude of indicators to attain multiple signals on the likelihood of opening the correct position. However, this standalone scenario serves as an example on how the 𝓟𝓮𝓷𝓭𝓾𝓵𝓾𝓶 𝓣𝓻𝓮𝓷𝓭 added two profitable swing trades.
The first short trade was opened after the 𝓐𝓬𝓬𝓮𝓵𝓮𝓻𝓪𝓽𝓲𝓸𝓷 and 𝓜𝓸𝓶𝓮𝓷𝓽𝓾𝓶 reversed after crossing the threshold of standard deviation. This trade offered a late entry only, these two factors were followed late by the third signal in this case – the trend reversal. Such a trade would require additional indicators to signal at the same time, so the trader can get more confirmations. The trade was closed after 6D with an 8% gain on a 1x short position.
The second trade is a long position that enters in the same manner. The trader takes the reversal beyond the select standard deviation as a likely entry. After 7D a triple confirmation was received, as indicated by the triangle, that a reversal or at least a plateau is extremely likely. The trade was closed after 7D with a 17.23% gain on a 1x long position.
Recommended Settings
Trend Following / Investing (1D chart)
Please use the default settings!
Swing Trading (4H chart)
Wave MA - Type: TEMA
Wave MA – Length: 30
Display Variant: Heikin-Ashi
Bar Coloring: Off
Choose Mode for Coloring: Signal
Notes
Quantra Standard Value Contents:
The Heikin-Ashi (HA) candle visualization smoothes out the signal line to provide more informative insights into momentum and trends. This allows earlier entries and exits by observing the indicator values transformed by the HA.
Various visualization options are available to adjust the indicator to the user’s preference: Aside from HA, a classic line, or a hybrid of both.
A special feature of Quantra’s indicators is that they are probabilistically built - therefore they work well as confluence and can easily be stacked to increase signal accuracy.
To add to Quantra's indicators’ utility we have added the option to change the price bars colors based on different signals:
Settings: TEMA and DEMA length settings should be longer compared to other Moving Averages (MAs). Due to its complex calculations, the indicator requires a larger amount of historical data for accurate computation.
Sensitivity to Divergences: The Wave Pendulum Trend is particularly sensitive to divergences, making it a useful tool in spotting potential trend reversals or continuations.
Trend Following and Reversions: While it is primarily used for trend following, it also excels in identifying market reversions.
Momentum and Acceleration: The interaction between momentum and acceleration is a key feature of this indicator.
Visualization: The indicator offers various visualization options, including bar coloring based on HA Candles and extremes and trends. It also introduces a novel approach to visualizing the oscillator in the "Classic" mode and provides an adjustable Standard Deviation (SD) measure for reversal signals in non-classic modes.
Choose Mode for Coloring
Trend Following (Indicator above mid line counts as uptrend, below is downtrend)
Extremes (Everything beyond the SD bands is highlighted to signal mean reversion)
Candles (Color of HA candles as barcolor)
Reversions (Only for HA) (Reversion Signals via the triangles if HA candles change trend while beyond the SD bands, high probability entries/exits)
Methodology
The methodology behind the Wave Pendulum Trend is inspired by wave and pendulum theories to extrapolate market moves. By calculating the momentum and its acceleration from price data, it provides a nuanced view of the market trend.
Traders should observe the color coding, which reflects the interplay between momentum, acceleration, and set thresholds for acceleration. The Signal Mode is particularly useful for quickly identifying trend, momentum, and acceleration exhaustions.
Additionally, the indicator can help filter out ranges with insufficient momentum acceleration. Traders are encouraged to experiment with this mode and adjust the threshold settings to suit their strategies.

RSI Volatility Bands [QuantraSystems]RSI Volatility Bands
Introduction
The RSI Volatility Bands indicator introduces a unique approach to market analysis by combining the traditional Relative Strength Index (RSI) with dynamic, volatility adjusted deviation bands. It is designed to provide a highly customizable method of trend analysis, enabling investors to analyze potential entry and exit points in a new and profound way.
The deviation bands are calculated and drawn in a manner which allows investors to view them as areas of dynamic support and resistance.
Legend
Upper and Lower Bands - A dynamic plot of the volatility-adjusted range around the current price.
Signals - Generated when the RSI volatility bands indicate a trend shift.
Case Study
The chart highlights the occurrence of false signals, emphasizing the need for caution when the bands are contracted and market volatility is low.
Juxtaposing this, during volatile market phases as shown, the indicator can effectively adapt to strong trends. This keeps an investor in a position even through a minor drawdown in order to exploit the entire price movement.
Recommended Settings
The RSI Volatility Bands are highly customisable and can be adapted to many assets with diverse behaviors.
The calibrations used in the above screenshots are as follows:
Source = close
RSI Length = 8
RSI Smoothing MA = DEMA
Bandwidth Type = DEMA
Bandwidth Length = 24
Bandwidth Smooth = 25
Methodology
The indicator first calculates the RSI of the price data, and applies a custom moving average.
The deviation bands are then calculated based upon the absolute difference between the RSI and its moving average - providing a unique volatility insight.
The deviation bands are then adjusted with another smoothing function, providing clear visuals of the RSI’s trend within a volatility-adjusted context.
rsiVal = ta.rsi(close, rsiLength)
rsiEma = ma(rsiMA, rsiVal, bandLength)
bandwidth = ma(bandMA, math.abs(rsiVal - rsiEma), bandLength)
upperBand = ma(bandMA, rsiEma + bandwidth, smooth)
lowerBand = ma(bandMA, rsiEma - bandwidth, smooth)
long = upperBand > 50 and not (lowerBand < lowerBand and lowerBand < 50)
short= not (upperBand > 50 and not (lowerBand < lowerBand and lowerBand < 50))
By dynamically adjusting to market conditions, the RSI trend bands offer a unique perspective on market trends, and reversal zones.

EPS GridIntroduction:
This simple indicator offers insights into the relationship between stock prices and earnings, aiding in the assessment of valuation dynamics during different periods.
Understanding Price-to-Earnings (P/E) Ratio:
The commonly used Price to Earnings (P/E) ratio, calculated as Current Price divided by Earnings Per Share (EPS) over the trailing 12 months (TTM), serves as a fundamental metric. Here, we use this formula to estimate a stock's price. For instance, multiplying EPS by 10 provides an approximation of the stock price with a P/E ratio of 10.
The Grid Concept:
Utilizing this principle, a visual grid is constructed to illustrate how stock prices correlate with earnings. This grid facilitates the identification of both potential bargains and overvalued stocks.
How to Utilize:
This indicator is pre-configured with earnings multiples of 10, 15, 20, and 25. Simply add it to your chart and observe whether earnings demonstrate consistent growth. If prices lag behind earnings, a potential catch-up phase may ensue in the future.
Happy Investing!
Embark on your investment journey armed with this indicator, and may it guide you towards informed decisions and successful ventures.
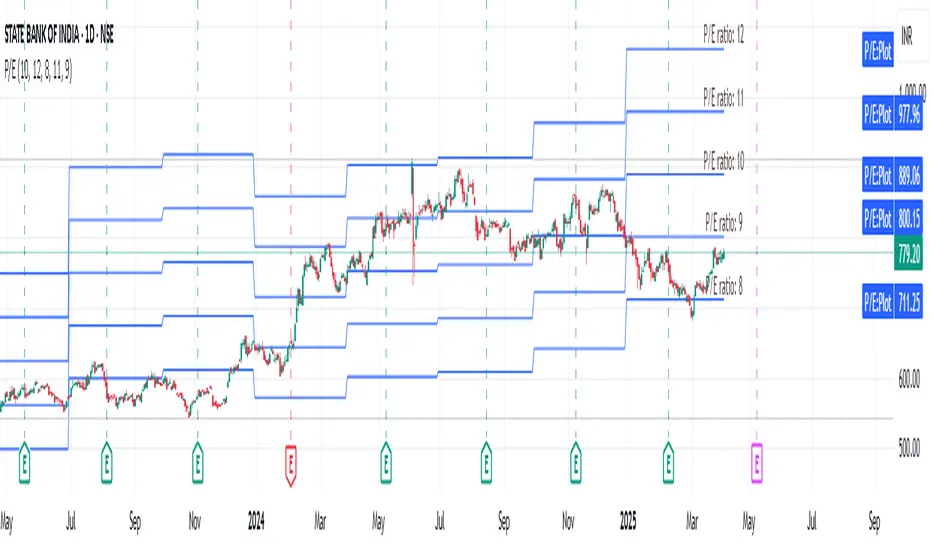
Smart DCA StrategyINSPIRATION
While Dollar Cost Averaging (DCA) is a popular and stress-free investment approach, I noticed an opportunity for enhancement. Standard DCA involves buying consistently, regardless of market conditions, which can sometimes mean missing out on optimal investment opportunities. This led me to develop the Smart DCA Strategy – a 'set and forget' method like traditional DCA, but with an intelligent twist to boost its effectiveness.
The goal was to build something more profitable than a standard DCA strategy so it was equally important that this indicator could backtest its own results in an A/B test manner against the regular DCA strategy.
WHY IS IT SMART?
The key to this strategy is its dynamic approach: buying aggressively when the market shows signs of being oversold, and sitting on the sidelines when it's not. This approach aims to optimize entry points, enhancing the potential for better returns while maintaining the simplicity and low stress of DCA.
WHAT THIS STRATEGY IS, AND IS NOT
This is an investment style strategy. It is designed to improve upon the common standard DCA investment strategy. It is therefore NOT a day trading strategy. Feel free to experiment with various timeframes, but it was designed to be used on a daily timeframe and that's how I recommend it to be used.
You may also go months without any buy signals during bull markets, but remember that is exactly the point of the strategy - to keep your buying power on the sidelines until the markets have significantly pulled back. You need to be patient and trust in the historical backtesting you have performed.
HOW IT WORKS
The Smart DCA Strategy leverages a creative approach to using Moving Averages to identify the most opportune moments to buy. A trigger occurs when a daily candle, in its entirety including the high wick, closes below the threshold line or box plotted on the chart. The indicator is designed to facilitate both backtesting and live trading.
HOW TO USE
Settings:
The input parameters for tuning have been intentionally simplified in an effort to prevent users falling into the overfitting trap.
The main control is the Buying strictness scale setting. Setting this to a lower value will provide more buying days (less strict) while higher values mean less buying days (more strict). In my testing I've found level 9 to provide good all round results.
Validation days is a setting to prevent triggering entries until the asset has spent a given number of days (candles) in the overbought state. Increasing this makes entries stricter. I've found 0 to give the best results across most assets.
In the backtest settings you can also configure how much to buy for each day an entry triggers. Blind buy size is the amount you would buy every day in a standard DCA strategy. Smart buy size is the amount you would buy each day a Smart DCA entry is triggered.
You can also experiment with backtesting your strategy over different historical datasets by using the Start date and End date settings. The results table will not calculate for any trades outside what you've set in the date range settings.
Backtesting:
When backtesting you should use the results table on the top right to tune and optimise the results of your strategy. As with all backtests, be careful to avoid overfitting the parameters. It's better to have a setup which works well across many currencies and historical periods than a setup which is excellent on one dataset but bad on most others. This gives a much higher probability that it will be effective when you move to live trading.
The results table provides a clear visual representation as to which strategy, standard or smart, is more profitable for the given dataset. You will notice the columns are dynamically coloured red and green. Their colour changes based on which strategy is more profitable in the A/B style backtest - green wins, red loses. The key metrics to focus on are GOA (Gain on Account) and Avg Cost .
Live Trading:
After you've finished backtesting you can proceed with configuring your alerts for live trading.
But first, you need to estimate the amount you should buy on each Smart DCA entry. We can use the Total invested row in the results table to calculate this. Assuming we're looking to trade on BITSTAMP:BTCUSD
Decide how much USD you would spend each day to buy BTC if you were using a standard DCA strategy. Lets say that is $5 per day
Enter that USD amount in the Blind buy size settings box
Check the Blind Buy column in the results table. If we set the backtest date range to the last 10 years, we would expect the amount spent on blind buys over 10 years to be $18,250 given $5 each day
Next we need to tweak the value of the Smart buy size parameter in setting to get it as close as we can to the Total Invested amount for Blind Buy
By following this approach it means we will invest roughly the same amount into our Smart DCA strategy as we would have into a standard DCA strategy over any given time period.
After you have calculated the Smart buy size , you can go ahead and set up alerts on Smart DCA buy triggers.
BOT AUTOMATION
In an effort to maintain the 'set and forget' stress-free benefits of a standard DCA strategy, I have set my personal Smart DCA Strategy up to be automated. The bot runs on AWS and I have a fully functional project for the bot on my GitHub account. Just reach out if you would like me to point you towards it. You can also hook this into any other 3rd party trade automation system of your choice using the pre-configured alerts within the indicator.
PLANNED FUTURE DEVELOPMENTS
Currently this is purely an accumulation strategy. It does not have any sell signals right now but I have ideas on how I will build upon it to incorporate an algorithm for selling. The strategy should gradually offload profits in bull markets which generates more USD which gives more buying power to rinse and repeat the same process in the next cycle only with a bigger starting capital. Watch this space!
MARKETS
Crypto:
This strategy has been specifically built to work on the crypto markets. It has been developed, backtested and tuned against crypto markets and I personally only run it on crypto markets to accumulate more of the coins I believe in for the long term. In the section below I will provide some backtest results from some of the top crypto assets.
Stocks:
I've found it is generally more profitable than a standard DCA strategy on the majority of stocks, however the results proved to be a lot more impressive on crypto. This is mainly due to the volatility and cycles found in crypto markets. The strategy makes its profits from capitalising on pullbacks in price. Good stocks on the other hand tend to move up and to the right with less significant pullbacks, therefore giving this strategy less opportunity to flourish.
Forex:
As this is an accumulation style investment strategy, I do not recommend that you use it to trade Forex.
STRATEGY IN ACTION
Here you see the indicator running on the BITSTAMP:BTCUSD pair. You can read the indicator as follows:
Vertical green bands on historical candles represents where buy signals triggered in the past
Table on the top right represents the results of the A/B backtest against a standard DCA strategy
Green Smart Buy column shows that Smart DCA was more profitable than standard DCA on this backtest. That is shown by the percentage GOA (Gain on Account) and the Avg Cost
Smart Buy Zone label marks the threshold which the entire candle must be below to trigger a buy signal (line can be changed to a box under plotting settings)
Green color of Smart Buy Zone label represents that the open candle is still valid for a buy signal. A signal will only be generated if the candle closes while this label is still green
Below is the same BITSTAMP:BTCUSD chart a couple of days later. Notice how the threshold has been broken and the Smart Buy Zone label has turned from green to red. No buy signal can be triggered for this day - even if the candle retraced and closed below the threshold before daily candle close.
Notice how the green vertical bands tend to be present after significant pullbacks in price. This is the reason the strategy works! Below is the same BITSTAMP:BTCUSD chart, but this time zoomed out to present a clearer picture of the times it would invest vs times it would sit out of the market. You will notice it invests heavily in bear markets and significant pullbacks, and does not buy anything during bull markets.
Finally, to visually demonstrate the indicator on an asset other than BTC, here is an example on CRYPTO:ETHUSD . In this case the current daily high has not touched the threshold so it is still possible for this to be a valid buy trigger on daily candle close. The vertical green band will not print until the buy trigger is confirmed.
BACKTEST RESULTS
Now for some backtest results to demonstrate the improved performance over a standard DCA strategy using all non-stablecoin assets in the top 30 cryptos by marketcap.
I've used the TradingView ticker (exchange name denoted as CRYPTO in the symbol search) for every symbol tested with the exception of BTCUSD because there was some dodgy data at the beginning of the TradingView BTCUSD chart which overinflated the effectiveness of the Smart DCA strategy on that ticker. For BTCUSD I've used the BITSTAMP exchange data. The symbol links below will take you to the correct chart and exchange used for the test.
I'm using the GOA (Gain on Account) values to present how each strategy performed.
The value on the left side is the standard DCA result and the right is the Smart DCA result.
✅ means Smart DCA strategy outperformed the standard DCA strategy
❌ means standard DCA strategy outperformed the Smart DCA strategy
To avoid overfitting, and to prove that this strategy does not suffer from overfitting, I've used the exact same input parameters for every symbol tested below. The settings used in these backtests are:
Buying strictness scale: 9
Validation days: 0
You can absolutely tweak the values per symbol to further improve the results of each, however I think using identical settings on every pair tested demonstrates a higher likelihood that the results will be similar in the live markets.
I'm presenting results for two time periods:
First price data available for trading pair -> closing candle on Friday 26th Jan 2024 (ALL TIME)
Opening candle on Sunday 1st Jan 2023 -> closing candle on Friday 26th Jan 2024 (JAN 2023 -> JAN 2024)
ALL TIME:
BITSTAMP:BTCUSD 80,884% / 133,582% ✅
CRYPTO:ETHUSD 17,231% / 36,146% ✅
CRYPTO:BNBUSD 5,314% / 2,702% ❌
CRYPTO:SOLUSD 1,745% / 1,171% ❌
CRYPTO:XRPUSD 2,585% / 4,544% ✅
CRYPTO:ADAUSD 338% / 353% ✅
CRYPTO:AVAXUSD 130% / 160% ✅
CRYPTO:DOGEUSD 13,690% / 16,432% ✅
CRYPTO:TRXUSD 414% / 466% ✅
CRYPTO:DOTUSD -16% / -7% ✅
CRYPTO:LINKUSD 1,161% / 2,164% ✅
CRYPTO:TONUSD 25% / 47% ✅
CRYPTO:MATICUSD 1,769% / 1,587% ❌
CRYPTO:ICPUSD 70% / 50% ❌
CRYPTO:SHIBUSD -20% / -19% ✅
CRYPTO:LTCUSD 486% / 718% ✅
CRYPTO:BCHUSD -4% / 3% ✅
CRYPTO:LEOUSD 102% / 151% ✅
CRYPTO:ATOMUSD 46% / 91% ✅
CRYPTO:UNIUSD -16% / 1% ✅
CRYPTO:ETCUSD 283% / 414% ✅
CRYPTO:OKBUSD 1,286% / 1,935% ✅
CRYPTO:XLMUSD 1,471% / 1,592% ✅
CRYPTO:INJUSD 830% / 1,035% ✅
CRYPTO:OPUSD 138% / 195% ✅
CRYPTO:NEARUSD 23% / 44% ✅
Backtest result analysis:
Assuming we have an initial investment amount of $10,000 spread evenly across each asset since the creation of each asset, it would have provided the following results.
Standard DCA Strategy results:
Average percent return: 4,998.65%
Profit: $499,865
Closing balance: $509,865
Smart DCA Strategy results:
Average percent return: 7,906.03%
Profit: $790,603
Closing balance: $800,603
JAN 2023 -> JAN 2024:
BITSTAMP:BTCUSD 47% / 66% ✅
CRYPTO:ETHUSD 26% / 33% ✅
CRYPTO:BNBUSD 15% / 17% ✅
CRYPTO:SOLUSD 272% / 394% ✅
CRYPTO:XRPUSD 7% / 12% ✅
CRYPTO:ADAUSD 43% / 59% ✅
CRYPTO:AVAXUSD 116% / 151% ✅
CRYPTO:DOGEUSD 8% / 14% ✅
CRYPTO:TRXUSD 48% / 65% ✅
CRYPTO:DOTUSD 24% / 35% ✅
CRYPTO:LINKUSD 83% / 124% ✅
CRYPTO:TONUSD 7% / 21% ✅
CRYPTO:MATICUSD -3% / 7% ✅
CRYPTO:ICPUSD 161% / 196% ✅
CRYPTO:SHIBUSD 1% / 8% ✅
CRYPTO:LTCUSD -15% / -7% ✅
CRYPTO:BCHUSD 47% / 68% ✅
CRYPTO:LEOUSD 9% / 11% ✅
CRYPTO:ATOMUSD 1% / 15% ✅
CRYPTO:UNIUSD 9% / 23% ✅
CRYPTO:ETCUSD 27% / 40% ✅
CRYPTO:OKBUSD 21% / 30% ✅
CRYPTO:XLMUSD 11% / 19% ✅
CRYPTO:INJUSD 477% / 446% ❌
CRYPTO:OPUSD 77% / 91% ✅
CRYPTO:NEARUSD 78% / 95% ✅
Backtest result analysis:
Assuming we have an initial investment amount of $10,000 spread evenly across each asset for the duration of 2023, it would have provided the following results.
Standard DCA Strategy results:
Average percent return: 61.42%
Profit: $6,142
Closing balance: $16,142
Smart DCA Strategy results:
Average percent return: 78.19%
Profit: $7,819
Closing balance: $17,819

Simple Neural Network Transformed RSI [QuantraSystems]Simple Neural Network Transformed RSI
Introduction
The Simple Neural Network Transformed RSI (ɴɴᴛ ʀsɪ) stands out as a formidable tool for traders who specialize in lower timeframe trading.
It is an innovative enhancement of the traditional RSI readings with simple neural network smoothing techniques.
This unique blend results in fairly accurate signals, tailored for swift market movements. The ɴɴᴛ ʀsɪ is particularly resistant to the usual market noise found in lower timeframes, ensuring a clearer view of short-term trends.
Furthermore, its diverse range of visualization options adds versatility, making it a valuable tool for traders seeking to capitalize on short-duration market dynamics.
Legend
In the Image you can see the BTCUSD 1D Chart with the ɴɴᴛ ʀsɪ in Trend Following Mode to display the current trend. This is visualized with the barcoloring.
Its Overbought and Oversold zones start at 50% and end at 100% of the selected Standard Deviation (default σ = 2), which can indicate extremely rare situations which can lead to either a softening momentum in the trend or even a mean reversion situation.
Here you can also see the original Indicator line and the Heikin Ashi transformed Indicator bars - more on that now.
Notes
Quantra Standard Value Contents:
To draw out all the information from the indicator calculation we have added a Heikin-Ashi (HA) Candle Visualization.
This HA transformation smoothens out the indicator values and gives a more informative look into Momentum and Trend of the Indicator itself.
This allows early entries and exits by observing the HA transformed Indicator values.
To diversify, different visualization options are available, either a classic line, HA transformed or Hybrid, which contains both of the previous.
To make Quantra's Indicators as useful and versatile as possible we have created options
to change the barcoloring and thus the derived signal from the indicator based on different modes.
Option to choose different Modes:
Trend Following (Indicator above mid line counts as uptrend, below is downtrend)
Extremities (Everything going beyond the Deviation Bands in a Mean Reversion manner is highlighted)
Candles (Color of HA candles as barcolor)
Reversion (HA ONLY) (Reversion Signals via the triangles if HA candles change state outside of the Deviation Bands)
- Reversion Signals are indicated by the triangles in the Heikin-Ashi or Hybrid visualization when the HA Candles revert
from downwards to upwards or the other way around OUTSIDE of the SD Bands.
Depending on the Indicator they signal OB/OS areas and can either work as high probability entries and exits for Mean Reversion trades or
indicate Momentum slow downs and potential ranges.
Please use another indicator to confirm this.
Case Study
To effectively utilize the NNT-RSI, traders should know their style and familiarize themselves with the available options.
As stated above, you have multiple modes available that you can combine as you need and see fit.
In the given example mostly only the mode was used in an isolated fashion.
Trend Following:
Purely relied on State Change - Midline crossover
Could be combined with Momentum or Reversion analysis for better entries/exits.
Extremities:
Ideal entry/exit is in the accordingly colored OS/OB Area, the Reversion signaled the latest possible entry/exit.
HA Candles:
Specifically applicable for strong trends. Powerful and fast tool.
Can whip if used as sole condition.
Reversions:
Shows the single entry and exit bars which have a positive expected value outcome.
Can also be used as confirmation or as last signal.
Please note that we always advise to find more confluence by additional indicators.
Traders are encouraged to test and determine the most suitable settings for their specific trading strategies and timeframes.
In the showcased trades the default settings were used.
Methodology
The Simple Neural Network Transformed RSI uses a simple neural network logic to process RSI values, smoothing them for more accurate trend analysis.
This is achieved through a linear combination of RSI values over a specified input length, weighted evenly to produce a neural network output.
// Simple neural network logic (linear combination with weighted aggregation)
var float inputs = array.new_float(nnLength, na)
for i = 0 to nnLength - 1
array.set(inputs, i, rsi1 )
nnOutput = 0.0
for i = 0 to nnLength - 1
nnOutput := nnOutput + array.get(inputs, i) * (1 / nnLength)
nnOutput
This output is then compared against a standard or dynamic mean line to generate trend following signals.
Mean = ta.sma(nnOutput, sdLook)
cross = useMean? 50 : Mean
The indicator also incorporates Heikin Ashi candlestick calculations to provide additional insights into market dynamics, such as trend strength and potential reversals.
// Calculate Heikin Ashi representation
ha = ha(
na(nnOutput ) ? nnOutput : nnOutput ,
math.max(nnOutput, nnOutput ),
math.min(nnOutput, nnOutput ),
nnOutput)
Standard deviation bands are used to create dynamic overbought and oversold zones, further enhancing the tool's analytical capabilities.
// Calculate Dynamic OB/OS Zones
stdv_bands(_src, _length, _mult) =>
float basis = ta.sma(_src, _length)
float dev = _mult * ta.stdev(_src, _length)
= stdv_bands(nnOutput, sdLook,sdMult/2)
= stdv_bands(nnOutput, sdLook, sdMult)
The Standard Deviation bands take defined parameters from the user, in this case sigma of ideally between 2 to 3,
to help the indicator detect extremely improbable conditions and thus take an inversely probable signal from it to forward to the user.
The parameter settings and also the visualizations allow for ample customizations by the trader.
For questions or recommendations, please feel free to seek contact in the comments.
