FXC Order Block Finder █ OVERVIEW
The FXC Order Bock Finder finds and draws institutional order blocks according to the Smart Money Concept. Order blocks are zones where institutions have most likely left some orders that need to be filled at a later point in time. In These order blocks or POIs can be used to either place limit orders or to look for instant entries as price comes to retest the zone. It works on all time frames but higher time frames tend to be more precise.
█ HOW DOES IT WORK?
The indicator waits for a break of structure (BOS) and then prints a zone if there's an engulfing pattern and an open imbalance. Basically it draws zones where a fake move followed by aggressive buying or selling happened and Imbalances were left open.
█ WHAT MAKES IT UNIQUE?
Apart from the fact that I haven’t found any indicator that is able to properly draw order blocks most indicators do re-paint which doesn’t make any sense in the case of the Smart Money Concept.
Furthermore does this indicator have settings that let’s you adjust how the order blocks are drawn. From wick to end of the imbalance or candle close to imbalance. Also you can set how many candles it takes into consideration for the imbalance in case the imbalance starts after the engulfing pattern has formed. And you can set how many candles have to checked to determine a BOS or an internal BOS by using fractal breaks.
█ HOW TO USE IT?
Either place sell limits at the lower end of the order block with SL slightly above the OB and buy limits at the upper end of the OB with SL slightly below the OB. Target a fixed Risk Reward Ratio or trade it to the next order block. By using multi time frame analysis you can determine the overall direction of the market and prevent low probability trades. Also worth mentioning is that order blocks that have been created during high volume sessions tend to result in way better trades than with order blocks that have been printed during the Asia session.
█ ADDITIONAL INFO
As soon as price retested an order block the order block is mitigated and therefore not valid anymore. Also order blocks that are too far back in time are less probable to deliver good trades. In general the win rate tends not to be too high using this method but more often than not there's a reaction as price taps into an order block and trades with high RRR are quite often. As always in trading, proper money management and risk management is key.
█ DISCLAIMER
This is not financial advice. The Indicator spots these zones according to the smart money concept . However there's absolutely no guarantee that a nice order blocks results in a good trade.
█ Examples
Innercircletrader

Futures Exchange Sessions 2.0Description
Successor to Futures Exchange Sessions indicator. Completely rebuilt code from the ground up. Every feature has been redesigned and refactored to be the most beneficial while allowing for complete configuration by the user.
This indicator displays Futures Sessions as live boxes that expand dynamically as price moves over the time interval. These boxes make liquidity levels extremely easy to spot and visualize. It helps the user identify market structure and develop their own bias of price action. Everything about the Session boxes can be configured. Box color, border color, border style, and border width are all individually controllable. Each Future Session can be turned on or off at any time. Also, each box has their own text label (Asian Session, London Session, New York Session) and this text can be moved around the box, change color, and change size.
Previous days highs and lows (major liquidity levels) are always important to the futures trader. This indicator now allows the user to individually display the three previous days highs and low levels as lines with optional label. Each line can be independently toggled on or off and like always, every conceivable customization option is available to the user. And the labels can be moved to the right (via the Input Settings) to allow unobstructed views of candles.
The midnight EST open and 8:30 AM EST open horizontal lines (developed by the Inner Circle Trader) are returning in this indicator. But the biggest improvement is that the lines stop at the current bar or the last bar of the trading day. Additionally, the time lines are displayed on previous days so the user can easily see how the candles reacted to these important times of the day.
The Session boxes and the horizontal time lines now can be set to only display a certain number of day back. If the user wants just to see Session boxes for the previous day only, they can do that. If the user wants to see the last 15 days of boxes or lines it is very easy to increase the days back in the settings. Currently, the max days back is 80 calendar days.
Additional Images
Easily visualize and understand price action across time
Everything is customizable so the user can easily match this indicator to their color preferences
Special Notes
To turn off box session text set opacity to 0%
Boxes and horizontal time lines only display when timeframe is <= 30 minute

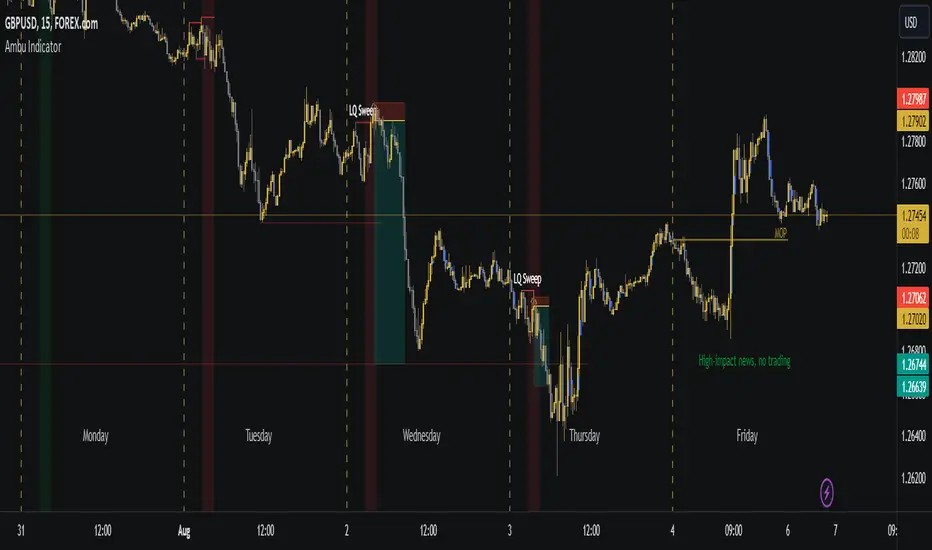
Ambu IndicatorAids in analysis and trading with ICT models by automatically plotting concepts taught by Michael J. Huddleston, the Inner Circle Trader.
Mainly tailored around my specific trading needs, I just decided to share because it might help other people too.
What's Plotted and Included in the Indicator:
1. FVGs
2. ICT Sessions - Since this indicator is tailored specific to my trading needs, I disabled LCKZ, NYCKZ, IPDA TD, etc.
Asian Killzone - 1900-0000 EST
London Open Killzone - 0200-0500 EST
NY Open Killzone - 0700-1000 EST
Central Bank Dealer's Range - 1600-2000 EST
3. Seasonal Tendencies - The background color of the Killzones reflect the seasonal tendency of the specific pair. Currently, the only pairs supported are DXY, GBPUSD, EURUSD, and NAS100. More pairs being supported is planned for the future.
4. Midnight Opening Price - 0000 EST
To Do:
1. Pairs to add seasonal tendencies for (in-order)
SP500
US30
AUDUSD
USDCAD
XAUUSD
2. Weekly Opening Price
3. For indices, the 0830 (EST) IPDA shift opening price
4. PWH/PWL?
5. PMH/PML?
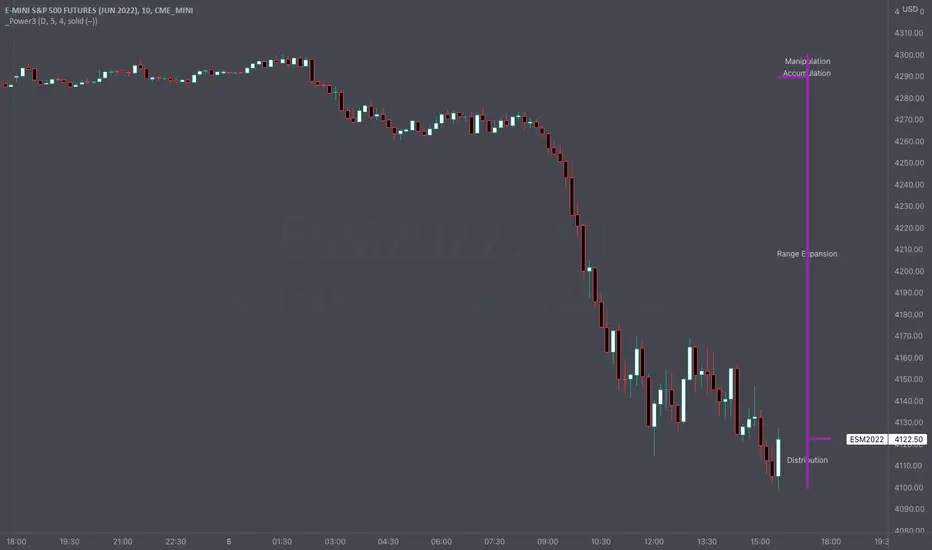
Intraday Power 3 VisualDescription
This indicator draws a dynamic "Open High Low Close" type visual on intraday charts so the trader can easily keep track of the daily/weekly movement. This indicator was inspired by the Inner Circle Trader’s (ICT) “Power 3” concept, which is Accumulation, Manipulation, and Distribution of price on a daily timeframe.
Visual
This indicator plots the chosen timeframes opening price along with a live line for the current price. This makes it very easy to identify the daily/weekly range along it’s open. And the user can combine this indicator with my other indicator “Futures Exchange Sessions” to plot the midnight EST & 8:30 AM EST lines to get a great summation of over night price action.
Inputs and Style
In the Input section the user can dynamically switch between Daily and Weekly timeframes. Built in ability to move the entire Visual to the right makes preventing indicator overlap a breeze. All of the lines can be configured: color, style, and width. Independently toggle ON/OFF the Power 3 labels (Accumulation, Manipulation, Range Extension, Distribution) and can change labels color. The labels dynamically move and switch positions based upon bear or bull daily/weekly range.
Special Notes
The Futures market is open 23/5. It is closed everyday for 1-hour at 5pm EST and closed over the weekends. Because this Intraday Power 3 Visual is drawing in the 'future' on the users TradingView chart, when the visual is close or in a time when the market is closed, the visual doesn't behave properly. This is because TradingView doesn't display times when the Market is closed, thus the drawings cannot be displayed during those times. There is nothing wrong with the script. Please wait until the Market is open and the visual will be drawn normally.
This indicator is intended for use in the Futures Market
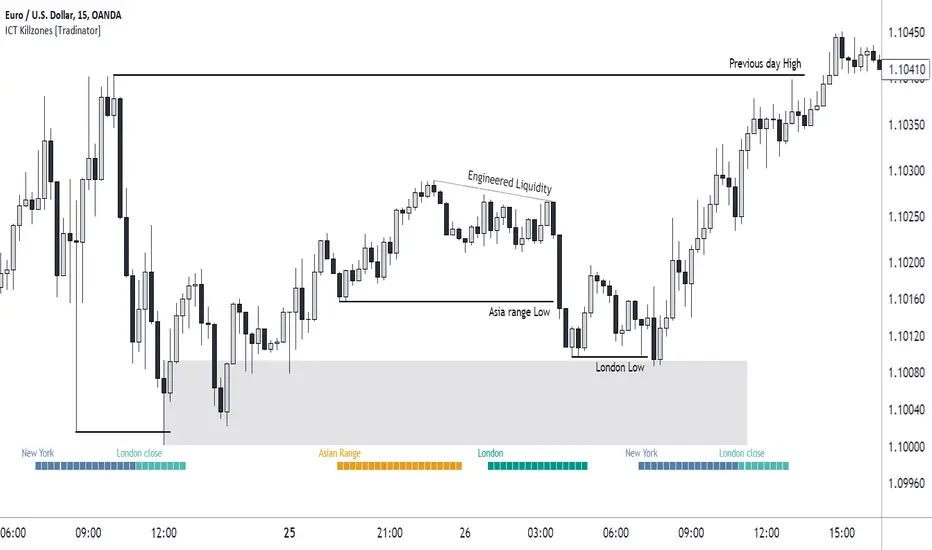
ICT Killzones [28Trades]Indicator plots weekdays and killzones of the most important trading sessions.
The times of each killzone come from the education material of Inner Circle Trader.
Asia killzone: 00:00 - 05:00
London open killzone: 07:00 - 10:00
New York killzone: 12:00 - 14:00
London close killzone: 15:00 - 17:00
GMT+0
It's not depended on your tradingview account timescale/setting, so the killzones always stay at the right place in the chart whether your timesetting is UTC or UTC+5.
It's made so that it automatically detects if a market is closed during weekends. Because of this, it works well for crypto as well as forex markets. The difference between this indicator and others is that this one is plotted on the actual chart instead of an oscillator below the chart, which gives a much cleaner chart in my opinion.
Settings:
Show day of week
show killzones
Hide indicator above specific timeframe
Choose where to display the weekdays or killzones, top or bottom of the chart
FencesThis is a simple script that plots horizontal grid on your chart using .x000 .x200 .x500 .x800 levels. Mike mentioned these levels in one of his videos.
Fences is only a semi-automatic indicator. You have to input the central point AND number of decimals yourself.
• Decimals are set to 3 but JPY pairs need it to be 1.
• Anchor point is the nearest level ending with three zeroes.
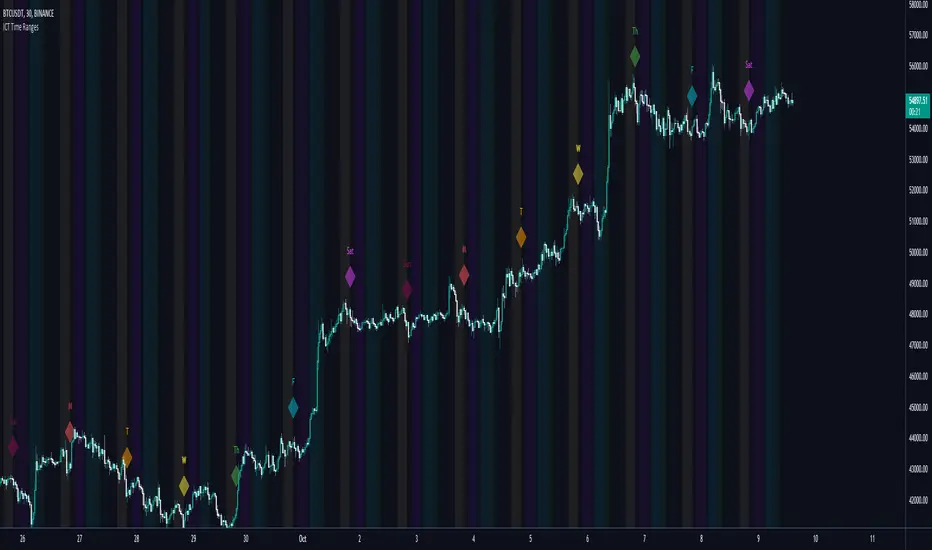
ICT Time RangesICT Time Ranges is a concept around the fact that price likes to show volatility spikes in certain times of the day.
Although there are many other scripts such as that revolve around this concept, the difference between this one and some of the others out there is the fact that this code specifically focuses on the ranges like New York, London, Asia, and ICTs concept behind having a "True Day Range". Also, prior scripts draw horizontal lines to delineate the High and Low of the Day. Although this is useful in some cases, I find it to clutter up the chart too much for my liking, so this script negates any of that and simply prints a box in the parameters given within the settings pop-up. This also allows you the fact of having a shape and letter(s) marker for when a new day starts at 0:00.
With this script, you can enable / disable times of the day for:
- London Session
- New York Session
- London Close Session
- Asia Session
- "IPDA" True Day
You can also change the times that these sessions will update to, along with the opacity and color that they print to mark out these times / ranges. The same can be said with the "Day of Week" markers, which can be color coded and show different shapes / formats to your liking.
I find that putting the Session boxes opacity to 7-8% and the day of week markers to 20% is best as this makes them visible enough to see while also keeping it easy on your eyes to analyze your charts.
Overall, this script was based around specific concepts I liked from other individuals' scripts such as @BryceWH and @AvniPiro , but that are tweaked to what I personally find as most beneficial. To see others scripts like this one, you can search for "ICT Killzones" in the public script library!
ICT Sessions [Killzones]This indicator was initially Created by @BryceWH.
Modification by @leonsholo
The indicator uses New York Time
I modified it to match my own criteria which includes:
- I adjusted the time zones.
- Added tags to the settings to make it easy to know which kill zones you are toggling on or off.
- Added the Asia session
- Added the London Close session
How The Indicator Works
Plots the Asia, London, New York and London Close Kill zone as overlay boxes using current daily high / lows.
Marked ranges will move as days range / high and low widens.
Middle fills can be turned on and off.
Colours can be changed to match your preference.
Created this indicator because I didn't like highlighting the whole chart background as seen in other ICT Kill zone indicators on trading view and wanted something visually clearer.
Boxes height can be changed. Positive number puts the box outside current days high and low, negative number puts box inside current days high and low.
" Adapted from Chris Moody's original indicator HLOC" - BryceWH

5 Day ADR ICT Intraday TrackerPretty self explanatory, this indicator tracks todays current range as a % of the 5 Day ADR.
This is most useful for finding entries and looking for exits intraday, ie: how much hypothetical room is there for a trade to run? looking for entries in yellow and orange zones, exiting in blue once the ADR is reached etc.
Reset variable should be used for the end of day close. For forex on Oanda its 1700. Probably a way to do this programatically, if its obvious let me know and i can update it.
Can be set to clip output above 110% once the daily ADR has been fulfilled - this can be turned on or off.
Experimental mode for finding consolidations, based on the ADR for each day not been fulfilled and contracting. can be good for finding pending range expansion.
Code is pretty ugly, feel free to tweak.
current known issues: Indicator doesnt work for many non forex pairs, due to coding laziness. Indicator does not work on 1 minute timeframe.
