Canadian Dollar Currency IndexCanadian Dollar Currency Index updates in real time and doesn't close like tradingview.com's currency indexes. Based off of the Bank of Canada's CEER methodology and tracks it quite closely, although not perfectly. It seems to be higher than the Bank of Canada's index by 2 points. This could be due to using different data for the currencies and as I am not proficient in PineScript, I don't think I was able to replicate the formula exactly...? Regardless ,it works well and is more than close enough to suit one's purpose of tracking the Canadian dollar against a basket of currencies that are weighted according to the Bank of Canada's total weights (The total weight of a country j in year t is a weighted average of the their import, export and third-market competition weights). For more information on the actual Bank of Canada's index: www.bankofcanada.ca
Index
Damping IndexThis indicator was originally developed by Curtis McKallip Jr. (Stocks & Commodities, V.10:7 (296-299): "The Damping Index").
It indentifies bars where the highs and lows are getting close and closer. A high Damping Index value means that the difference between the high price and low price is becoming lower and the security price is reaching equilibrium. A low Damping Index value means that the difference between the high and low prices is increasing.
Good luck and happy trading!
Fundstrat IndexesDisplays two of Fundstrat's Indexes as taken from TradingView.
Options to configure include displaying the first, second or both chosen indexes as well as a ratio of the two.
When comparing indexes, they're a bit "off", as data is not backfilled in consideration for initial index weighting. Feature not a bug?

Positive Volume IndexHello traders!
This indicator was originally developed by Paul L. Dysart in the 1930s and then described and popularized by Norman G. Fosback in his book "Stock Market Logic: A Sophisticated Approach to Profits on Wall Street"
Like and follow for more cool indicators!
Happy Trading!

Trader Set - Choppiness IndexFinally made this work as desired, time to publish another super useful script in the tool set for my methodology. This indicator easily shows when the market is moving as a CHOPPY market so that traders either don't take position or be very cautious with their positions.

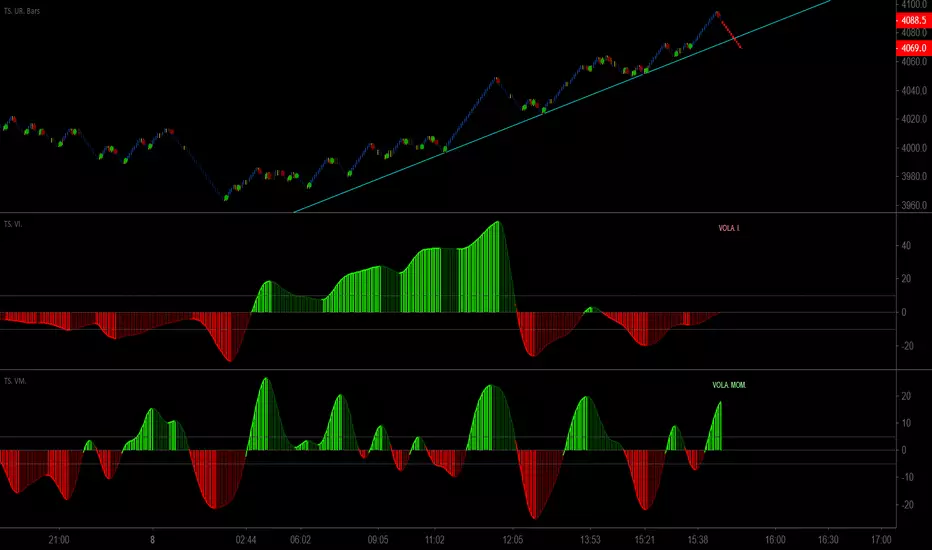
Trader Set - Volatility IndexOne of the last tools I forgot to publish till today. This is a Volatility Index Oscillator that uses a custom and original formula. This tool will be used hand in hand with's momentum one to easily identify the trend reversal points before it actually happens !
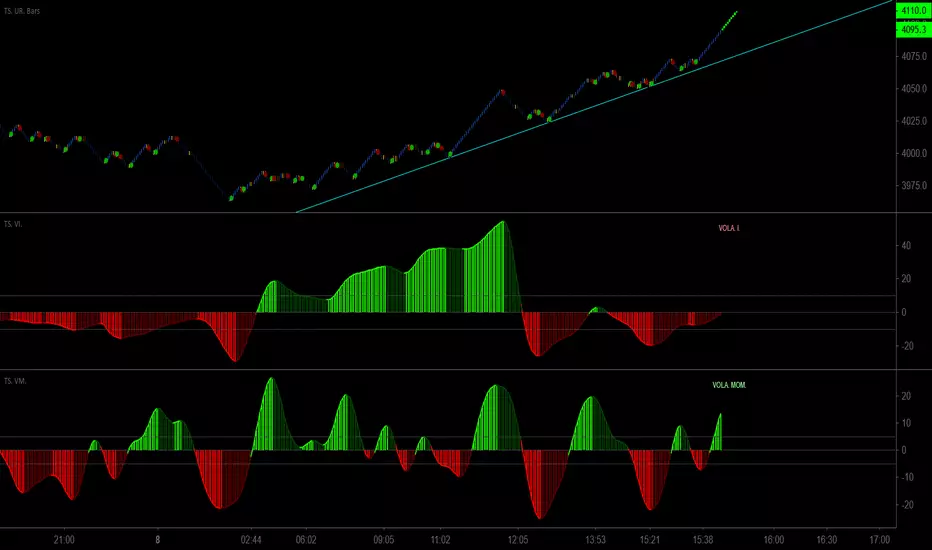
Trader Set - Volatility MomentumThis another one of the tools I missed publishing till today, this is a momentum indicator of volatility index (original formula), it will work hand in hand with volatility index oscillator (will publish right after this one) to easily identify divergences just before the market's direction change !
🥢Crypto-Sticks: Absolute Strength Index Osc. by Cryptorthyhms🥢Crypto-Sticks™: Absolute Strength Index Oscillator (Tudor Marcelin)
A new series of indicators brought to you by Cryptorhythms...giving you an alternate look at your trusted favorites! Follow me, there are still 2 dozen Crypto-Sticks indicators planned - all will be released in public library.
🚀Indicator Specific Info
New Crypto-Sticks option is an EMA of the average signal line output. Eventually I will go back and update the previous indicators with this feature as well!
Heiken Ashi candles (default) adds some more clear trend changing points. HA example here:
Volume weighting the HA candles adds a different dimension to the indicator which I have to explore more fully. VW
adds too much noise in my opinion, especially during periods of higher volatility. I left there in case you want to experiment. An example of VW+HA:
💭Please leave me any ideas or feedback you have!
🚫If you use volume weighting you should be on heiken candles.
🚀Crypto-Sticks General Info
🚧This series isnt polished 100%, and I have some more options I will add in the future. But for now, I want to just release them, as I am not sure when I will have the time to put more work into them (many other big projects I am working on).
📊Its basically reinterpretations of all your favorite indicators. I calculate the values a little bit differently than normal, but the end result is creating a candlestick chart (for the indicator!). Then I added the option to plot them as Heiken Ashi candles to smooth out noise and make signaling easier. I recommend using the indicator on this setting.
🔊Lastly I implemented a Volume Weighting system for them all which simply integrates volume into the formulas for these indicators. For the most part this feature is experimental and doesn't provide huge utility (yet - I have other ways I want to try it as well - just no time). Though on some of the indicators it already shows great promise.
👍Enjoying this indicator or find it useful? Please give me a like and follow! There are many more indicators to be released in this series, not to mention I post crypto analysis and other free indicators regularly.
💬Questions? Comments? Want to get access to an entire suite of proven trading indicators? Come visit us on telegram and chat, or just soak up some knowledge. We make timely posts about the market, news, and strategy everyday. Our community isnt open only to subscribers - everyone is welcome to join.

BITCOIN-INDEX- (*Beta Version*) _BTCXjust like the dollar index and any fiat currency index , this is Bitcoin index , But this is still Beta Version and just Demo

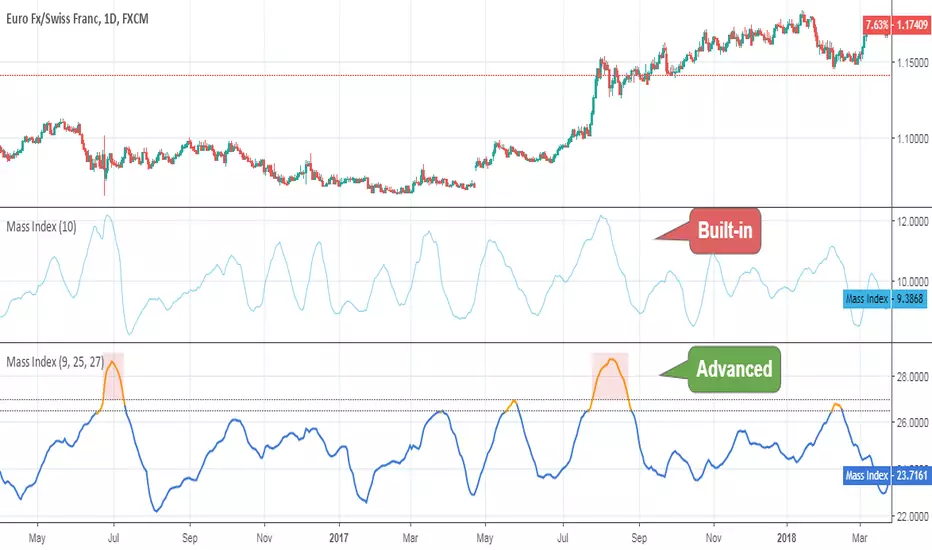
Mass IndexThis indicator was originally developed by Donald Dorsey (Stocks & Commodities, V.10:6 (June, 1992): "The Mass Index").
Specially for @AlexMayorov :
If indicator reaches 27 and then falls to below 26.5 then it could be a signal of potential trend reversal.
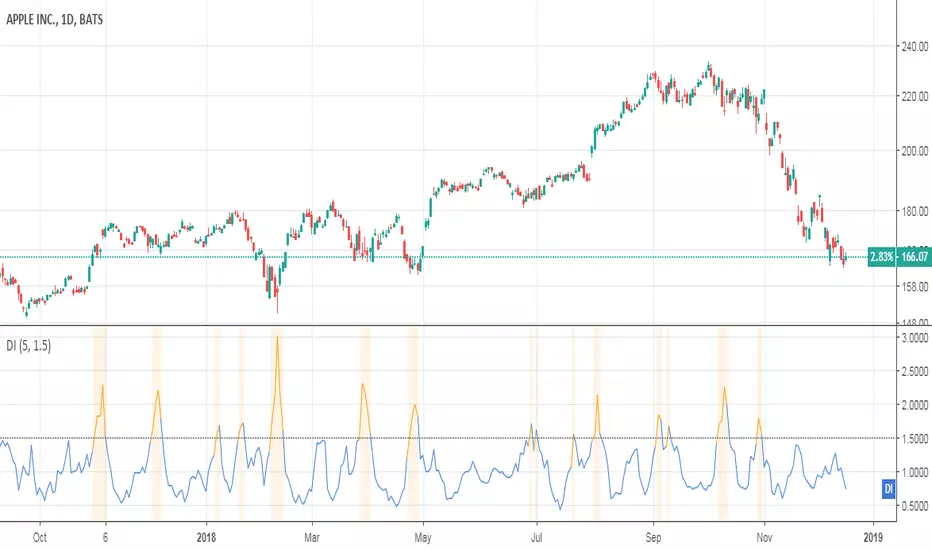
Ultimate Strength Index (USI),Stoch Multi Time Frame(MTF)[cI8DH]Ultimate Strength Index ( USI ) adds stochastic, multi time frame, signal line, histogram, and bar coloring options to RSI and Absolute Strength Index ( ASI ) . It can also turn into an indicator similar to Awesome Oscillator/MACD line. This indicator can be used for analyzing momentum and trendiness/choppiness, as well as identifying swings (stoch). The fix applied in True RSI is also applied here. Chart below shows example multi-TF setup with bar coloring.
For analyzing volume, I made a similar indicator based on money flow and accumulation/distribution, which you can find in the link below.
Aggregation Method
aggregation method = MA Percent => True RSI: momentum and divergence, failure swings
aggregation method = MA => Absolute Strength Index: accurate momentum and divergence
aggregation method = Cumulative => Awesome Oscillator alternative : momentum and divergence, twin peaks, ... (set the smoothing to 5 and signal length to 29ish)
Smoothing, signal line and histogram to detect trend and choppiness
You can apply additional smoothing to USI . Also, you can add a signal line and histogram (histogram is the difference between main line and signal line). To do so, set the signal length to a number greater than one. Signal line can help you detect changes in trend similar to the signal line on MACD. If signal line criss-crosses USI , it shows market is choppy. The worst case is when this criss-crossing coincides with USI flattening near neutral line and histogram height is relatively short; that means market is ded (until it is not; expansion following a contraction period is a common phenomena)! (Bear in mind that histogram will be hidden in stoch mode, and main and signal lines will be hidden in cumulative mode)
Stochastic
To enable stoch, change the stoch length to a number greater than 1 (default stoch length for the built-in RSI stoch is 14). This length should be calibrated depending on TF and asset. If done correctly, it can be a powerful tool for identifying swings. Stoch can be combined with any aggregation method. I recommend using stoch with MA aggregation (i.e. ASI ). For conventional uses of stochastic, please read www.tradingview.com(STOCH) and www.tradingview.com(STOCH_RSI).
Experimental Bar coloring Feature
There is an option to color bars depending on USI's position relative to the signal line. If both TFs are used in coloring and they are in disagreement, the TF with greater histogram height wins. There are two shades of green and red. The darker shade means both TFs agree. If you use the signal line, bar coloring can help with calibrating the indicator (play with parameters until you see a good looking chart i.e. a lot of green candles followed by a lot of red candles in a row). Please note that bar colors might change until candle(s) close(s). The bar coloring rules will most likely change in the future.
Notes
- Smooth MA length N = EMA length 2*N-1
- With correct settings, you can also create an alternative to normalized MACD line in the cumulative mode.
True RSI
Absolute Strength Index
Please give a like, and share the interesting configurations you find in the comments.

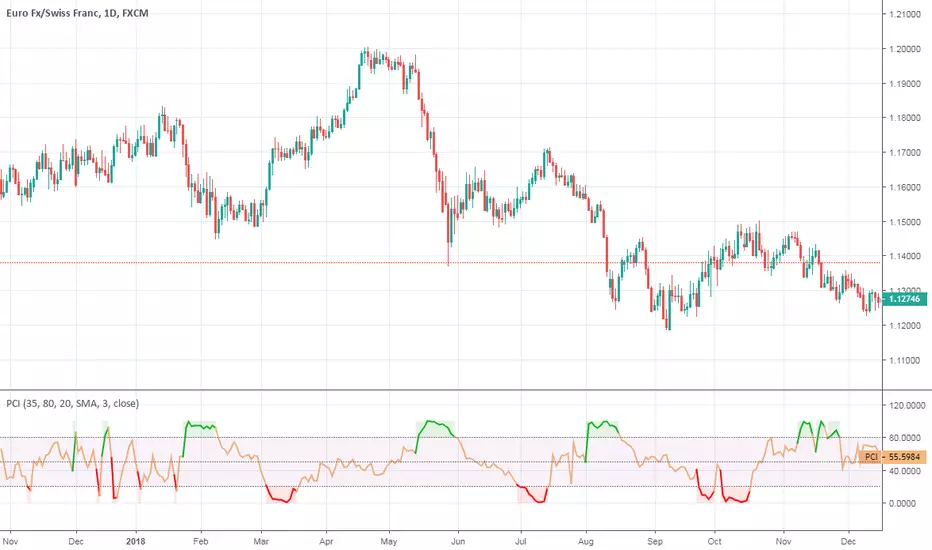
Phase Change IndexPhase Change Index script.
This indicator was developed and described by M. H. Pee (Stocks & Commodities V.22:5 (28-37): Phase Change Index).
Other indicators of M. H. Pee:
Compare currency against multiple (Basket of currencies)Early version of a script to compare one currency against multiple to get an index.
Default values loaded basically make something along the lines of, "USD global exchange rate"
I plan on making this less clunky/messy in future with respect to the coding and the user inputs. Works 100% right now though.
.BXBT Bitcoin Price Index for BitMEX - Gyro.BXBT script as seen on the BitMEX built-in chart.
This is not created by, authorized by or in any type of affiliation with BitMEX whatsoever.
This is not financial advice. Use at your own risk.
Tips are appreciated if you find this useful:
BTC: 15BtFGxY8Q4jybcnpVAc3r8yJDyRrPre1n
LTC: LhR5LW8qQ5byZvYkUeRR4njBDTxtCZynuk
Thanks

Average Directional Index-BuschiA simple modification of the built-in "Average Directional Index":
To identify wether there is an uptrend or a downtrend, the function color is conditional:
no trend: black
small uptrend (weak threshold): light green
big uptrend (strong threshold): green
small downtrend (weak threshold): light red
big downtrend (strong threshold): red

Shadow Index by WentalThe indicator shows the ratio of the upper and lower shadows of the candlestick chart.

Stoch Money Flow (ADMF) & Absolute Strength Index (ASI) [cI8DH]This indicator can apply my previous indicator, Historical and Standard Stochastic, to Money Flow (ADMF) or Absolute Strength Index (ASI) or both at the same time. It can also display those two indicators in regular mode as well as showing visual cues when the indicators make new ATH or ATL.
ASI is basically a new name I am giving to my Gain/Loss Moving Average indicator. If you normalize ASI with the moving average of all the changes in price, it becomes identical to RSI. So ASI is basically non-normalized RSI, that is why it should be a more accurate representation of price momentum.
ADMF is an accumulation/distribution and money flow momentum indicator. Both ASI and ADMF are not range-bound so it is not easy to compare them against each other. When stochastic equation is applied to them, they both become range-bound and comparable. The gaps between the two indicator can reveal valuable information about market dynamics. The chart below shows some examples (note the settings).
For conventional usages of stochastic, please read www.tradingview.com(STOCH) and www.tradingview.com(STOCH_RSI). I recommend you to find the optimal length by playing with the stoch length in the indicator settings. If this parameter is calibrated properly, this indicator can be a powerful tool for identifying market cycle.
You can get these features ( ATH , ATL detection and historical stochastic) for any other indicator using the script below:

RSI Divergence Smoothed with Signal Line and Power ZonesThis Indicator plots Regular and Hidden Divergences lines for an RSI smoothed by an EMA and for its Signal Line
The RSI can be set to change colour with direction or can be set as single colour
Colour Changing RSI helps when trading Multiple Timeframes as you can look for confluence in the direction of RSI
The divergence script is thanks to @RicardoSantos, I've just adjusted it to suite my indicator
Remember that divergences work best when traded with the trend or very late in a trend when going against the trend
I have also added a Colour Changing Signal Line & Hima Reddy's Power Zones so now you can also
Take full advantage of trading; signal line crosses, 50 crosses and Power Zone RSI support and resistance

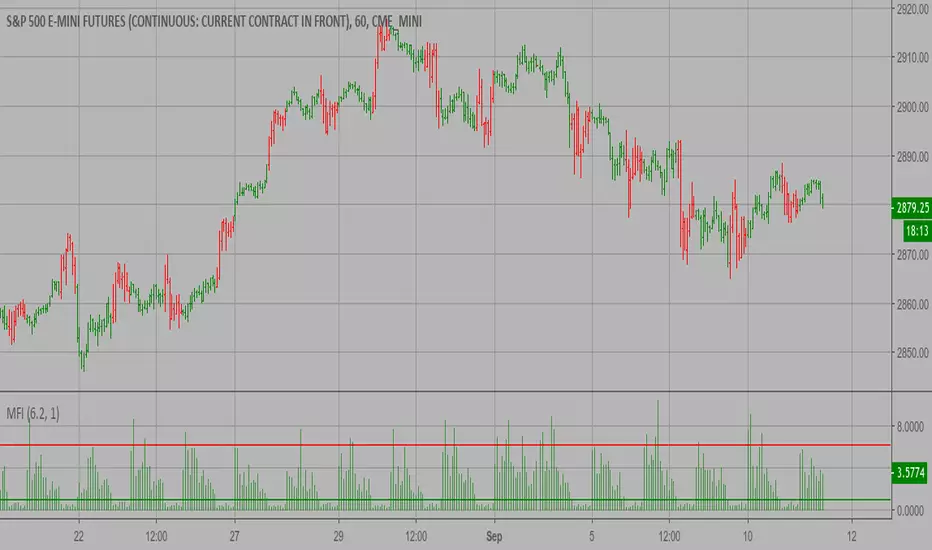
Market Facilitation Index (MFI) Strategy The Market Facilitation Index is an indicator that relates price range to
volume and measures the efficency of price movement. Use the indicator to
determine if the market is trending. If the Market Facilitation Index increased,
then the market is facilitating trade and is more efficient, implying that the
market is trending. If the Market Facilitation Index decreased, then the market
is becoming less efficient, which may indicate a trading range is developing that
may be a trend reversal.
WARNING:
- This script to change bars colors.
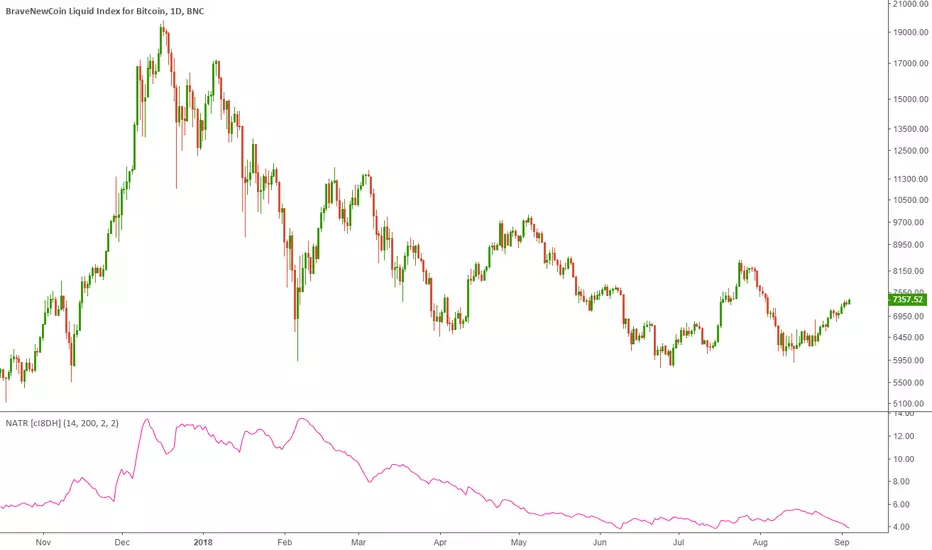
Normalized Average True Range (NATR) (Volatility) [cI8DH]As you can see in the chart below, regular ATR is not useful for long term analysis. Normalizing it, fixes the issue. This indicator can be used to measure absolute volatility. It has a built-in stochastic as well for relative volatility. ATR counts high and low in the equation unlike Bolinger Band Width.
Stochastic:
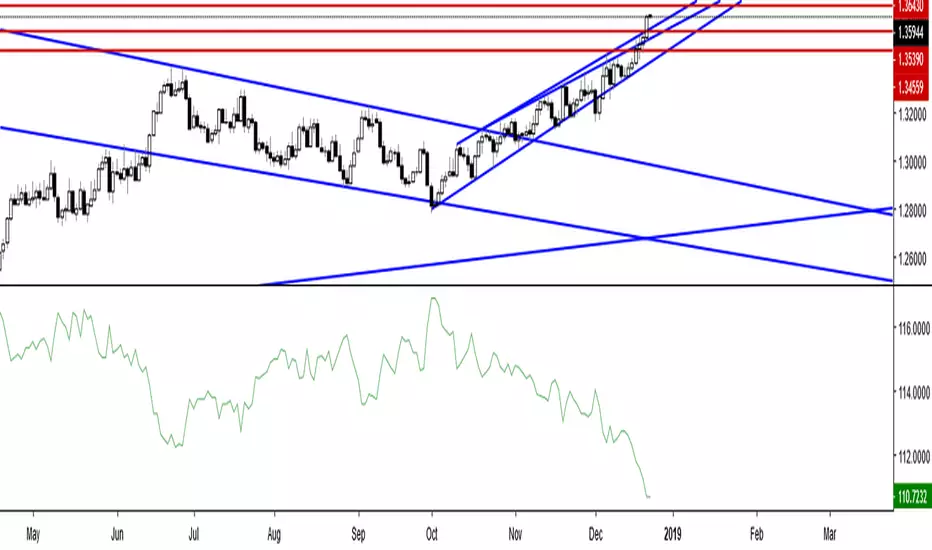
OJLJ Synthetic CAD IndexThis script uses information of the principal CAD pairs to create an Index:
(X). We can see a difference between the CAD INDEX force that has decrease a lot and it means that CAD will raise again, making AUDCAD to go down
(Y). The AUDCAD chart has problems with it trend but we can be more confident about the trend if we look at the CAD INDEX trend were we can see a down trend
The mathematic methodology is private, but it uses percentile changes to be calculated and I have made some tests to make sure that results work perfectly fine, If you want to know more about the calculation or the test I have made, please send me a message
This indexes offer a way to:
+ Measure changes in an economy without being compared with another as the Forex pairs do
+ Analyze macroeconomic variables in the exchange rate of a determinate economy
+ Use candles instead of lines
+ The script have an input option were you can decide if use wicks or not (Not recomendable)
+ White color means it goes up while red means it goes down
+ The script works perfectly with all the time frames
+ Itcan be used with all the Forex pairs that include CAD
Because of all the data used to be calculated this script normally compile after 10-20 seconds
I thought a lot about it and I did a lot of tests, Technical Indicators don’t work the same way that Forex, this index were created and published principaly for users who have more interest in the Fundamental analysis but It can be useful for everyone
Do you like this Index or have any Ideas ? Please let me know with a comment :)

OJLJ Sintetic EUR IndexThis script uses information of the principal EUR pairs to create an Index:
(). Look at the increase in the EUR INDEX, it is very good and stable while the EURCHF pair is having problems
(X). While EURCHF goes down slowly, we can see that the real EUR force is not growing but it is not going down, is just stable
(Y). The EURCHF goes down rapidly, but we dont see the same effect on the EURCHF chart, this means that the CHF force increase is not the enough strong to make the EUR INDEX to go down
The mathematic methodology is private, but it uses percentile changes to be calculated and I have made some tests to make sure that results work perfectly fine, If you want to know more about the calculation or the test I have made, please send me a message
This indexes offer a way to:
+ Measure changes in an economy without being compared with another as the Forex pairs do
+ Analyze macroeconomic variables in the exchange rate of a determinate economy
+ Use candles instead of lines
+ The script have an input option were you can decide if use wicks or not (Not recomendable)
+ White color means it goes up while red means it goes down
+ The script works perfectly with all the time frames
+ Itcan be used with all the Forex pairs that include USD
Because of all the data used to be calculated this script normally compile after 10-20 seconds
I thought a lot about it and I did a lot of tests, Technical Indicators don’t work the same way that Forex, this index were created and published principaly for users who have more interest in the Fundamental analysis but It can be useful for everyone
Do you like this Index or have any Ideas ? Please let me know with a comment :)
OJLJ Sintetic USD IndexThis script uses information of the principal USD pairs to create an Index:
(A). USDCAD chart is going up very fast, but If we see the USD INDEX we can see that the dollar is not doing the same.
(X). While USDCAD chart goes up with problems making investors to be afraid of a change the USD INDEX shows a normal and very stable increase
(Y). The USDCAD chart shows an importante decrease but after some time it goes to the initial position, the USD INDEX dont go down because the dollar force is the same, this means that the canadian dollar force has increase too
The mathematic methodology is private, but it uses percentile changes to be calculated and I have made some tests to make sure that results work perfectly fine, If you want to know more about the calculation or the test I have made, please send me a message
This indexes offer a way to:
+ Measure changes in an economy without being compared with another as the Forex pairs do
+ Analyze macroeconomic variables in the exchange rate of a determinate economy
+ Use candles instead of lines
+ The script have an input option were you can decide if use wicks or not (Not recomendable)
+ White color means it goes up while red means it goes down
+ The script works perfectly with all the time frames
+ Itcan be used with all the Forex pairs that include USD
Because of all the data used to be calculated this script normally compile after 10-20 seconds
I thought a lot about it and I did a lot of tests, Technical Indicators don’t work the same way that Forex, this index were created and published principaly for users who have more interest in the Fundamental analysis but It can be useful for everyone
Do you like this Index or have any Ideas ? Please let me know with a comment :)
