Hull AMA SignalsThis script is a comprehensive trading indicator named "Hull AMA Signals", which combines AMA and HSO by LuxAlgo and ther video based strategy techniques to provide buy (long) and sell (short) signals. It overlays directly on the price chart, offering a dynamic and visually intuitive trading aid. The core components of this indicator are Adaptive Moving Averages (AMA), Hull Moving Average (HMA), and a unique Hull squeeze oscillator (HSO), each configured with customizable parameters for flexibility and adaptability to various market conditions.
Features and Components
Adaptive Moving Averages (AMA): This indicator employs two sets of AMAs, each with distinct lengths, multipliers, lags, and overshoot parameters. The AMAs are designed to adapt their sensitivity based on the market's volatility, making them more responsive during significant price movements and less prone to false signals during periods of consolidation.
Hull Moving Average (HMA): The HMA is calculated using a sophisticated algorithm that aims to reduce the lag commonly associated with traditional moving averages. It provides a smoother and more responsive moving average line, which helps in identifying the prevailing market trend more accurately.
Hull Squeeze Oscillator (HSO): A novel component of this indicator, the HSO, is designed to identify potential market breakouts. It does so by comparing the Hull Moving Average's direction and momentum against a dynamically calculated mean, generating bullish or bearish signals based on the crossover and divergence from this mean.
Buy (Long) and Sell (Short) Signals: The script intelligently combines signals from the AMA crossovers and the Hull squeeze oscillator to pinpoint potential buy and sell opportunities. Bullish signals are generated when there's a positive crossover in the AMAs accompanied by a bullish dot from the HSO, whereas bearish signals are indicated by a negative crossover in the AMAs along with a bearish dot from the HSO.
Customization and Style Options: Users have the ability to adjust various parameters such as the length of the moving averages, multipliers, and source data, enabling customization for different trading strategies and asset classes. Additionally, color-coded visual elements like gradients and shapes enhance the readability and instant recognition of trading signals.
Use Cases
Trend Identification: By analyzing the direction and position of the AMAs and HMA, traders can easily discern the prevailing market trend, helping them to align their trades with the market momentum.
Signal Confirmation: The combination of AMA crossovers and HSO signals provides a robust framework for confirming trade entries and exits, potentially increasing the reliability of the trading signals.
Volatility Adaptation: The adaptive nature of the AMAs and the dynamic calculation of the HSO mean allow this indicator to adjust to changing market volatility, making it suitable for a wide range of market environments.
This indicator is suitable for traders looking for a comprehensive and dynamic technical analysis tool that combines trend analysis with signal generation, offering both visual appeal and practical trading utility.
Hull Moving Average (HMA)

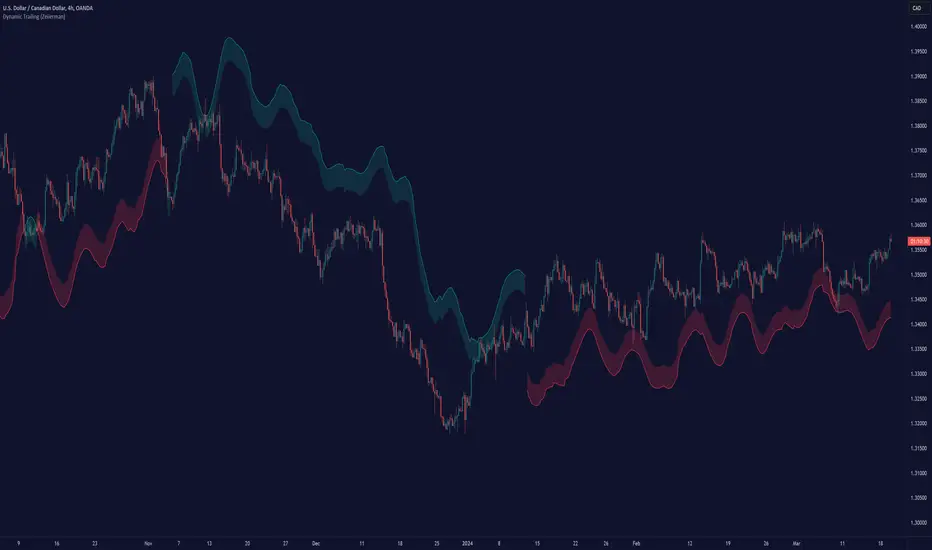
Dynamic Trailing (Zeiierman)█ Overview
The Dynamic Trailing (Zeiierman) indicator enhances the traditional SuperTrend approach by providing a more nuanced, adaptable tool for trend analysis and market volatility assessment. It combines techniques to identify dynamic support and resistance levels, trend directions, and market volatility. By integrating the Average True Range (ATR) with a unique multiplier system and smoothing mechanisms, this indicator offers a nuanced approach to trend-following strategies, making it a valuable asset for traders looking to leverage SuperTrend methodologies with additional insights into market dynamics.
█ How It Works
At its core, this indicator builds on the traditional SuperTrend formula by utilizing a modified ATR calculation to define the deviation for dynamic support and resistance levels. These levels are dynamically adjusted based on market volatility. The innovation lies in the addition of the Hull Moving Average (HMA) and the Triple Exponential Moving Average (TEMA) for an enhanced smoothing effect, making the indicator's trend signals more reliable and less prone to market noise. The trend direction is determined by comparing the closing price with the dynamic levels, facilitating clear bullish or bearish signals.
The indicator incorporates a 'Supertrend' function, which uses the dynamic levels and the price’s position relative to them to determine the trend direction. This determination is visualized through color-coded lines and a cloud zone, which expands or contracts based on the ATR and a user-defined width setting, illustrating the market's volatility and trend strength.
ATR Calculation: Utilizes the Average True Range (ATR) to measure market volatility. The ATR is a cornerstone of this indicator, helping to dynamically adjust the support and resistance levels according to the market’s changing conditions.
Supertrend Calculation: Implements a supertrend formula that combines the ATR with user-defined multipliers to plot potential trend directions. This feature helps in identifying whether the market is in an uptrend or downtrend, offering visual cues for potential reversals.
TEMA Calculation: Employs the Triple Exponential Moving Average (TEMA) through a Hull Moving Average (HMA) calculation to smooth out price data. This smoothing process helps in reducing market noise and makes the trend direction clearer.
Dynamic Support and Resistance: Calculates dynamic support and resistance levels by applying a deviation (derived from the ATR and user-defined multiplier) to the smoothed price data. These levels adapt to market conditions, providing areas where price might experience support or resistance.
Trend and Cloud Calculation: Determines the overall trend direction and plots a 'Cloud' zone around it, which adjusts in width based on the ATR and a user-defined cloud width setting. This cloud acts as a visual buffer, indicating the strength and stability of the current trend.
█ How to Use
Trend Identification: The primary function of this indicator is to help traders quickly identify the prevailing market trend. A change in the color of the dynamic trailing line or its position relative to the price can signal potential trend reversals.
Dynamic Support and Resistance: Unlike static levels, the dynamic levels adjust with market conditions, providing current areas where the price might experience support or resistance.
Dynamic Support
Dynamic Resistance
█ Settings
Mult (Multiplier): Adjusts the multiplier for the ATR calculation, affecting the deviation distance for support and resistance levels. Higher values decrease sensitivity and vice versa.
Len (Length): Sets the period for the HMA in the TEMA calculation, influencing the indicator's responsiveness to price changes.
Smoothness: Determines the smoothness of the dynamic support and resistance lines by setting the SMA length. Higher values result in smoother lines.
Cloud Width : Modifies the width of the cloud, providing a visual representation of market volatility.
Color Settings (upcol and dncol): Allows users to customize the colors of the indicator's lines and cloud, aiding in visual trend identification.
-----------------
Disclaimer
The information contained in my Scripts/Indicators/Ideas/Algos/Systems does not constitute financial advice or a solicitation to buy or sell any securities of any type. I will not accept liability for any loss or damage, including without limitation any loss of profit, which may arise directly or indirectly from the use of or reliance on such information.
All investments involve risk, and the past performance of a security, industry, sector, market, financial product, trading strategy, backtest, or individual's trading does not guarantee future results or returns. Investors are fully responsible for any investment decisions they make. Such decisions should be based solely on an evaluation of their financial circumstances, investment objectives, risk tolerance, and liquidity needs.
My Scripts/Indicators/Ideas/Algos/Systems are only for educational purposes!
Cauchy Distribution Trend AnalysisThis custom Pine Script indicator is designed to analyze assets, including cryptocurrencies, through a lens inspired by the Cauchy distribution's characteristics. It focuses on identifying potential long and short opportunities by evaluating the asset's price position relative to a dynamically calculated median price and a scale parameter. Here's a breakdown of its components and how to use it:
Components
Median Length: The period over which the median price is calculated. The median price acts as a proxy for the Cauchy distribution's location parameter, representing a central value around which the market price fluctuates.
MA Length: The length for calculating the moving average, which is used to determine the scale parameter. The scale parameter estimates the average volatility around the median price, adjusted for the selected averaging method.
Moving Average Type: Offers a choice between HMA (Hull Moving Average), SMA (Simple Moving Average), and EMA (Exponential Moving Average) to calculate the scale parameter. This flexibility allows users to tailor the sensitivity of the scale parameter to the asset's price volatility.
Median Price Calculation: Uses the close price (by default) to calculate the median price over the specified period.
Scale Parameter Calculation: A function that calculates the scale parameter based on the chosen average source. This parameter is used to identify the threshold for long and short conditions.
Strategy Logic
Long Condition: Triggered when the asset's close price is greater than the sum of the median price and the scale parameter. This indicates that the asset's price has moved significantly above the median price, suggesting bullish momentum.
Short Condition: Triggered when the asset's close price is less than the difference between the median price and the scale parameter. This indicates that the asset's price has moved significantly below the median price, suggesting bearish momentum.

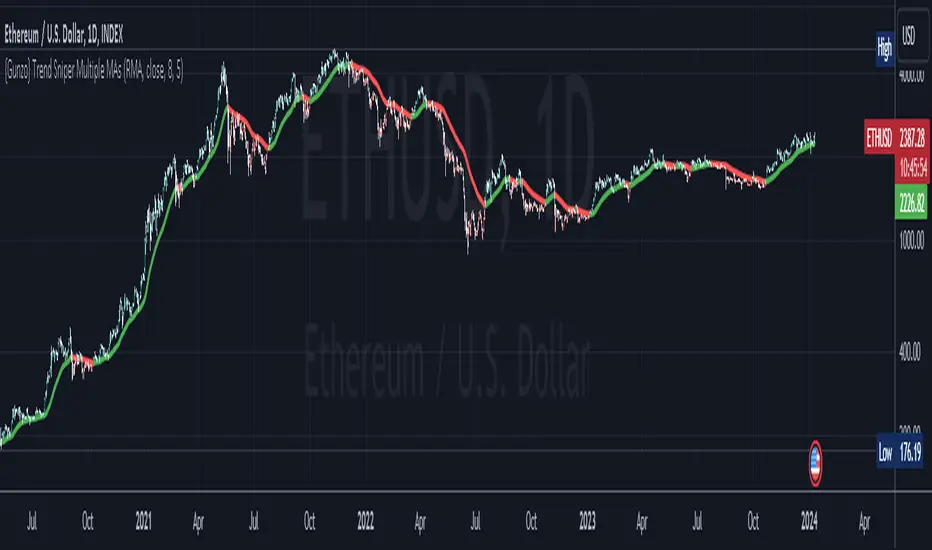
{Gunzo} Trend Sniper (Multiple MAs with coefficient)Updated GUNZO's Trend Sniper script by adding in different MA types to choose from. This can help reduce false signals and sharpen the trend reversal points.
Here's a summary of the key changes:
1. Multiple Moving Average Types: The original script was focused solely on the Weighted Moving Average (WMA) with a coefficient. The updated script introduces flexibility by allowing users to choose from a variety of Moving Average types, including WMA, VWMA (Volume Weighted Moving Average), EMA (Exponential Moving Average), SMA (Simple Moving Average), HullMA (Hull Moving Average), TEMA (Triple Exponential Moving Average), DEMA (Double Exponential Moving Average), T3, and RMA (Running Moving Average).
2. Coefficient Integration: In the original script, the coefficient was specifically designed for the WMA calculation. The updated script extends this concept to all the selected Moving Average types. This coefficient is applied differently depending on the type of MA, often affecting the length of the MA calculation.
3. Dynamic Length Calculation: For MAs that traditionally use an integer length (like SMA, EMA, etc.), the updated script calculates this length dynamically by multiplying the user-defined length by the coefficient and then rounding it to the nearest integer. This ensures compatibility with Pine Script's requirements for these functions.
All credits to GUNZO
original script:
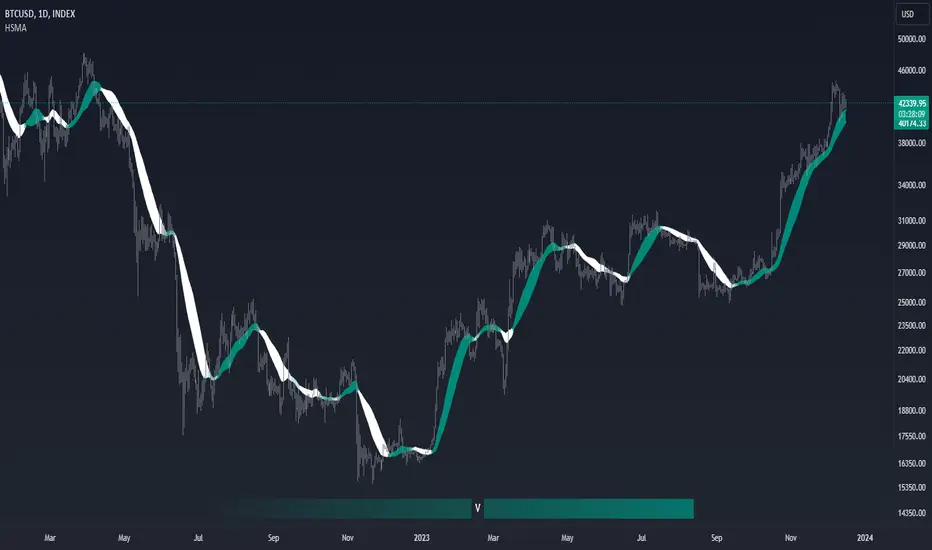
Trend Strength GaugeTrend Strength Gauge with Modified Hull Moving Average (HMA)
Overview:
The indicator combines a modified Hull Moving Average (HMA) with a visual gauge that represents the strength and direction of the current trend. This helps traders quickly assess the trend's vigor and direction.
Key Features:
Modified Hull Moving Average (HMA):
Purpose: The HMA is a smoothed moving average designed to reduce lag and provide more responsive trend signals.
The indicator displays two HMA line and SMA line on the chart and fill color between them
based on HMA is above SMA or not.
Trend Strength Gauge:
Visualization: Below the chart, there's a gauge represented by gradient line gauge with "V" symbol.
The gauge line change color based on the direction of the trend.
Additionally, symbol "V" moves from solid color to transparent, indicating the trend's strength gradient.
Up Trend:
Dn Trend:
Trend Assessment:
When "V" at the strong teal collor it represents a strong positive trend (uptrend).
When "V" at the strong white collor it Indicates a strong negative trend (downtrend).
Arrow Movement: The symbol 'V' transitions from a solid color (teal or white) to a more transparent shade based on the strength of the trend.
Usage:
Trend Confirmation: Traders can use this indicator to confirm trends and assess their strength before making trading decisions.
Entry/Exit Points: The changing colors and transparency levels of the 'V' symbols can assist in identifying potential entry or exit points.
Can be used as a simple Hull indicator
This combined indicator simplifies trend analysis by offering an easily understandable visual representation of trend strength and direction.
Remember, while indicators are valuable tools, successful trading requires a comprehensive approach that incorporates multiple sources of information and risk management strategies.
Always exercise caution, apply critical thinking, and consider the broader market context when using indicators to make informed trading decisions.
Choose Symbol, Mode with HullThis Pine Script code is designed to create a customizable indicator on the TradingView platform. Below is an introduction to its features and purpose:
Introduction:
This script serves as a versatile indicator on TradingView, allowing users to choose between different modes (Heikin-Ashi, Linear, and Normal) and apply a Hull Moving Average (Hull) for trend analysis. The primary features include mode selection, the choice of using different calculation methods, and the option to incorporate the Hull Moving Average for enhanced trend visibility.
Key Features:
Mode Selection:
Users can choose between "Heikin-Ashi," "Linear," or "Normal" modes, influencing how the open, high, low, and close prices are calculated.
Hull Moving Average:
The script incorporates the Hull Moving Average (Hull) to provide a smoothed trend line for better trend identification.
Calculation Methods:
Users can select different calculation methods for the open, high, low, and close prices, including Simple Moving Average (SMA), Exponential Moving Average (EMA), Smoothed Moving Average (SMMA or RMA), Weighted Moving Average (WMA), and Volume Weighted Moving Average (VWMA).
Customizable Lengths:
Length parameters are customizable, allowing users to adjust the period lengths for the Hull Moving Average and other calculation methods.
Buy and Sell Signals:
Buy and sell signals are generated based on crossovers and crossunders between the Hull Moving Average and the price. These signals are visually displayed on the chart with corresponding labels.
Color-Coding:
The script utilizes color-coding to distinguish between bullish (lime) and bearish (red) trends, making it easier for users to identify potential changes in market direction.
Customizable Symbol and Resolution:
Users have the option to choose a specific trading symbol and resolution for analysis.
Important Note:
This script is provided for educational purposes and does not constitute financial advice. Traders and investors should conduct thorough research and analysis before making any trading decisions. Additionally, customization options should be explored to align the script with individual trading preferences.

Hull WavesThe Hull Waves indicator is based on the Hull Moving Averages (HMA), which are special moving averages that stand out for their ability to filter out market noise and offer a clearer view of price trends. Compared to traditional moving averages, HMAs are more responsive yet smoother, allowing traders to capture significant price movements without getting overwhelmed by short-term fluctuations.
The HMAs integrated into Hull Waves provide two distinct perspectives on the price trend:
8-period HMA: This short-term HMA is extremely reactive and closely follows price changes. It is ideal for capturing short-term trading signals while the medium-term 21-period HMA offers a more balanced view of price trends and identifies medium-term trends.
By crossing HMAs, traders can efficiently identify trend reversal points or strong market continuations.
Another feature of the indicator is the “fan” of dynamic lines, which acts as a visual float for price candles, allowing traders to quickly evaluate trading opportunities.
The "fan" or float of dynamic lines represents a visual representation of the candle's price movements. These lines extend from the start point to the end point, like an open fan. This visual approach makes the market dynamics immediately evident.
Strategy:
Long Entry Signal (Buy):
When the Hull Waves range shows a series of upward sloping lines and the Hull Moving Averages (e.g. 8-period HMA) crosses the 21-period HMA upwards, it is a long entry signal.
Confirmation of the signal can come from an increase in trader volume or other supporting indicators.
Place a buy order at the next closing price.
Short Entry Signal (Sell):
When the Hull Waves range shows a series of downward sloping lines and the Hull Moving Averages (e.g. 8-period HMA) crosses the 21-period HMA downward, it is a short entry signal.
Confirm the signal with an increase in trader volume or other relevant indicators.
Place a sell order at the next closing price.
Exit Signal (Closing a Position):
To close a long position, wait for a signal reversal, such as the Hull Moving Averages crossing downwards or a change in the Hull Waves range.
To close a short position, wait for a signal reversal, such as the Hull Moving Averages crossing higher or a change in the Hull Waves range.

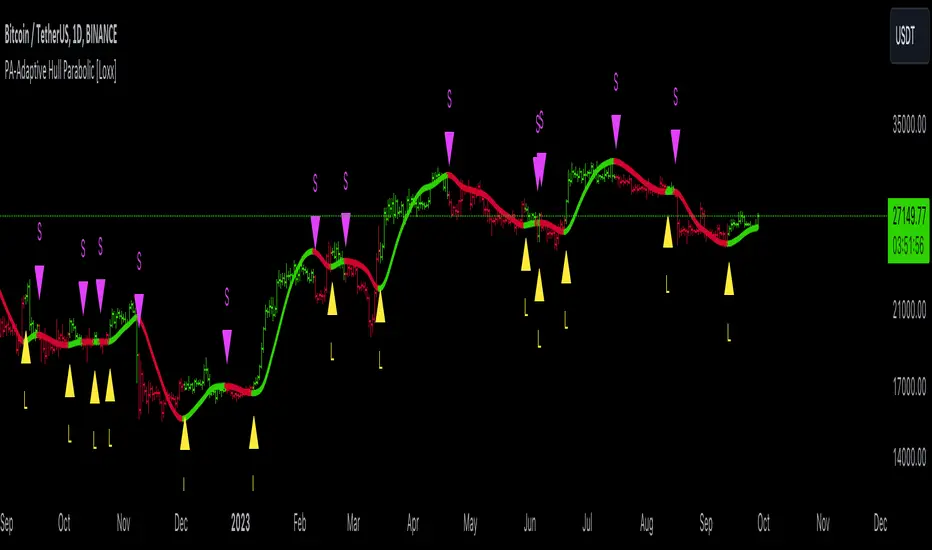
PA-Adaptive Hull Parabolic [Loxx]The PA-Adaptive Hull Parabolic is not your typical trading indicator. It synthesizes the computational brilliance of two famed technicians: John Ehlers and John Hull. Let's demystify its sophistication.
█ Ehlers' Phase Accumulation
John Ehlers is well-known in the trading community for his digital signal processing approach to market data. One of his standout techniques is phase accumulation. This method identifies the dominant cycle in the market by accumulating the phases of individual cycles. By doing so, it "adapts" to real-time market conditions.
Here's the brilliance of phase accumulation in this code
The indicator doesn't merely use a static look-back period. Instead, it dynamically determines the dominant market cycle through phase accumulation.
The calcComp function, rooted in Ehlers' methodology, provides a complex computation using a digital signal processing approach to filter out market noise and pinpoint the current cycle's frequency.
By measuring and adapting to the instantaneous period of the market, it ensures that the indicator remains relevant, especially in non-stationary market conditions.
Hull's Moving Average
John Hull introduced the Hull Moving Average (HMA) aiming to reduce lag and improve smoothing. The HMA's essence lies in its weighted average computation, prioritizing more recent prices.
This code takes an adaptive twist on the HMA
Instead of a fixed period, the HMA uses the dominant cycle length derived from Ehlers' phase accumulation. This makes the HMA not just fast and smooth, but also adaptive to the dominant market rhythm.
The intricate iLwmp function in the script provides this adaptive HMA computation. It's a weighted moving average, but its length isn't static; it's based on the previously determined dominant market cycle.
█ Trading Insights
The indicator paints the bars to represent the immediate trend: green for bullish and red for bearish.
Entry points, both long ("L") and short ("S"), are presented visually. These are derived from crossovers of the adaptive HMA, a clear indication of a potential shift in the trend.
Additionally, alert conditions are set, ready to notify a trader when these crossovers occur, ensuring real-time actionable insights.
█ Conclusion
The PA-Adaptive Hull Parabolic is a masterclass in advanced technical indicator design. By marrying John Ehlers' adaptive phase accumulation with John Hull's HMA, it creates a dynamic, responsive, and precise tool for traders. It's not just about capturing the trend; it's about understanding the very rhythm of the market.
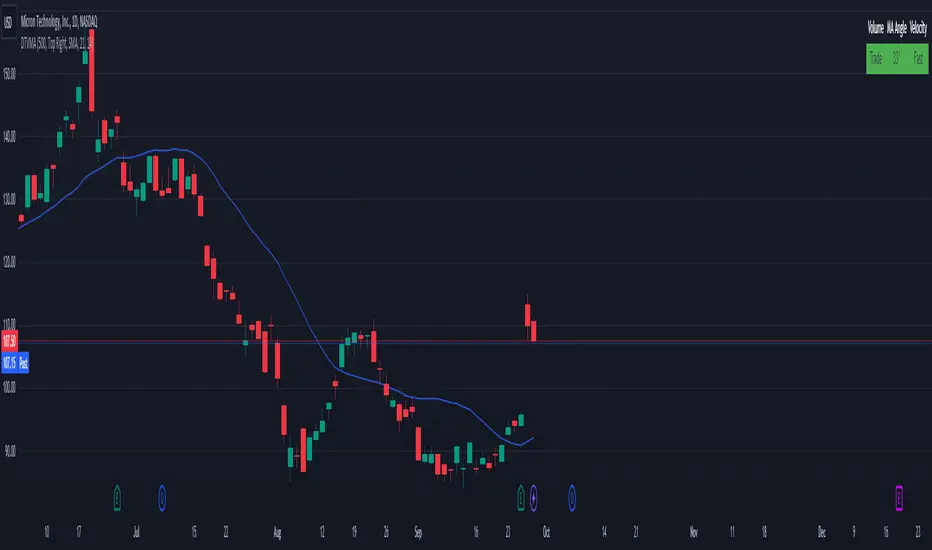
Display Trade Volume with MA Angle and Price VelocityThis Pine Script indicator is designed to provide traders with a visual representation of trade volume, moving average (MA) angle, and price velocity on a chart. The primary components of this indicator are:
Trade Volume: The indicator compares the current bar's trade volume with the average volume over a user-defined lookback period. The volume is displayed as either "Low" or "Trade" in a table, with red or green background color, respectively, to indicate whether it's below or above the average volume.
MA Angle: The indicator calculates the angle of the moving average (either Simple, Exponential, or Hull) over a user-defined length. A positive angle is shown in green, while a negative angle is shown in red. The angle is displayed in degrees in the table.
Price Velocity: This component calculates the velocity of price movement by comparing the difference between high and low prices over a user-defined lookback period. It then displays the velocity as either "Slow" or "Fast" in the table, with red or green background color, respectively, depending on whether it's below or above the average difference.
The indicator also includes alert conditions for high and low volume situations, notifying the trader when the current bar's volume is significantly higher or lower than the average volume.
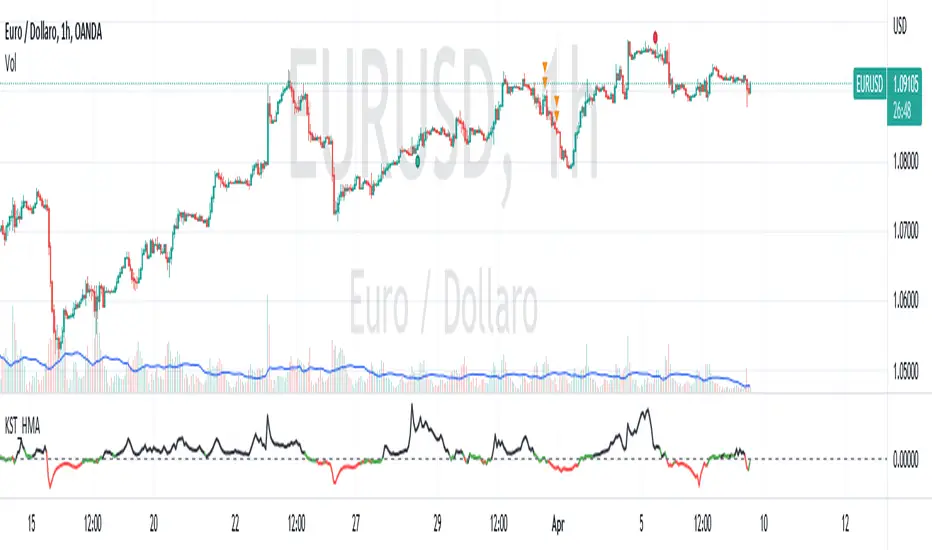
KST con HMA---------- ENGLISH DESCRIPTION ----------
The indicator created is called "KST with HMA" and is used to measure the impulse of an asset's price.
The code begins by defining four variables representing ROC (Rate of Change) period lengths for calculating the KST (Know Sure Thing) and a variable for the length of the HMA (Hull Moving Average).
Next, an HMA function is defined to calculate the Hull Moving Average, a type of weighted moving average that adjusts for price volatility.
ROC values are then calculated for the four periods defined above and KST values are calculated as a weighted sum of the ROC values. These values are then normalized with the HMA and the standard deviation of the HMA is calculated. The normalized value is finally plotted with three different color lines: black for values greater than 1, red for values less than -1, and green for values between -1 and 1.
Finally, a black dashed line is plotted to represent the zero line. The green line indicates a phase of market uncertainty or lateralization, while the indicator can be used to identify buy points above zero and sell points below zero.
---------- ITALIAN DESCRIPTION ----------
L'indicatore creato è chiamato "KST con HMA" e viene utilizzato per misurare l'impulso del prezzo di un asset.
Il codice inizia definendo quattro variabili che rappresentano le lunghezze dei periodi di ROC (Rate of Change) per il calcolo del KST (Know Sure Thing) e una variabile per la lunghezza dell'HMA (Hull Moving Average).
Successivamente viene definita una funzione HMA per il calcolo della Hull Moving Average, un tipo di media mobile ponderata che si adatta alla volatilità del prezzo.
Vengono poi calcolati i valori ROC per i quattro periodi definiti in precedenza e calcolati i valori KST come somma ponderata dei valori ROC. Questi valori vengono poi normalizzati con l'HMA e viene calcolata la deviazione standard dell'HMA. Il valore normalizzato viene infine plottato con tre diverse linee di colore: nero per valori superiori a 1, rosso per valori inferiori a -1 e verde per valori tra -1 e 1.
Infine, viene plottata una linea tratteggiata nera per rappresentare la linea zero. La linea verde indica una fase di incertezza o lateralizzazione del mercato, mentre l'indicatore può essere utilizzato per individuare punti di acquisto sopra lo zero e di vendita al di sotto dello zero.
Hull PressureThis amazing oscillator displays the difference between the hull average calculated on the close of the candles and the one calculated between the average of the highs and lows.
This allows the user to identify the pressure of the closing price over the average, useful to identify trends, divergences, and reversals.
This indicator also has two dynamic overbought and oversold areas, calculated over the past extreme highs and lows of the oscillator.

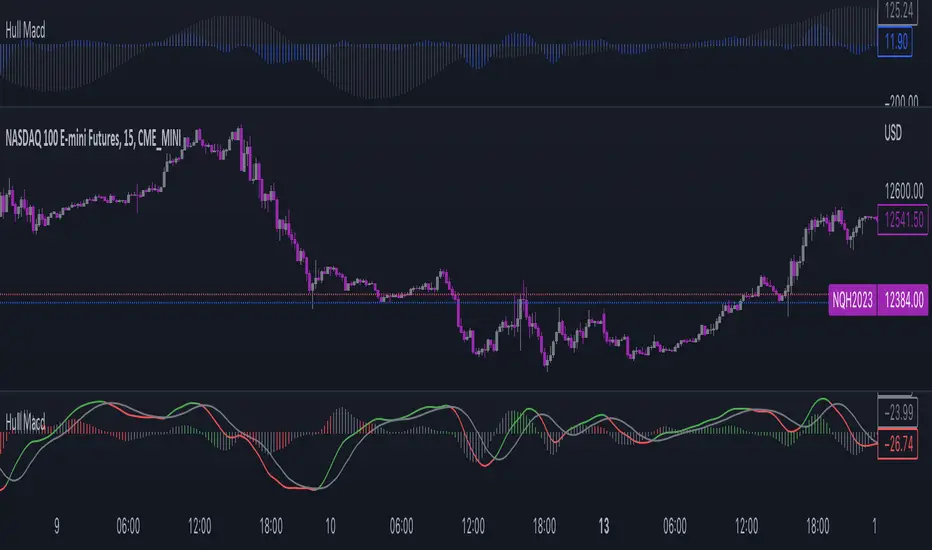
Hull OscillatorThis oscillator comprehends two different indicators:
- The first one is a MACD but calculated using the Hull Moving Average.
- The second one is to show the direction in which the Hull Moving Average is going.
Notice that in the first indicator, the histogram is colored as follows:
- If the volume pressure (difference between the volume-weighted moving average and the normal one) is positive both for the short term and the long term, it's green, if negative it's red, and if not is simply gray.
This tool can be used both for:
- Analyze the direction to have a bias to follow
- Analyze the divergences
- Obtain the signal to enter and exit the trade
- Analyze the market strength with volume to confirm the signal
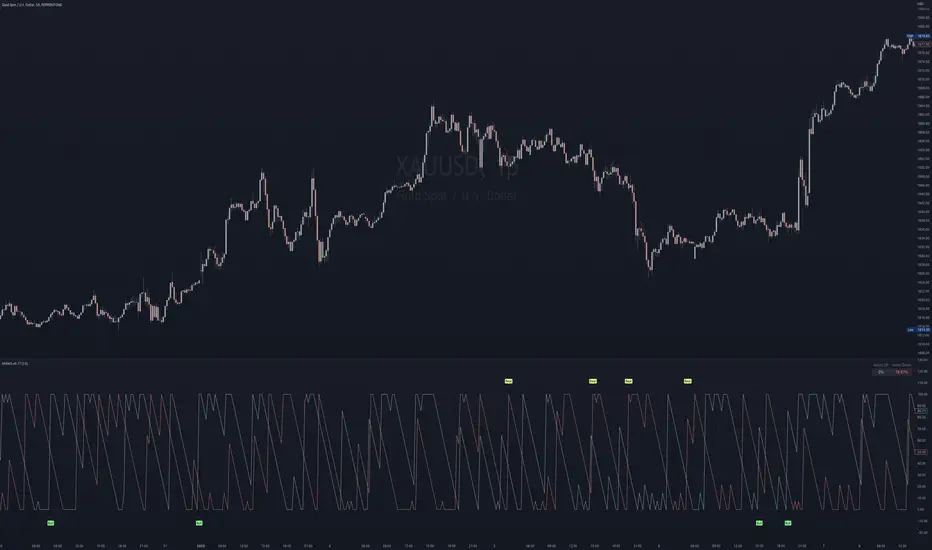
Arron Meter With Alerts [Skiploss]Arron Meter With Alerts is an indicator to identify the trend, and a meter shows the percentage of AroonUP and AroonDown.
Alert Settings
It will be part of a display of bullish and bearish signals by using the condition of the upper line cross lower line and HMA 200 cross under/over EMA 12, and also upper/lower line must be higher than 70%
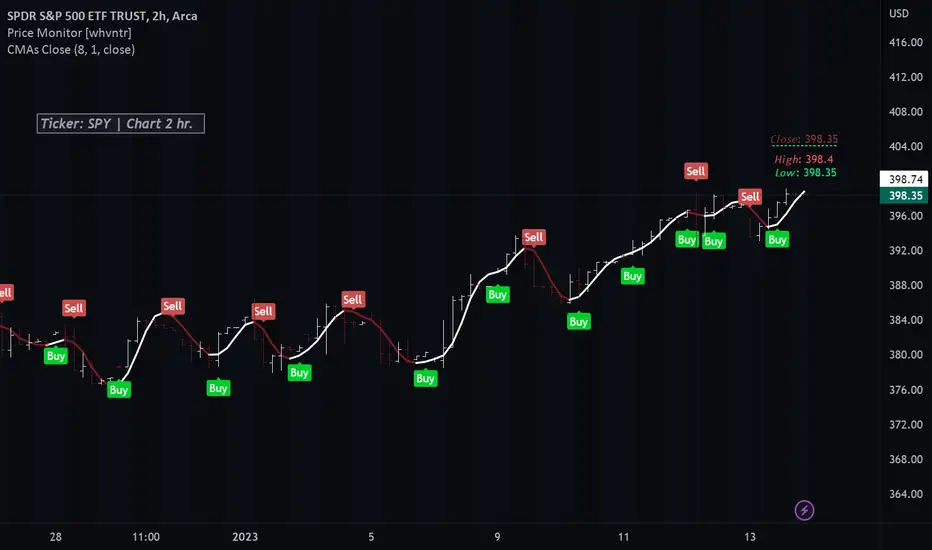
Colored Moving Averages With Close Signals[Whvntr][TradeStation]Plots the first time the close price is above or below the colored portion of the chosen MA. The MA's formula is from TradeStation's indicator: "Colored Moving Averages Can Help You Spot Trends" . I modified that indicator with customizations that include: Buy and Sell signals. Each time the current bar closes above the MA, while it's red (bearish), there's a Sell label at the start of that MA trend. Likewise: each time the current bar closes below the MA, while it's white (bullish), there's a Buy label at the beginning of that MA trend. You can now, also, easily see which MA you are selecting by hovering your cursor over the tooltips icon. I've included a modified Hull MA as default because I've found this SMA combination with the WMA to be a very smooth oscillation. I've also added some different types of MA's. Colored moving averages are helpful to determine when a trend may be reversing.
MA's
1 · Modified Hull MA: (SMA of the WMAs Hull Formula)
2 · Hull MA
3 · Exponential Moving Average
4 · Weighted Moving Average
5 · RMA Moving Average used in RSI
6 · Volume Weighted MA
7 · Simple Moving Average
This indicator isn't endorsed as a guarantee of future, favorable, results.
Market Structure MA Based BOS [liwei666]
🎲 Overview
🎯 This BOS(Break Of Structure) indicator build based on different MA such as EMA/RMA/HMA, it's usually earlier than pivothigh() method
when trend beginning, customer your BOS with 2 parameters now.
🎲 Indicator design logic
🎯 The logic is simple and code looks complex, I‘ll explain core logic but not code details.
1. use close-in EMA's highest/lowest value mark as SWING High/Low when EMA crossover/under,
not use func ta.pivothigh()/ta.pivotlow()
2. once price reaching EMA’s SWING High/Low, draw a line link High/Low to current bar, labled as BOS
3. find regular pattern benefit your trading.
🎲 Settings
🎯 there are 4 input properties in script, 2 properties are meaningful in 'GRP1' another 2 are display config in 'GRP2'.
GRP1
MA_Type: MA type you can choose(EMA/RMA/SMA/HMA), default is 'HMA'.
short_ma_len: MA length of your current timeframe on chart
GRP2
show_short_zz: Show short_ma Zigzag
show_ma_cross_signal: Show ma_cross_signal
🎲 Usage
🎯 BOS signal usually worked fine in high volatility market, low volatility is meaningless.
🎯 We can see that it performs well in trending market of different symbols, and BOS is an opportunity to add positions
BINANCE:BTCUSDTPERP
BINANCE:ETHUSDTPERP
🎯 MA Based signal is earlier than pivothigh()/pivotlow() method when trend beginning. it means higher profit-loss rate.
🎯 any questions or suggestion please comment below.
Additionally, I plan to publish 20 profitable strategies in 2023; indicatior not one of them,
let‘s witness it together!
Hope this indicator will be useful for you :)
enjoy! 🚀🚀🚀

Multi-Timeframe MA Based Zigzag[liwei666]🎲 Overview
🎯 This Zigzag indicator build based on different MA such as EMA/HMA/RMA/SMA, support multi-timeframe setting .
you can get customer zigzag indicator by change short/long ma length and high-timeframe config(5m/15m/30m/1h/2h) in any symbol.
🎲 Indicator design logic
🎯 entired logic is simple and code looks complex, I‘ll explain core logic here, code already equipped with detailed comments.
1. use close-in EMA's highest/lowest value mark as SWING High/Low when EMA crossover/under, not use func ta.pivothigh()/ta.pivotlow()
2. when EMA crossover/under plot a char as signal like ●/❄/▲, crossover get blue char crossunder get red char
3. latest zigzag line is not drawn until EMA is turned (crossover/under), but signal is realtime
4. you can see diff zigzag structure when you open high-timeframe config, then find regular pattern benefit your trading.
🎲 Settings
🎯 there are 3 group properties in script, just focus on 5 properties in 'GRP1' ,
'GRP2' and 'GRP3' are display config.
'GRP1':
MA_Type: MA type you can choose(EMA/RMA/SMA/HMA/WMA), default is EMA
short_ma_len: short MA length of your current timeframe on chart
long_ma_len: long MA length of your current timeframe on chart
htf_ma_len: MA length of high timeframe, MA type same as 'MA_Type' config
htf_ma_tf: high timeframe ma length, 15/30/60/120 minute
'GRP2':
• show_short_zz • show_long_zz • show_htf_zz:
'GRP3':
• show_short_ma_line • show_short_ma_signal
• show_long_ma_line • show_long_ma_signal
• show_htf_ma_line • show_htf_ma_signal
🎲 Usage
🎯 As we know, MA based signal usually worked fine in trend market , low volatility is unprofitable.
🎯 One of pattern as the chart show below.
1. success example : after a blue ▲ signal, entry long when blue ● signal appear, marked with green box.
2. failed example: after a blue ▲ signal, a red ▼ signal appear, marked with white box.
🎯 BoS(Break of Structure) based on ma zigzag is a good idea I'm implementing, it will be published in next script.
Additionally, I plan to publish 20 profitable strategies in 2023; this indicatior not one of them,
let‘s witness it together!
Hope this indicator will be useful for you :)
enjoy! 🚀🚀🚀

Volume Weighted Hull Moving Average Bollinger Bands (VWHBB)Title: "Volume Weighted Hull Moving Average Bollinger Bands Indicator for TradingView"
Abstract: This script presents a TradingView indicator that displays Bollinger Bands based on the volume weighted Hull Moving Average (VEHMA) of a financial asset. The VEHMA is a technical analysis tool that combines the reduced lag of the Hull Moving Average (HMA) with volume weighting to provide a more sensitive indicator of market trends and dynamics. The Bollinger Bands are a volatility indicator that plot upper and lower bands around a moving average, which can help traders identify potential trend changes and overbought or oversold conditions. The script allows the user to customize the VEHMA length and Bollinger Band deviation parameters.
Introduction: Bollinger Bands are a popular technical analysis tool used to identify potential trend changes and overbought or oversold conditions in the market. They are constructed by plotting upper and lower bands around a moving average, with the width of the bands determined by the volatility of the asset. The VEHMA is a variant of the Hull Moving Average (HMA) that combines the reduced lag of the HMA with volume weighting to provide a more sensitive indicator of market trends and dynamics.
Methodology: The VEHMA is calculated using a weighted average of two exponential moving averages (EMAs), with the weighting based on the volume of the asset and the length of the moving average. The Bollinger Bands are calculated by plotting the VEHMA plus and minus a standard deviation of the asset's price over a specified period. The standard deviation is a measure of the volatility of the asset and helps to adjust the width of the bands based on market conditions.
Implementation: The script is implemented in TradingView's PineScript language and can be easily added to any chart on the platform. The user can customize the VEHMA length and Bollinger Band deviation parameters to suit their trading strategy. The VEHMA, Bollinger Bands, and fill colors are plotted on the chart to provide a visual representation of the indicator.
Conclusion: The VEHMA Bollinger Bands indicator is a useful tool for traders looking to identify potential trend changes and overbought or oversold conditions in the market. This script provides a convenient and customizable implementation of the indicator for use in TradingView.

HMA Breakout Buy/Sell indicator for Scalping & Intraday - ShyamHi All,
This is a very simple indicator which provides the buy signal, when the moving average lines turns Green and sell signal, when the moving average signal turns red. This can be used for both intraday and scalping method with different timeframes. But best time frame is 5 minutes.
Buy Signal >>> Line turns GREEN (Use trailing SL to cover maximum profit)
Sell Signal >>> Line turns RED (Use trailing SL to cover maximum profit)
No trade >>> Line turns GRAY
Best timeframe >>> 5 minutes
Thanks,
Shyam

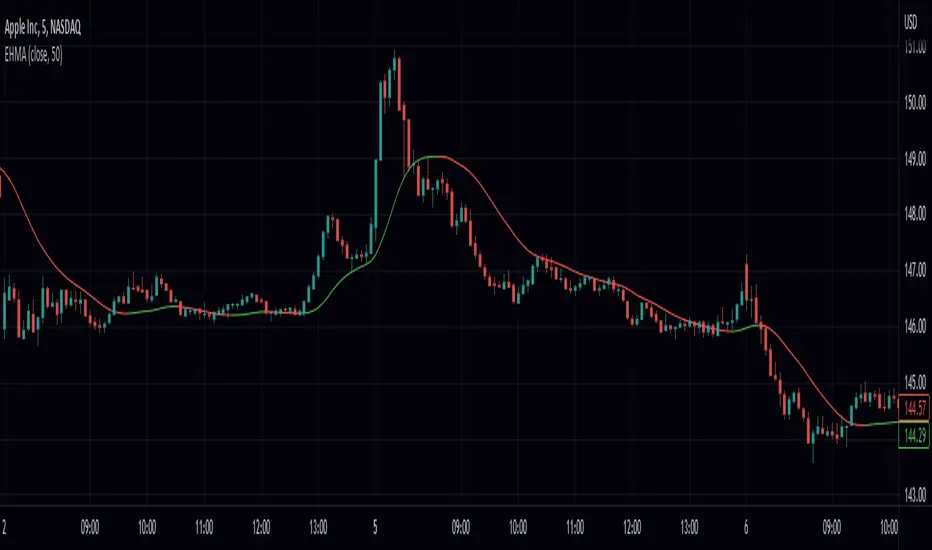
Exponential Hull Moving Average With Alerts (EHMA)Hello! This is simply HMA calculated with EMA's instead of WMA! I have added alerts for the direction of the average.
Heres a recap the traditional HMA:
The Hull Moving Average ( HMA ) attempts to minimize the lag of a traditional moving average while retaining the smoothness of the moving average line. Developed by Alan Hull in 2005, this indicator makes use of weighted moving averages to prioritize more recent values and greatly reduce lag.
HMA Slope OscillatorA Hull Moving Average (HMA) slope oscillator. It uses a HMA slope to identify up/down trends. Usage is simple: adjust the HMA and signal length according to your needs. Long orders start when the bar changes from under (the zero line) to over the zero line. You can also spot "early" long entries when the bar moves close to the zero line. Short orders should be placed when a red bar appears after blue bars (top of the mountain).
"Play" with the length to find the best settings for your trading strategy.
** I have not added alerts. If you need alerts just let me know and I will be happy to update this indicator.

Outback RSI & Hull [TTF]This indicator was originally made to help users following along with one of our strategies that we call The Outback (hence the name).
One of the component indicators of that strategy is an RSI with a Hull Moving Average added on top of the RSI as an additional reference for the momentum of the RSI. Many people either had difficulty setting this up correctly, or were having issues with the Indicator on Indicator component, so we built this indicator to assist in that regard.
As we continued to use it, we found it to be a pretty sound momentum indicator that had much to offer by enhancing the more normal RSI, and wanted to make this indicator generally available to the public.
The basic premise of this indicator is as follows:
The core is a traditional RSI with a "normal" (usually Simple) moving average
The "secret sauce" is adding a 2nd moving average (a Hull Moving Average, inspired by Insilico's awesome Hull Suite) based off the RSI
By leveraging the RSI's position relative to both the Simple and Hull moving averages, you can better gauge the relative strength of the current momentum, as well as better visualize longer-term momentum direction and strength based on the moving average slopes and direction.

HZlog This indicator is based on HUll (shown ) plus log trend
to control it you need to play with the following :
TF is in minute time - I use this method as it allow us to calibrate it more precisely then regular way of Hull indicator
next is the factor value set to 0.001 ( you can increase it if you want less signals to be )
signals of buy and sell are added
I hope you like this indicator

Hull Butterfly Oscillator [LuxAlgo]The Hull Butterfly Oscillator (HBO) is an oscillator constructed from the difference between a regular Hull Moving Average (HMA) and another with coefficients flipped horizontally.
Levels are obtained from cumulative means of the absolute value of the oscillator. These are used to return dots indicating potential reversal points.
Settings
Length: Number of past price inputs processed by the oscillator.
Levels Multiplier: Determine how far the levels are from 0.
Src: Input source of the indicator.
Usage
The oscillator can be used like most available oscillators. The sign of the HBO allows determining the current trend direction, while divergences with price might indicate potential reversals.
The displayed levels can additionally indicate whether the market is overbought or oversold. When the direction of the oscillator changes while being above the upper or lower level a red dot (if above upper level) or green dot (if under lower level) will be displayed, indicating a potential reversal.
Details
The name of the indicator is directly derived behind the coefficients used for its calculation. Displaying regular Hull coefficients alongside those flipped horizontally slightly resemble a butterfly, the difference between these sets of coefficients allows obtaining the HBO.
This operation allows to obtain a more structured impulse response, potentially giving less undesired performances on the frequency domain compared to simpler operation involving subtracting the HMA to a SMA, EMA or WMA.
