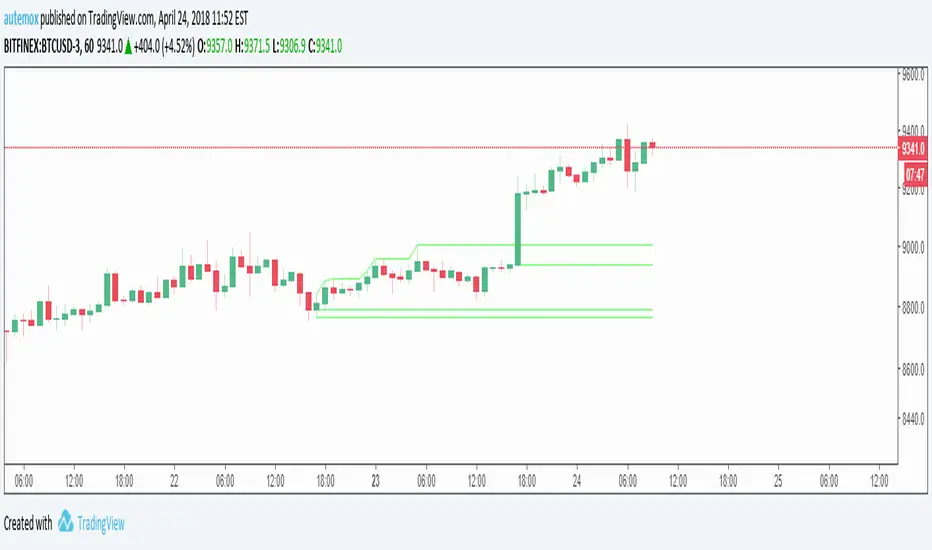
Yesterday Line: Lines at Yesterday's Open, Close, High, and Lowcreated by AutemOx
twitter: @joyrider5
reddit: /u/joyrider5
This creates lines at yesterdays open, close, high, and low. It is pretty amazing use of the timenow and dayofweek variables if I say so myself 8)
HIGH-LOW
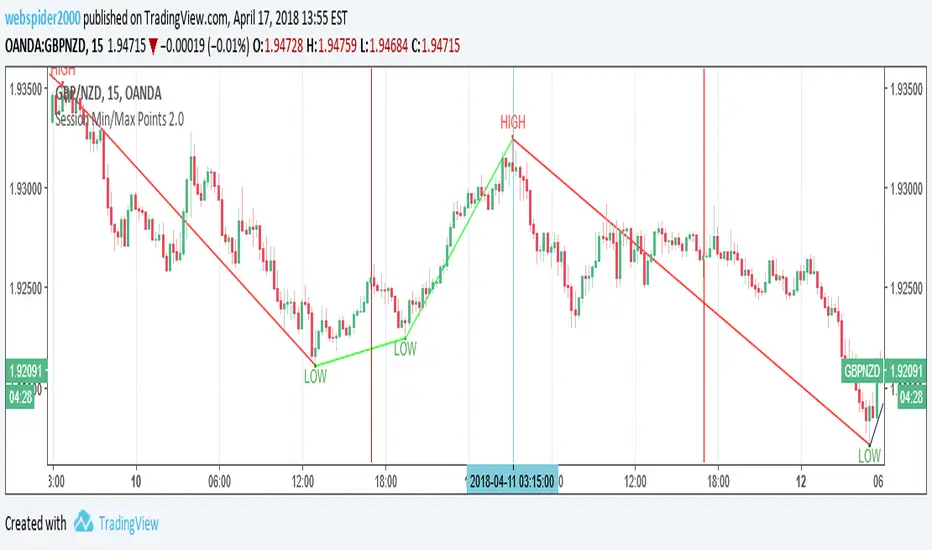
Swing FilterSwing Filter allows you to identify market swings and use the settings to filter out the noise.
The concept is the same as Pine Script's built in pivothigh() and pivotlow(), except with a command center full of controls. Do you to only see swings that are a certain amount higher or lower than their neighboring candles? Want to filter out flash-crashes or freak-spikes? Do you want to count swing-highs or lows that are formed by multiple bars? ...how many? ...how strict? Do you only want swings that are already confirmed or do you want swings that are probably about to be confirmed? You get the idea.
Swing Filter was designed to be plugged into other tools. Swings are used to figure Support and Resistance in Technical Analysis (TA), so you'll find that it is swing filter working in the background of my Support & Resistance Indicator. The creator of this indicator would be happy to help you implement Swing Filter into your workflow, and even can unlock rewiring features that allow Trading View Premium customers to use outputs from other indicators as inputs to swing filter (indicator layering).
INDICATOR SETTINGS:
SWING HIGH VISIBILITY - Show the location of all filtered swing-highs, marked with green "H"
Show Unconfirmed Swing Highs - Whereas a confirmed swing high is shown with a green H, unconfirmed swing highs are shown with an orange H. Sometimes you want to see what could become a swing high before the final right-neighboring candle closes and confirms it. As long as the final right-side candle still has a lower high, we can show an unconfirmed swing high. Once the final right-side candle closes with a lower high, then we have a confirmed swing high. When the "# of Lower Bars to Right of Swing High" setting is set to a number greater than 1, keep in mind that unconfirmed candles will only ever appear one candle prior to confirmation.
# of Lower Bars to Left of Swing High - Swing highs are calculated based on being higher than neighboring candles. How many candles do you want to check to the left-side of a swing high?
# of Lower Bars to Right of Swing High - Swing highs are calculated based on being higher than neighboring candles. How many candles do you want to check to the right-side of a swing high?
Must be This % Higher Than Left Bars - Filter out highs that aren't high enough. "0.5" would require your swing highs to be at least half a percent higher than the high of its confirming left-side bars.
Must be This % Higher Than Right Bars - Filter out highs that aren't high enough. "1" would require your swing highs to be at least one percent higher than the high of its confirming right-side bars.
Multibar Highs - # Bars Allowed to Form High - Filter out or allow highs that are formed at a transition from one bar to another. Especially on low spread exchanges like GDAX, highs may be formed by many consecutive bars, formed by persistant impenetrable buy/sell walls. When using multibar highs, they are counted as a single candle: the swing high will be marked on the right-most high of the multi-bar high, and then the left-side bars are counted from the left-most high of the multi-bar high.
Multibar Highs Strict-Mode - Some multibar highs are just the result of chance, meaning that the first candle reached it's high, went back down, then the second candle reached the same high at a later time. Strict mode will filter these out and only show multibar swing highs that were formed when a candle closed at its high and the next candle opened at its same high. How strict? It allows a one penny difference (for negligible spreads). It also doesn't care about the candles' lows, which leaves room for a future super-strict mode.
*For the complete list of settings and instructions see comments below (sorry they're listed in backwards order below, and the publishing rules won't let me put them all here (too long))

Odd Bars Emiliano MesaSimple code which will find and highlight big price movements in a small period of time. This price movements will usually have an opposite reaction of the same size.
Use this indicator under your own risk.
Emiliano Mesa
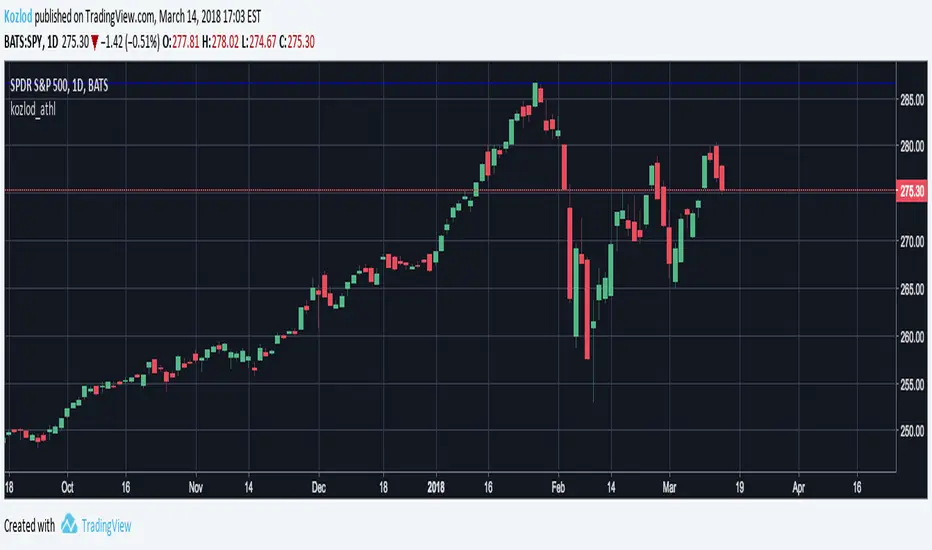
Kozlod - All-time high/low alertsA small script to track all-time high/low levels.
You can create alerts when levels will be updated.

Wave Cycle StochasticThis is based of a modified stochastic numbers. The settings come from Barry Burn's foundation and advanced courses.
There are two stochastic indicators one on top of another. at the same time, you can turn off the lines and show the moving averages of percent D and percent K, this is something I added personally to farther investigate if they can be helpful or not.
Those who went through Barry's courses know that is oscillator is being used to find cycle high and cycle low in waves. Also Barry teaches what he calls mini-divergence and for that he uses this same oscillator. If you switch to weekly chart, the settings will automatically switch to those Barry teach for non 1 to 3 ratio situations so you don't need to worry about that. If seeing the higher time frame cycle indicator on the same oscillator is bothering you, you can again add another copy and only keep that one and turn off the rest.

CMYK HIGH LOW◊ Introduction
This script is intended do display High and Low values, alongside Highest and Lowest of an adjustable period
◊ Adjustments
CMYK color theme applied.
Price color changes if EMA >< EMA
◊ Usage
For those who use Line, Break, or Area Type Charts.
Usefull to quickly display proper levels for buying selling on minute-term trading
◊ Future Prospects
Somehow displaying the highest & Lowest values in a large font.
◊ ◊ ◊ ◊ ◊ ◊ ◊ ◊ ◊ ◊ ◊ ◊ ◊ ◊ ◊ ◊ ◊ ◊ ◊ ◊ ◊ ◊ ◊ ◊ ◊ ◊ ◊ ◊ ◊ ◊ ◊ ◊ ◊ ◊ ◊ ◊ ◊ ◊ ◊ ◊ ◊ ◊ ◊ ◊ ◊ ◊ ◊ ◊ ◊ ◊ ◊ ◊ ◊ ◊ ◊ ◊ ◊ ◊ ◊ ◊ ◊ ◊ ◊ ◊ ◊ ◊ ◊ ◊ ◊ ◊ ◊ ◊ ◊ ◊ ◊ ◊ ◊ ◊ ◊ ◊ ◊ ◊ ◊ ◊ ◊ ◊ ◊ ◊ ◊ ◊ ◊ ◊ ◊ ◊ ◊ ◊ ◊ ◊ ◊ ◊ ◊ ◊ ◊ ◊ ◊ ◊


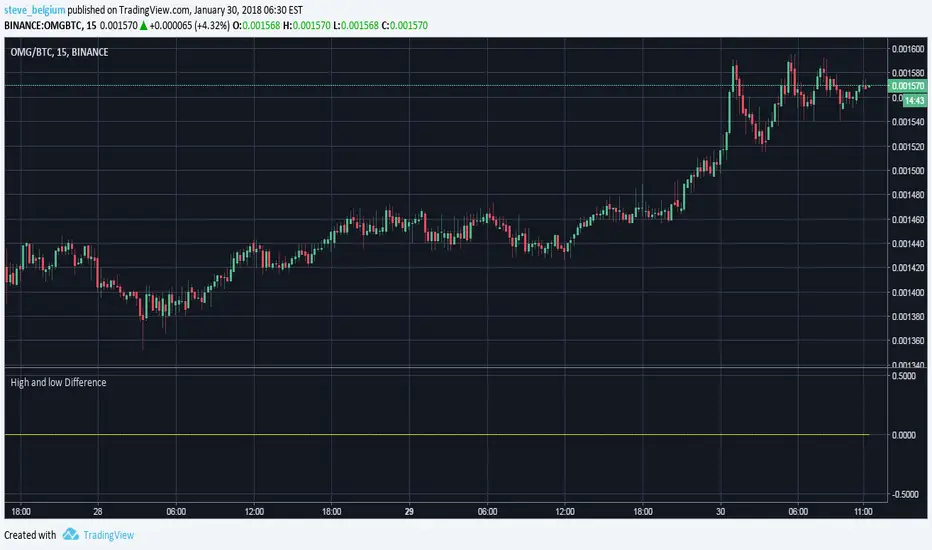
High and low DifferenceWhen the diffference High and low is > 5% a spike is shown
You can set an alarm to it
You can dicide the interval yourself
High Low ChannelBasic high and low channels, allows for two high and two low channels of specified lengths.
Use for channel breakout trades, basic idea is to go long when the longer high channel is broken and close when shorter low channel is broken, vice versa for shorts
Feel free to leave me a tip if you like this script: 1MprT7YEEWaM6bUcpD7eeHM3Ht8n3R5jP1

Previous Daily Open/High/Low/CloseThis indicator plots the previous day's open, high, low and close levels on the chart
Published by Luke (DisciplinedTrader.co.uk)

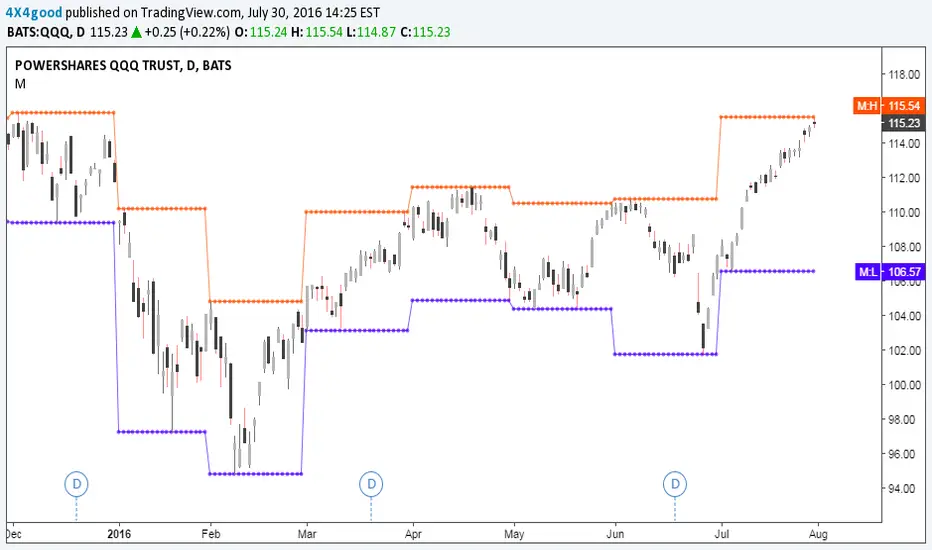
MTF Previous Open/Close/RangeThis indicator will simply plot on your chart the Daily/Weekly/Monthly previous candle levels.
The "Auto" mode will allow automatic adjustment of timeframe displayed according to your chart.
Otherwise you can select manually.
Indicator plots the open/close and colors the high-low range area in the background.
Hope this simple indicator will help you !
You can check my indicators via my TradingView's Profile : @PRO_Indicators

[M]HLC PlotsHLC Plots
Draws points (lines) to high low and close. In some trading situations, this method is more convenient than candles or bars.
--------------------------------------
Рисует точки(линии) по high low и close. В некоторых ситуациях торговли такой способ бывает удобней, чем свечи или бары. На вкус и цвет все фломастеры разные =)


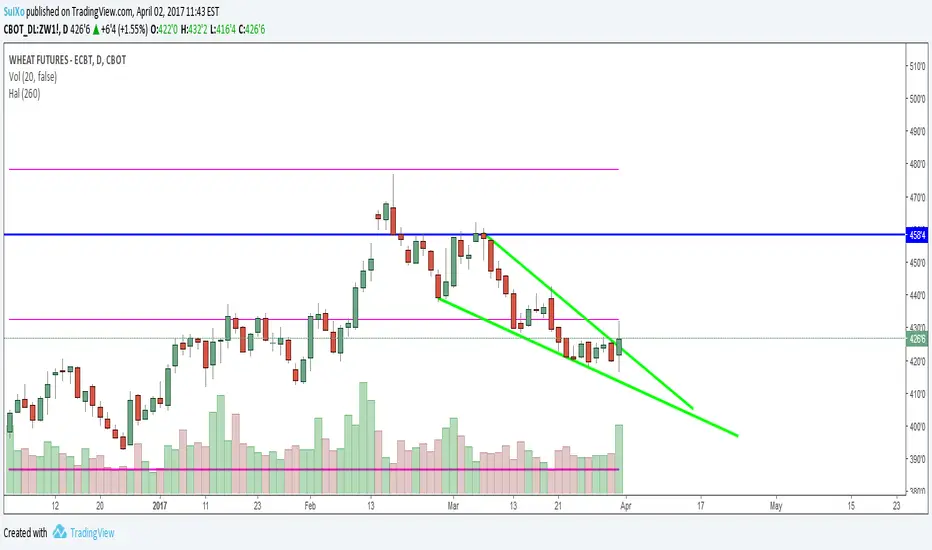
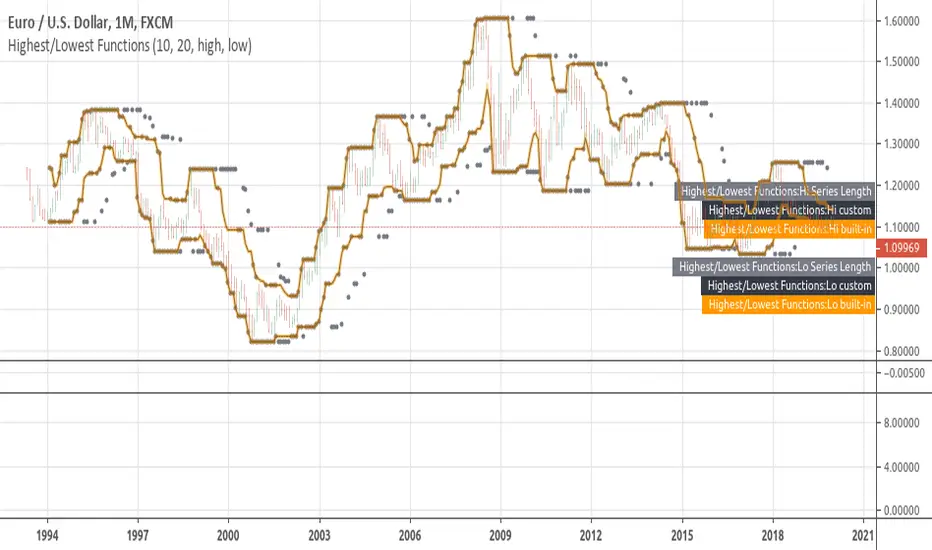
HalHighest High and Lowest Low within a given length. Default is 260 bars (approx 1 year)
Separated in 3 thirds with 2 middle lines. Lowest third, middle third and highest third.
Swing high low support & resistanceThe Swing indicator will plot dot lines that represent the swing points based on the swing length input(number of bars to the left and right of the swing point).
Swing highs and lows can be used by traders to identify possible areas of support and resistance, which can then be used to determine optimal positions for stop-loss or profit target orders. If an indicator fails to create a new swing high while the price of the security does reach a new high, there is a divergence between price and indicator, which could be a signal that the trend is reversing.
Swing highs and swing lows are earlier market turning points. Hence, they are natural choices for projecting support and resistance levels. Every swing point is a potential support or resistance level. However, for effective trading, focus on major swing highs and lows.

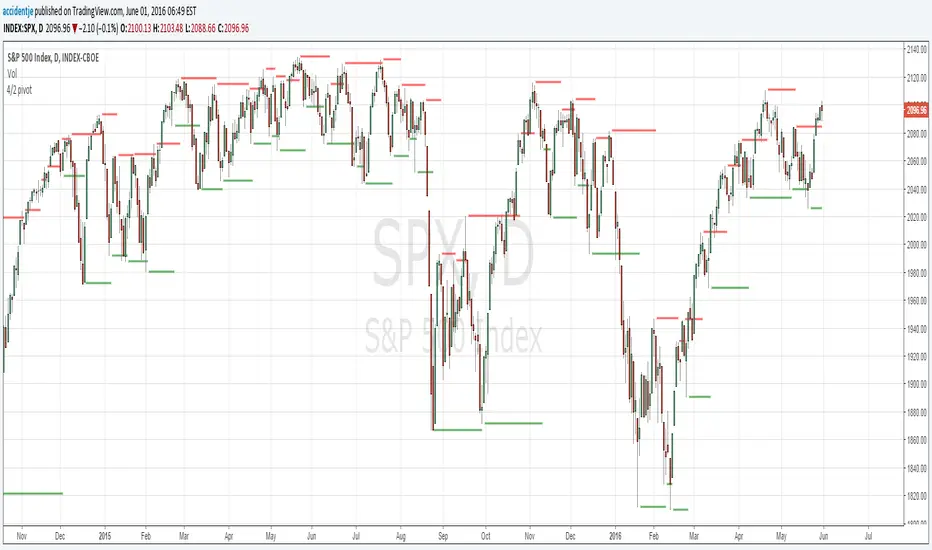
4/2 pivot levelsPlots...
Confirmed highs when 1. it's higher than the 4 prior (lower) highs AND 2. higher than the 2 following (lower) highs.
Confirmed lows when 1. it's lower than the 4 prior (higher) lows AND 2. lower than the 2 following (higher) lows.
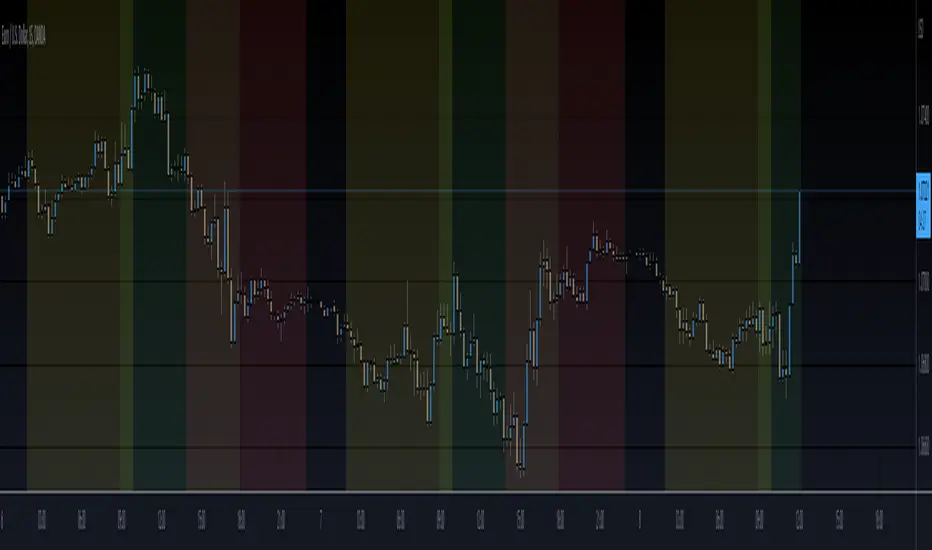
Sessions on ChartThis script shows the London and NY Sessions on your chart. Decided to publish it on demand for user yuan642 :D. Maybe other users may find it helpful.
Looking back on charts it can help to spot certain moves or patterns around certain Session open when high volumes enter the markets.
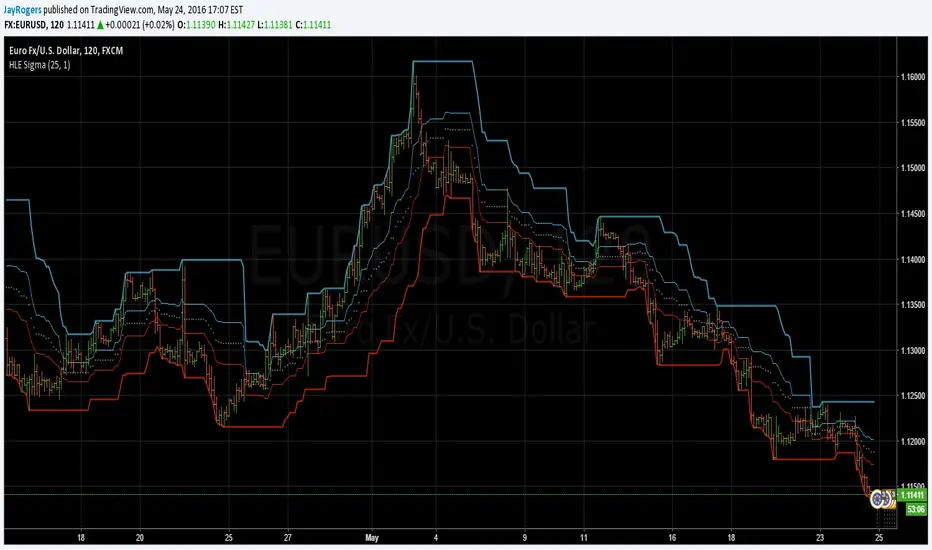
High Low Envelope SigmaDescription:
High and Low Envelope channel with median line and 'sigma' offsets to try and encapsulate price flow and quickly locate likely areas of support and resistance on the fly.
Kay_High_LowPrevious High low plotting.
COPIED from Chris Moody's script and adjusted it for my needs.
