Heikin Ashi CandlesLibrary "heikin_ashi_candles"
This library is programmed to calculate the Heikin Ashi candles using the standard formula of Heikin Ashi Candles.
Notice the Heikin Ashi chart type isn't 100% like the results from this calculation.
You can import this library in your code to use it as a smoothing method for your strategy which operates on the standard chart type.
_close()
_open()
_high()
_low()
_ohlc4()
_hlcc4()
_hlc3()
_hl2()
Heikin

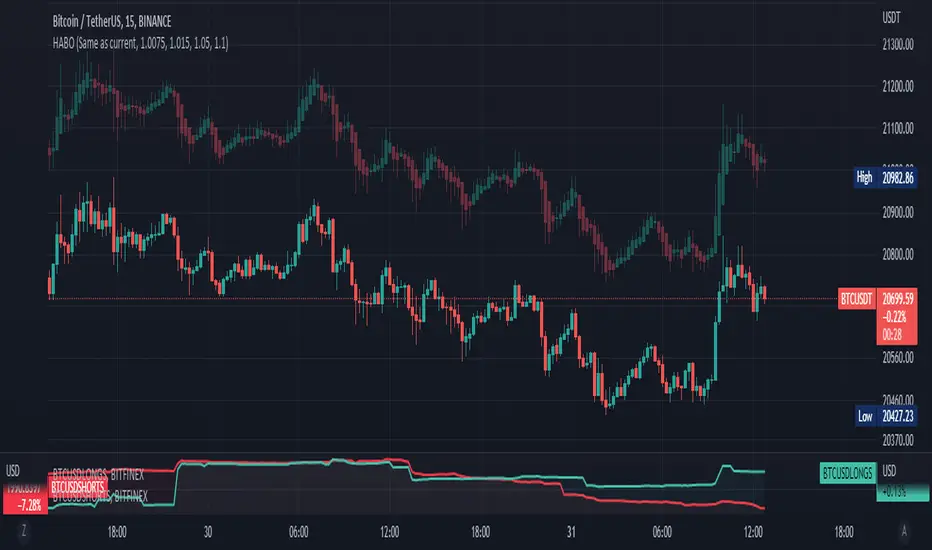
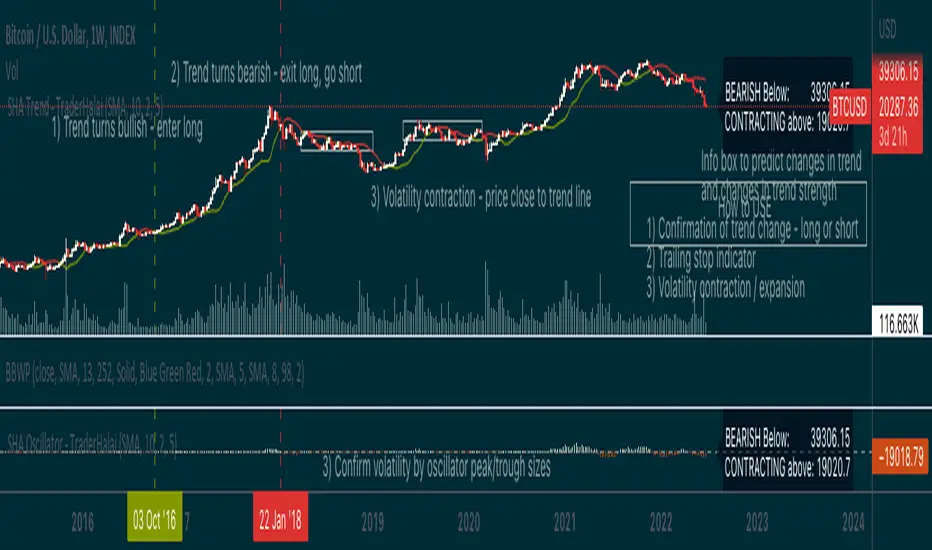
Smoothed Heikin Ashi Trend on Chart - TraderHalaiThis indicator is a predictive tool using Heikinashi to calculate shifts in trade direction.
It works by reverse-engineering the regular candle stick closing price required, to flip the Heiken Ashi candle from Red to Green and vice-versa.
Below, is an earlier indicator that I released and created. This plots this price as an oscillator, which allows traders to get a predictive indicator of a trend change.
This indicator extends upon this functionality by adding a smoothing function to the reverse-engineered regular candle stick closing price, to reduce the choppiness of signals. It also plots the indicator on the chart to allow for easier visual confirmation.
How to use
1) As a directional bias - Bullish or bearish
2) Volatility expansion/contraction - further distance from line means volatility expansion - am planning to release an oscillator version also
3) Trailing stop loss - once you are in a trade
Other Features
Select a moving average period and smoothing calculation method (e.g. SMA / EMA)
Non-repaint mode for backtesting and use/integration with higher timeframes
Final note - Open Source
I am releasing this as open-source for the benefit of the community and to allow further development, scrutiny and criticism. Please feel free to use this indicator as you see fit. If you do use this indicator to create another script, feel free to drop me a note, as I would be highly interested in your idea.
Thanks, and Enjoy!
Heikin Ashi OscillatorThis indicator plots a delta between the Heiken Ashi close price and the regular candlestick closing price as a histogram, which allows you to quickly analyse changes in trend
direction.
It also provides a reverse-engineered closing price for regular candlesticks, to reach in order to maintain the momentum, which allows you to be forewarned of potential pivot points to change in bias in direction.
Feel free to use this indicator to modify and add to your charts as you wish.

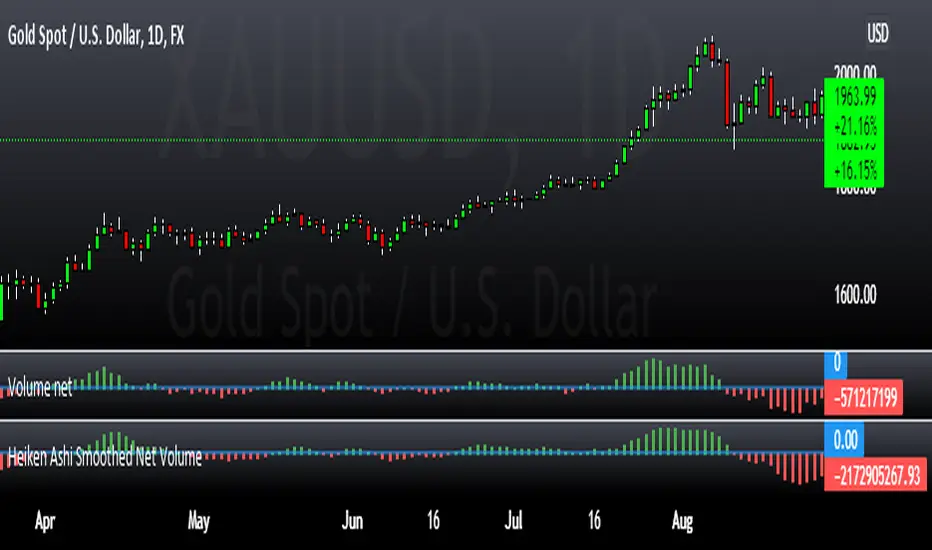
Heiken Ashi Smoothed Net VolumeThis indicator attempts to use Heiken Ashi calculations to smooth the Volume net histogram indicator by RafaelZioni. Long above zero line, short below zero line.
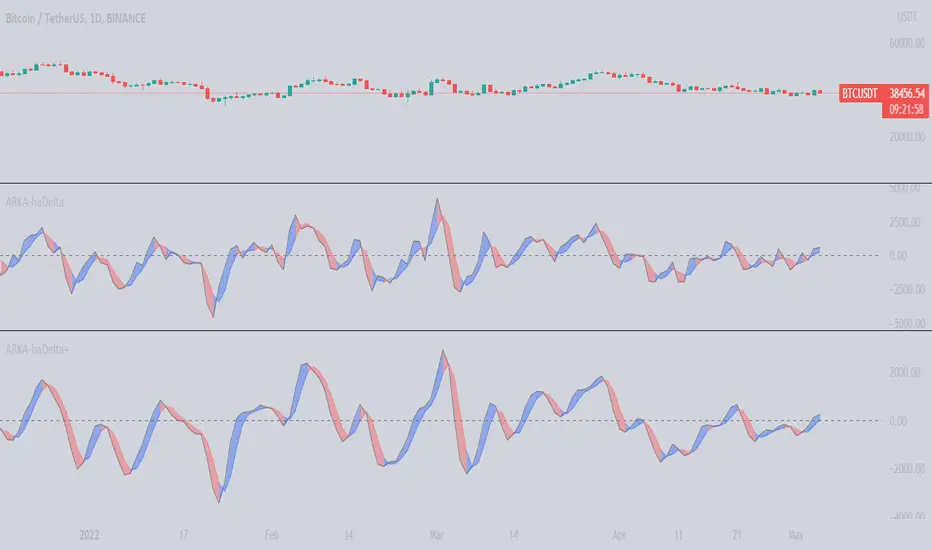
ARKA-haDelta+This Indicator is based on Mr. Dan Valcu ideas.
Bodies of candles(open-close) are the main component used to indicate and assess trend direction, strength, and reversals.
The indicator measures difference between Heikin Ashi close and open.
Measuring the height of candle bodies leads to extreme values that point to trend slowdowns. Thus quantifies Heikin Ashi to get earlier signals.
I used this indicator on Heiken Ashi charts but, it's possible to choose to calculate Body size based on Heiken Ashi or Candles.
haDelta can be smoothed with a simple moving average .
We see that crossings between the haDelta and SMA confirm trend changes with an anticipated delay introduced by each average. Crossings between the indicator and its average are better
confirmations of trend changes.
When Delta crosses above SMA it is an uptrend.
When Delta crosses below SMA it is a downtrend.
Default haDelta smoothed value is by applying 3 periods SMA .
Also, it is possible to deactivate SMA and see just The Delta Values.
In this indicator can choose the MA period and type.
This version has an option that makes it possible to draw dynamic levels. By choosing Dynamic from levels Type and set your preferred length.
The Length value is the max value in the past candles that are used to draw the levels.
In this version, I added the Z-score level. By choosing z-score areas the z-score is above 2 or below -2 shown by colors. I also added Alert ability into the indicator. The alert has two modes. First, when level type equals Z-Score it shows signals where delta cross ma and Z-Score are below or above high and low levels.
The second mode is when the level type is not Z-Score it shows delta cross ma.
So far, this is the description of the indicator(haDelta), which has been written separately and published for the public. In this indicator, we intend to smooth the value of haDelta we get using moving averages.
A simple three-day moving average has been applied to the Delta(3) and its MA to reduce the number of false signals generated by haDelta.
haDelta+=SMA(haDelta,3)
SMA(haDelta+,3)=SMA(haDelta+,3)
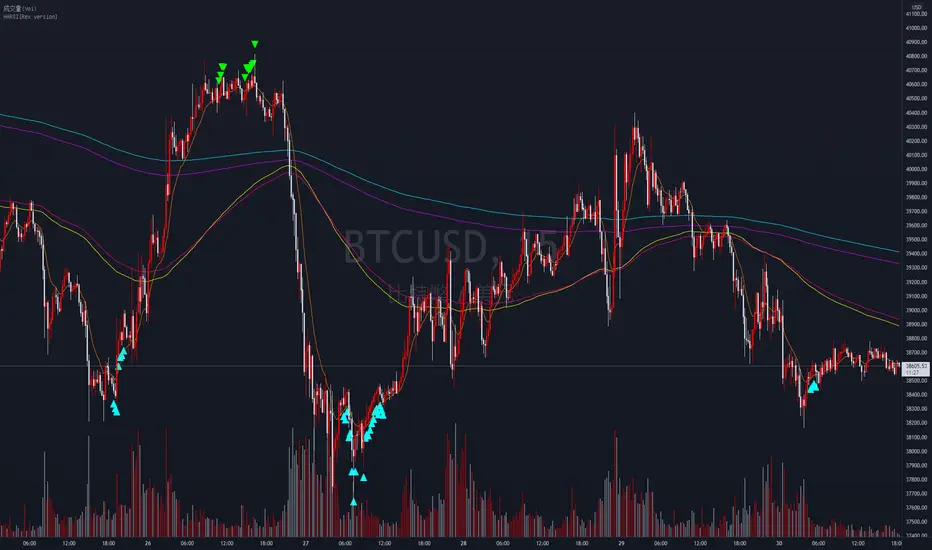
HARSI[Rex version]This indicator based on Heikin Ashi RSI Oscillator
The indicator like a plugin of Heikin Ashi RSI Oscillator
At the line NO.1 the (the red candle turn into green) ,but price sitll bumpy .
At the line NO.2 after the mark and long signal appears and price goes up
And the Vegas tunnel could be TPotSL
一號線的位置出現了Heikin Ashi RSI Oscillator 多方進場訊號但是價格還是持續震盪
二號線位置出現了上升箭頭後價格才開始慢慢向上走
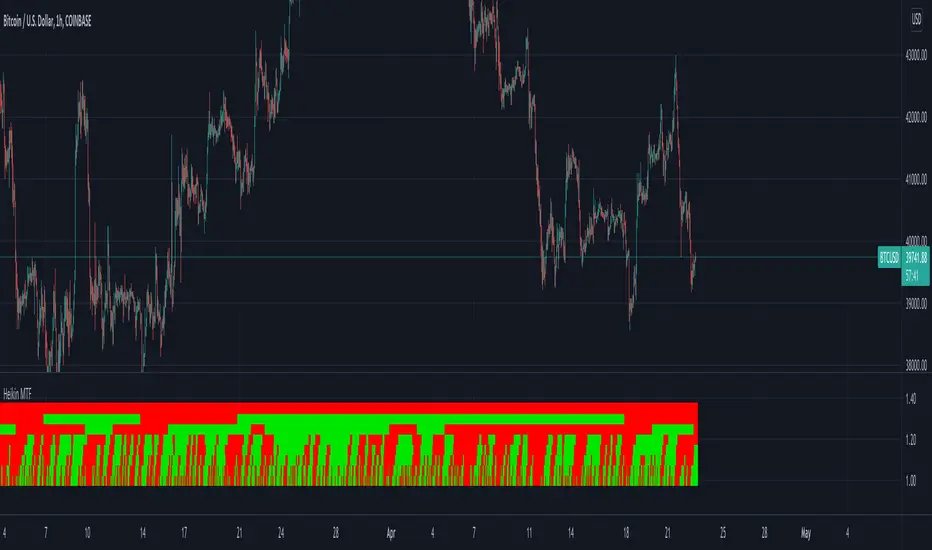
Heikin Multi Time Frame// How it Works \\
This script calculates the open and close prices of Heikin Ashi candles across multiple timeframes,
If the candle formed on that timeframe is green it will display in the table a green square, If the candle is red, the square will display red.
// Settings \\
You can change the colours of the plots
You can also Change any of the timeframes which the Heikin Ashi candles are being calculated on
// Use Case \\
Heikin Ashi candles are often used to give a smoother trend direction and help cancel out some of the noice/consolidation.
It can also be use as trend detection for multiple timeframes at once
/ / Suggestions \\
Happy for anyone to make any suggestions on changes which could improve the script,
// Terms \\
Feel free to use the script, If you do use the scrip please just tag me as I am interested to see how people are using it. Good Luck!
Heikin-Ashi Trend AlertThis script:
Adds a Heikin-Ashi line to the chart (EMA-based).
Provides alerts triggered when the color goes from green to red and vice versa.
Just add the indicator to the chart, create an alert and select " Heikin-Ashi Trend Alert " from the dropdown. Profit.

ARKA-Smoothed Z-ScoreThis Indicator is based on Mr. Dan Valcu ideas.
The author of this article is Veronica Valcu.
The z-score (z) for a data item x measures the distance (in standard deviations StdDev) and direction
of the item from its mean (U):
z = (x-StdDev) / U
A value of zero indicates that the data item x is equal to the mean U, while
positive or negative values show that the data item is above (x>U) or below
(x Values of +2 and -2 show that the data item is two standard deviations
above or below the chosen mean, respectively, and over 95.5% of all data
items are contained within these two horizontal references.
Based on the article and ideas about the z-score concept we can use it to get more confidence where we want to be sure this is an oversold or overbought zone.
The indicator draws two levels on 2 and -2. Z-Score color comes red when it goes above 2, and the color changes to green when it goes below the -2 level. The Z-Score color which value is between 2 & -2 is gray.
So far, this is the description of the indicator(ARKA-Z Score), which has been written separately and published for the public. In this indicator, we intend to smooth the value of Z-Score we get using moving averages.
Z-score applied to close prices is an irregular curve that can be smoothed by applying
moving averages. A simple three-day moving average has been applied to the z-score (20), and a simple five-day moving average is applied to the resulting average.
Long opportunities were initiated when the three-day simple moving average crossed above the five-day simple moving average of the three-day simple moving average. Short opportunities were initiated when the three-day simple moving average crossed below the five-day simple moving average of the three-day simple moving average.

ARKA-Synergy Heikin Ashi & PriceThis Indicator is based on Mr. Dan Valcu ideas. In this indicator, trend points and possible return points in the Heikin Ashi chart are calculated based on their position.
Closing price in front of the middle point of the body of Heikin Ashi. So we can get more trend information from the Heikin Ashi chart. The basic idea behind combined charts is to be ready to act when a warning (0.5 or -0.5) is displayed during a trend.
The indicator has four column types:
UP: Uptrend(1)
DN: Downtrend(-1)
NW: Negative warning(0.5)
PW: Positive warning(-0.5)

ARKA-Z-ScoreThis Indicator is based on Mr. Dan Valcu ideas.
The author of this article is Veronica Valcu.
The z-score (z) for a data item x measures the distance (in standard deviations StdDev) and direction
of the item from its mean (U):
z = (x-StdDev) / U
A value of zero indicates that the data item x is equal to the mean U, while
positive or negative values show that the data item is above (x>U) or below
(x Values of +2 and -2 show that the data item is two standard deviations
above or below the chosen mean, respectively, and over 95.5% of all data
items are contained within these two horizontal references.
Based on the article and ideas about the z-score concept we can use it to get more confidence where we want to be sure this is an oversold or overbought zone.
The indicator draws two levels on 2 and -2. Z-Score color comes red when it goes above 2, and the color changes to green when it goes below the -2 level. The Z-Score color which value is between 2 & -2 is gray.

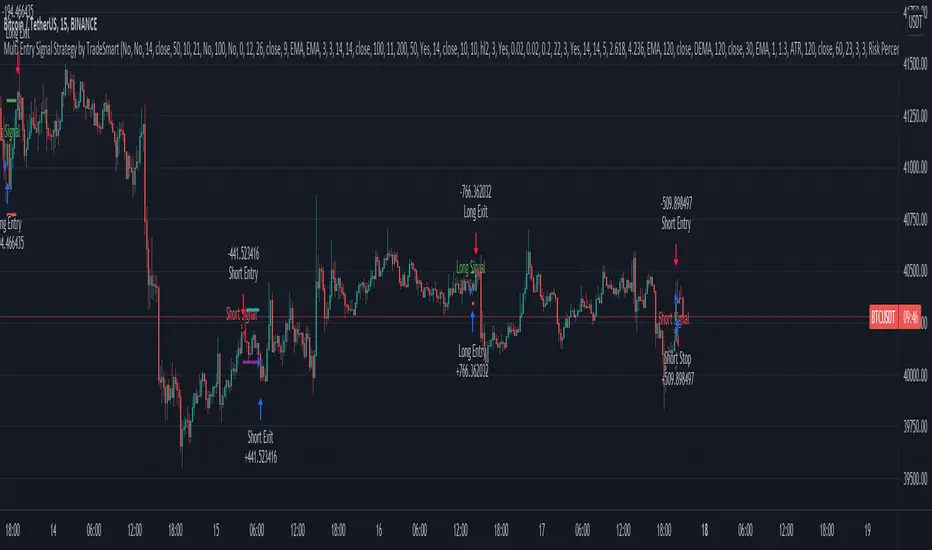
Multi Entry Signal Strategy by TradeSmartThis strategy is intended to test different entry signals. You can use 13 different entry signals in the strategy.
Available signals with all their settings:
Heikin Ashi
RSI + EMA
Wavetrend
MACD
Stochastic RSI
Squeeze Momentum
Kairi Relative Index
SSL
Supertrend
Parabolic SAR
Chandelier Exit
Directional Movement Index
Quantitative Qualitative Estimation
For exact rules of entries please relate to the tooltips of each entry signal. All the signals can be used together or separately in the strategy.
Additional settings that can be used:
Trend Filter (limit long or short entries based on a moving average of your choice)
Exit Strategy settings (ATR is used to determine stop loss and take profit levels)
Trailing Loss Setups (you can use 3 different types of trailing losses)
Setups (you can set Long and Short entries as well as the order size based on either Capital % or Risk %)
Date Range (you can limit trades to specific date ranges)
Trading Time (you can limit on which days to trade)
HARSI - The WHALE v2This strategy is credited to the "Heikin Ashi RSI Oscillator" By JayRogers.
The core of this strategy is "Heikin Ashi RSI Oscillator (HARSI)" By JayRogers, with multiple confirmation indicators. The buy signal is generated by HARSI when there is green HA, and there is a positive stochastic cross under the line OB line.
To confirm the buys signal, you can use one or all of the following:
- EMA: the buy confirmation is positive if the candle closes above the EMA.
- Volume Oscillator: the buy confirmation is positive if the volume value is above the zero line.
- ADX: the buy confirmation is positive if the D+ is above the D- and the D+ is above the threshold level.
- Vortex: the buy confirmation is positive if VI+ is above VI-.
You can enable the take profit, trailing stop loss (TSL), and stop lose (SL), if not, then the strategy will give a sell signal by itself when there is a negative stochastic cross above OB Extreme line.
Note, that the TSL arming value should be lower than the TSL %.
The strategy can give a different result based on your selection. However, the best timeframe is 4 hours without TP.

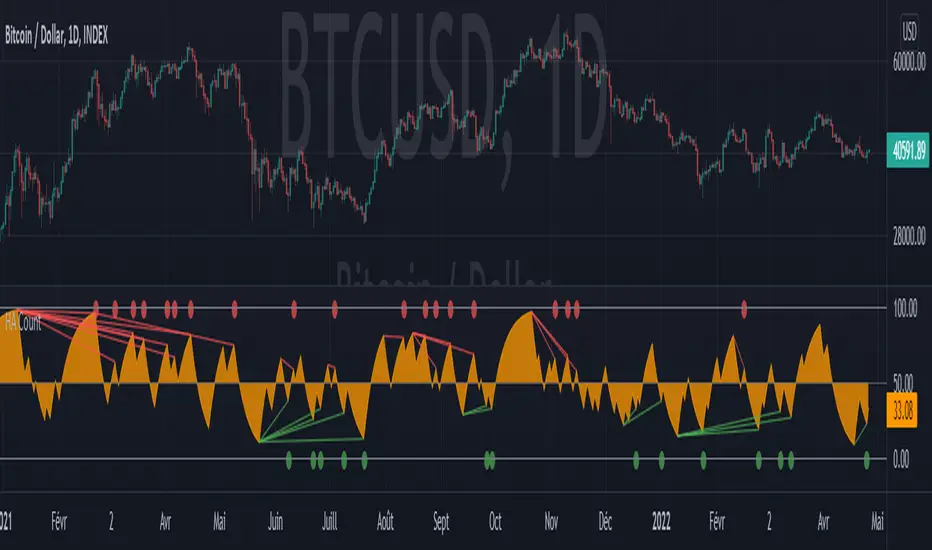
Heikin Ashi CountObjective:
This indicator aims to obtain an oscillator indicating the trend of a market by minimizing noise through the use of Heikin Ashi candles.
The idea is to make the oscillator tend towards 100 at each bullish Heikin Ashi candle, and inversely towards 0 when bearish.
The advantage is that this indicator has little noise compared to the RSI, but also little lag compared to the Schaff Trend Cycle, which are the two indicators that inspired me to create this one.
Usage:
As a general rule, below 15, HA Count indicates an oversell and above 85 an overbuy.
Setting the length for the candle count results in an indicator that is less sensitive when close to 1 and more sensitive when it is at 2 or higher.
Chosen as the default value, 1.15 seems to give the best indications, regardless of the market or time period.
Also it looks very similar to the values that the RSI could give set over 14 periods, so it can be used in the same way. Especially with regard to divergences.
---- FR ----
Objectif :
Cet indicateur vise à obtenir un oscillateur indicant la tendance d'un marché en minimisant le bruit grace à l'utilisation des bougies Heikin Ashi.
L'idée est de faire tendre l'oscillateur vers 100 à chaque bougie Heikin Ashi haussière, et inversement vers 0 lorsque baissière.
L'avantage est que cet indicateur a peu de bruit comparé au RSI, mais peu de lag aussi comparé au Schaff Trend Cycle, qui sont les deux indicateurs qui m'ont inspiré pour la création de celui-ci.
Utilisation :
En régle général, en dessous de 15 HA Count indique une sur-vente et au-dessus de 85 un sur-achat.
Le paramétrage de la longueur pour le comptage de bougie permet d'obtenir un indicateur moins sensible lorsque proche de 1 et plus sensible lorsqu'il est à 2 ou supérieur.
Choisie comme valeur par défaut, 1.15 semble donner les meilleures indications, peu importe le marché ou la période de temps.
En outre cela ressemble beaucoup aux valeurs que pourrait donner le RSI régler sur 14 périodes, ainsi il peut être utilisé de la même manière. Notamment pour ce qui est des divergences.
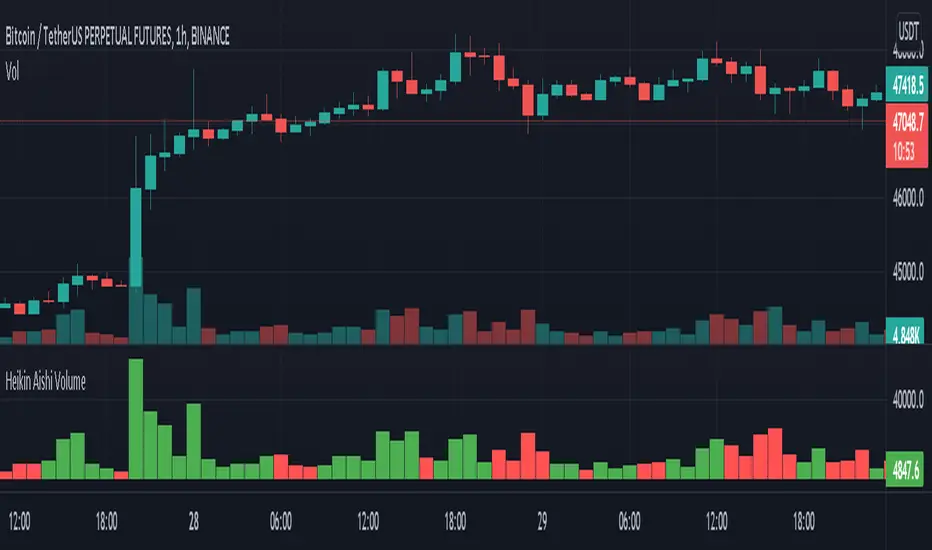
Heikin Aishi VolumeThis indicator plots the volume of each Heikin - Ashi bar...
As you all know the color of the volume depends on the open and close of the current and previous candle. So this indicator will give different color result when used on regular candles...
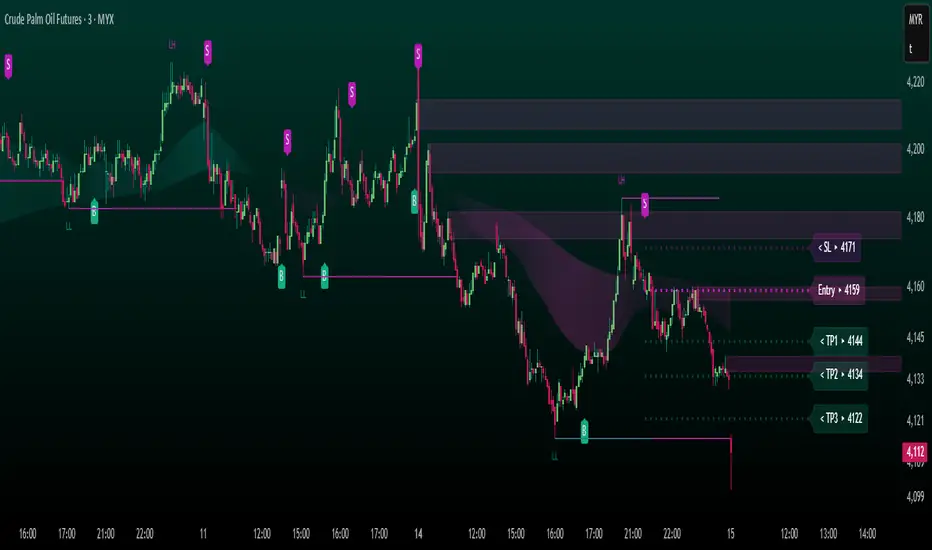
FUTURES ScalpV2 PROTECHFUTURES ScalpV2 PROTECH system
This indicator is built specifically for fast trading i.e. scalping/intraday in the commodity market or futures market. It uses an indicator instrument consisting of ATR TRAILING STOP (ATR), EXPONENTIAL MOVING AVERAGE, PIVOT POINT, and FIBONACCI.
Rebuild of Instrument & Parameter
This indicator is also an upgraded instrument that is sourced from the previous indicator, the COMPLETELY FCPO INDICATOR.
This R&D of course to make trading activities more effective, dynamic and to increase the confidence of traders in current trading activities. The indicator has been upgraded in terms of parameters as well as additional instruments. Among them are;
1. ATR Trailing Stop
2. Exponential Moving Average – fastMA/slowMA Length
3. Label@Entry Price/Stoploss/Takeprofit line
>The best timeframe is 3 minutes
>The take profit and stop loss rates are based on percentages. However
traders can change the percentage rate according to their respective
trading plans.
>existing percentage rates have been set(build-in) specifically for the FCPO
market. So you have to reset for other markets.
>The candle/bars have been colored to make it easier for traders to see price
trends whether in bullish or bearish conditions.
The original instrument has been retained but changed in terms of display & facelift features.
The original indicator (COMPLETELY FCPO INDICATOR) still remains in use and can used together. Hopefully with the combination of these indicators will make traders more successful in trading activities, especially in the futures market.
DISCLAIMER;
ALL NOTES AND INDICATING TOOLS ARE FOR EDUCATIONAL ONLY AND AS A FACILITATOR AND PREPARATION IN TRADING ACTIVITIES. ADMIN IS NOT RESPONSIBLE FOR ANY RISKS IN YOUR TRADING ACTIVITIES. TAKE AT YOUR OWN RISK.
FunTrader/Aieyee @2022

Heikin-Ashi Candle ColoringThis script will change the color of normal candlesticks to the color that the corresponding Heikin-Ashi candles would have.
This allows to spot a trend or a trend reversal just by looking at candles, without using Heikin-Ashi candles, which distort the appearance of a typical chart.

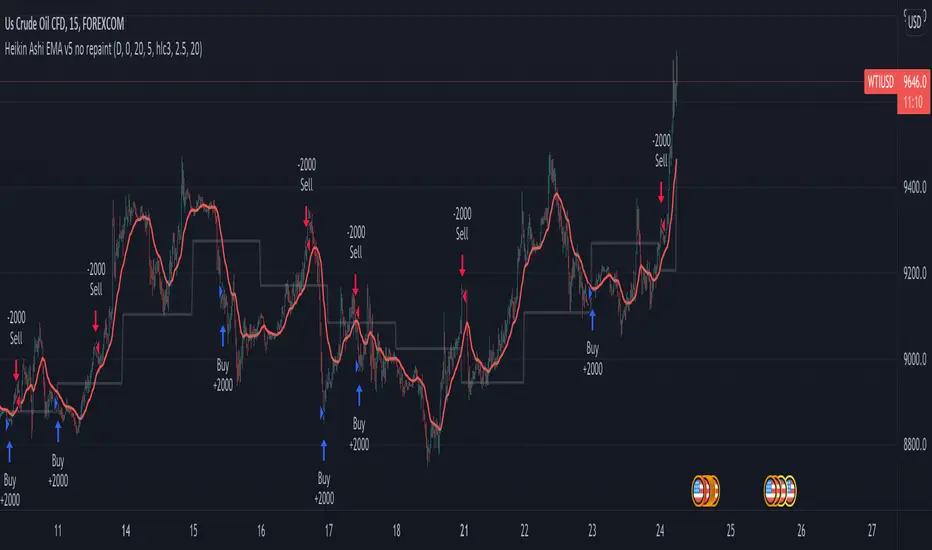
Heikin Ashi EMA v5 no repaint This script was inspired by the "Heikin/Kaufman Strategy" from marco valente built on v2.
The script was rebuilt on the v5 and most importantly removed the repaint function that was driving surrealistic backtesting inflated numbers.
This script is now fully functional and not repainting - At the time of testing worked efficiently 90% WR and 2x profit factor on CFD WTI OIL with a 15m time frame indexed on forex.com price.
You should utilize this script with caution, especially on high volatility cycles you can try plotting against a volatility relative index or stop.
I also strongly recommend understanding the fundamentals of WTI OIL to balance the indications of the strategy with fundamentals.
Thanks to Clovis Warlop and Nilesh Sharma for their contribution.
Cheers,
Gustavo Bramao
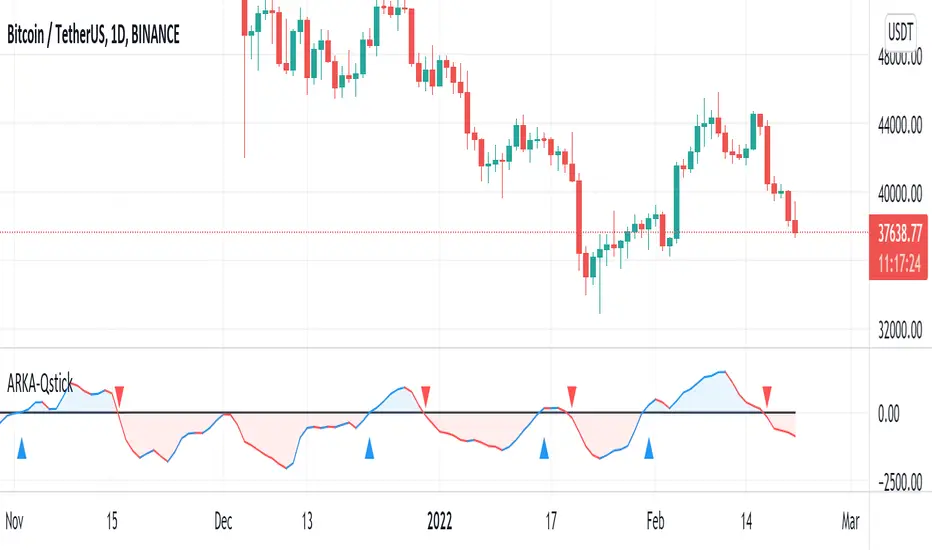
Qstick IndicatorThis indicator idea comes from Tushar Chande called Qstick.
Technical indicators quantify trend direction and strength in different ways.
One way is to use the difference between close and open for each bar and to sum it up over a period of time.
The formual is:
Qstick (period ) = Average ((close-open ), period )
In this indicator, we can choose how to calculate body by two famous chart types. The first and default indicator settings are based on Heiken Ashi chart, and the second is based on the Candlesticks chart.
If the resulting value is positive, the trend is considered up and shows with the blue color; otherwise,
the trend is considered down it shows with red color.
When Qstick value is greater than zero means that the majority of the last 'n' days(the default value is 8)
have been up, indicating that buying pressure has been increasing. Vice versa, when Qstick value is lower than zero means that the majority of the last 'n' days have been down, indicating that selling pressure has been increasing.
Crossing Qstick above Level Zero is used as bullish bias (long entry signal) because it is indicating
that buying pressure is increasing, while bearish bias (short entry signal) comes from the indicator
crossing down through zero. This indicator can be part of trading systems and we can use it to confirm our signals.
Also, We can active Alert checkpoint to show cross points and activate Alerts.
Candles HTF on Heikin Ashi ChartThis script enables calling and/or plotting of traditional Candles sources while loaded on Heikin Ashi charts.
Thanks to @PineCoders for rounding method: www.pinecoders.com
Thanks to @BeeHolder for method to regex normalize syminfo.tickerid.
NOTICE: While this script is meant to be utilized on Heikin Ashi charts it does NOT enable ability to backtest!
NOTICE: For more info on why non standard charts cannot be reliably backtested please see:
NOTICE: This is an example script and not meant to be used as an actual strategy. By using this script or any portion thereof, you acknowledge that you have read and understood that this is for research purposes only and I am not responsible for any financial losses you may incur by using this script!

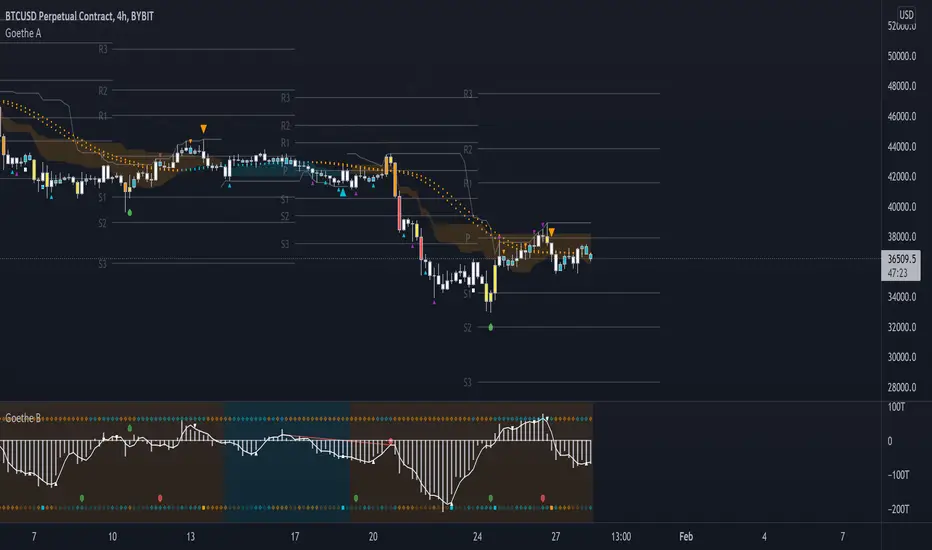
Goethe A - Multiple Leading Indicator PackageGoethe A is an Indicator Package that contains multiple leading and lagging indicators.
The background is that shows the local trend is calculated by either two Moving Averages or by a Kumo Cloud. By default the Kumo Cloud calculation is used.
What are those circles?
-These are OBV (or VPT, can be set in the options) Divergences. Red for Regular-Bearish. Orange for Hidden-Bearish. Green for Regular-Bullish. Aqua for Hidden-Bullish.
What this middle line?
-The middle line is calculated by a smoothed Heikin-Ashi indicator. I can be used as a dynamic zone of support and resistance. Many times this indicator is used as entry signal giver in trend following strategies.
What are those background lines?
-The background contains a simple Daily Pivots indicator. This indicator can be read as zones of Support and Resistance that updated based on the used timeframe.
What is this smaller thin grey line?
-This is a very simple Stoploss indicator based on Donchian Channels. The trade direction is based and calculated by the local trend (background color)
What are those small orange or aqua triangles?
- These are Pivots . They show when the OBV or wolfpack oscillators (or a double confirmation of both) might reverse, this is important to know because many times the price action follows this move.
What are those purple triangles?
- These are Pivots . They show when the PVT oscillator might reverse, this is important to know because many times the price action follows this move.
What are those big orange or aqua triangles?
- These are TSI (true strength indicator) entry signals . They are calculated by the TSI entry signal, the TSI oscillator treshold and in conjunction with the overall local trend (background color).
What are those white squares?
- These are Overbought or Oversold regions of the build-in RSI bands indicator. Every time the price crosses one of the RSI bands those squares are printed. Most of the time this happens after a move and indicates that this strong move has come to an end.
Most settings of the indicator package can be modified to your liking and based on your chosen strategy might have to be modified. Please keep in mind that this indicator is a tool and not a strategy, do not blindly trade signals, do your own research first! Use this indicator in conjunction with other indicators to get multiple confirmations.
Heikin Ashi Bar OverlayThis script shows Heikin Ashi bars on your chart with specified vertical offset