Metallic Retracement LevelsThere's something that's always bothered me about how traders use Fibonacci retracements. Everyone treats the golden ratio like it's the only game in town, but mathematically speaking, it's completely arbitrary. The golden ratio is just the first member of an infinite family of metallic means, and there's no particular reason why 1.618 should be special for markets when we have the silver ratio at 2.414, the bronze ratio at 3.303, and literally every other metallic mean extending to infinity. We just picked one and decided it was magical.
The metallic means are a sequence of mathematical constants that generalize the golden ratio. They're defined by the equation x² = kx + 1, where k is any positive integer. When k equals 1, you get the golden ratio. When k equals 2, you get the silver ratio. When k equals 3, you get bronze, and so on forever. Each metallic mean generates its own set of ratios through successive powers, just like how the golden ratio gives you 0.618, 0.382, 0.236 and so forth. The silver ratio produces a completely different set of retracement levels, as does bronze, as does any arbitrary metallic number you want to choose.
This indicator calculates these metallic means using the standard alpha and beta formulas. For any metallic number k, alpha equals (k + sqrt(k² + 4)) / 2, and we generate retracement ratios by raising alpha to various negative powers. The script algorithmically generates these levels instead of hardcoding them, which is how it should have been done from the start. It's genuinely silly that most fib tools just hardcode the ratios when the math to generate them is straightforward. Even worse, traditional fib retracements use 0.5 as a level, which isn't even a fibonacci ratio. It's just thrown in there because it seems like it should be important.
The indicator works by first detecting swing points using the Sylvain Zig-Zag . The zig-zag identifies significant price swings by combining percentage change with ATR adjustments, filtering out noise and connecting major pivot points. This is what drives the retracement levels. Once a new swing is confirmed, the script calculates the range between the last two pivot points and generates metallic retracement levels from the most recent swing low or high.
You can adjust which metallic number to use (golden, silver, bronze, or any positive integer), control how many power ratios to display above and below the 1.0 level, and set how many complete retracement cycles you want drawn. The levels extend from the swing point and show you where price might react based on whichever metallic mean you've selected. The zig-zag settings let you tune the sensitivity of swing detection through ATR period, ATR multiplier, percentage reversal, and additional absolute or tick-based reversal values.
What this really demonstrates is that retracement analysis is more flexible than most traders realize. There's no mathematical law that says markets must respect the golden ratio over any other metallic mean. They're all valid mathematical constructs with the same kind of recursive properties. By making this tool, I wanted to highlight that using fibonacci retracements involves an arbitrary choice, and maybe that choice should be more deliberate or at least tested against alternatives. You can experiment with different metallic numbers and see which ones seem to work better for your particular market or timeframe, or just use this to understand that the standard fib levels everyone uses aren't as fundamental as they appear.
Goldenratio

Fibonacci Moving Average PlusFibonacci Moving Average Plus is a sophisticated technical indicator that employs the first 15 numbers of the Fibonacci sequence to create dynamic moving average channels. This indicator aims to capture both immediate and long-term price movements by calculating Exponential Moving Averages (EMAs) based on these Fibonacci values. By using Fibonacci-based moving averages for both high and low price points, the indicator generates a visual channel that reflects the ebb and flow of market trends, acting as potential zones of support and resistance. Additionally, the indicator provides midline, retracement, and extension levels rooted in Fibonacci ratios, which are frequently observed as key levels for reversals or trend continuation.
Ideology Behind Using Fibonacci Sequence-Based Moving Averages
The Fibonacci sequence, known for its mathematical harmony and prevalence in natural patterns, is widely utilized in technical analysis to identify potential turning points in markets. In this indicator, the first 15 Fibonacci numbers (5, 8, 13, 21, etc.) are used as the lookback periods for EMAs to capture different layers of market sentiment. These moving averages represent timeframes that are theoretically in alignment with the natural rhythms of market cycles, where key levels—often coinciding with Fibonacci numbers—can act as magnetic points for price.
The Fibonacci high and low channels aim to encapsulate price action, giving traders a sense of whether the market is trending, consolidating, or experiencing reversal pressure. These levels, grounded in both mathematics and market psychology, help traders spot areas where price might face resistance or find support.
Key Features
Fibonacci Moving Average High and Low: This indicator calculates the high and low EMAs based on Fibonacci sequence numbers (e.g., 5, 8, 13, etc.) for enhanced trend analysis.
Golden Pocket Retracement (GPR) and Extension (GPE) Bands: Displays common Fibonacci retracement and extension levels (0.618, 0.65 for retracement, and 1.618, 1.65 for extension).
Midline: Plots the average of the Fibonacci high and low to act as an additional reference level.
Stop-Loss Levels: Provides suggested stop-loss levels based on Fibonacci levels for both long and short positions.
Basic User Guide
Adjust Input Settings:
Input Timeframe: Set a specific timeframe for the Fibonacci moving average calculation, separate from the chart's primary timeframe.
Show Fibonacci MA High/Low: Toggle the visibility of the high and low Fibonacci moving averages.
Show Mid Line: Display a midline for added trend reference.
Show Golden Pocket Bands: Choose to display retracement or extension bands for potential support or resistance zones.
Show Stop-Loss Levels: Enable to visualize potential stop-loss levels for both long and short trades.
Interpretation:
Fibonacci MA High and Low: Use these lines to gauge the general trend. When the price is above both, it may indicate an uptrend; below both, a downtrend.
Golden Pocket Retracement: This zone (between 0.618 and 0.65) is often a key level for potential reversals or support/resistance.
Golden Pocket Extension: The 1.618 and 1.65 levels can indicate potential profit-taking or trend exhaustion points.
Stop-Loss Levels: The calculated stop-loss levels (long SL below and short SL above) can aid in risk management.
Customization:
You can customize the appearance and visibility of each component through the input settings to fit your specific strategy and visual preferences.
This indicator should be used alongside other technical analysis tools to provide a more comprehensive trading approach.
This Indicator would not exist without the original contributions and blessing from Sofien Kaabar

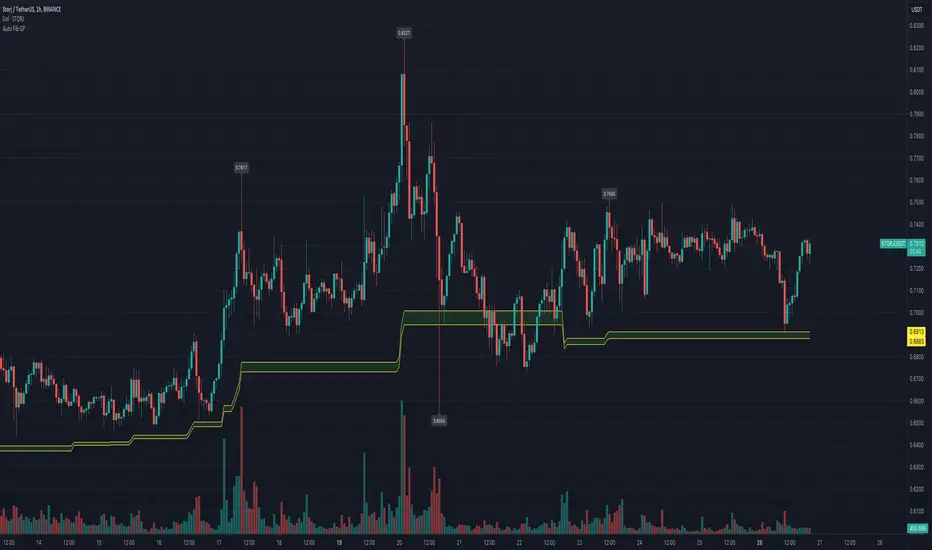
Automatic Fibonacci Retracement Golden Pocket (GP)Main info
This script automatically draws you the Fibonacci retracement level called golden pocket from the latest detected pivot point to the actual price. This level is very popular among traders because the price tends to reverse on this level pretty often. You should use this on higher timeframes 15m+.
It is good to keep in mind that this level alone is not enough, you should still have another level there to enter the trade, for example golden pocket in combination with a demand zone is pretty solid. :)
Settings
The length for pivot point calculation is available in the script settings.
You can enable inverted golden pocket (for shorts)
You can hide/show the pivot point labels
If you want any updates, just feel free to write me :)
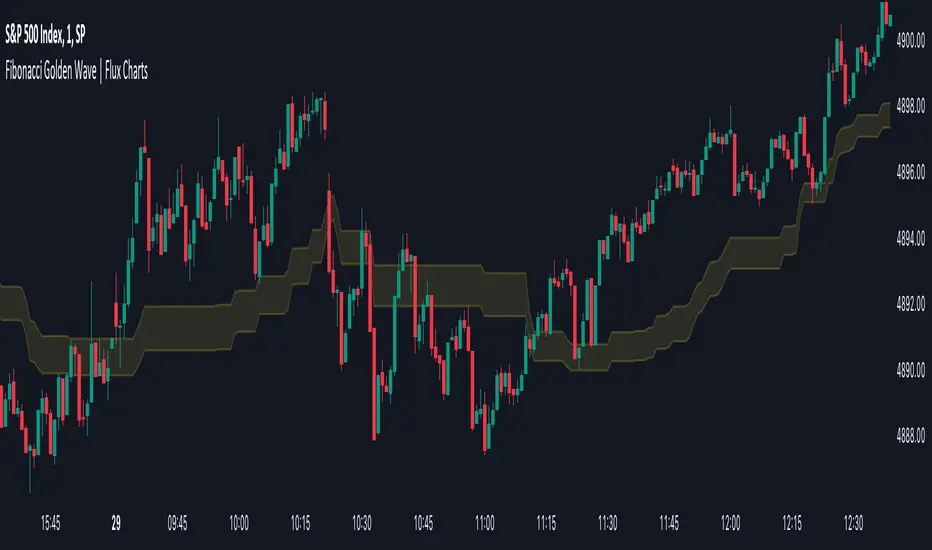
Fibonacci Golden Wave | Flux Charts💎 GENERAL OVERVIEW
Introducing the new Fibonacci Golden Wave indicator! This indicator plots the Fibonacci golden zone from the last highs / lows instead of the pivots so that the resulting zone is shaped like a "wave". We believe this will help you to see the latest trend of the Fibonacci retracement levels easier. For more information of the working progress of the indicator, check the "How Does It Work" section of the description.
Features of the new Fibonacci Golden Wave Indicator :
Plots Fibonacci Golden Zone Based On Highs / Lows
A Different Approach To Fibonacci Retracement Levels
Customizable Swing Range & Retracement Levels
Customizable Visuals
🚩UNIQUENESS
The Fibonacci Golden Zone is a widely used concept in trading. To achieve the golden zone, the Fibonacci retracement levels are generally placed between pivot high / lows, resulting in a rectangular zone. However, this indicator will place the Fibonacci retracement levels between the last highest / lowest points going back from the current bar, resulting in a "wave" shape. This will help traders understand the latest trend of the Fibonacci golden zone. The ability to change the Fibonacci retracement levels to your liking in the settings is another unique function of this indicator.
📌 HOW DOES IT WORK ?
To calculate the Fibonacci wave, first of all we need to place a line at the lowest low and the highest high of the last 20 bars (can be changed from the settings)
Then, Fibonacci retracement levels are placed between those lines.
For the next step, put two points in the (1.0 - 0.618) = 0.382 and (1.0 - 0.5) = 0.5 (can be changed from the settings) levels of the Fibonacci retracement.
Repeat this step for each bar in the chart, then connect all the points.
Instead of a pivot approach to the Fibonacci retracement levels, this approach will not need a new pivot point to form before calculating the new Fibonacci golden zone, thus indicating the latest trend of the current golden zone.
🚨HOW YOU CAN USE THIS INDICATOR
Fibonacci retracement tool is typically used to find entries after a pullback in an uptrend or downtrend. The Fibonacci Golden Wave can be used in the same way. It can be used to find entries after markets retrace. In this example, the Fibonacci Golden Wave is able to catch 2 pullback opportunities to enter long in the market with the trend.
⚙️SETTINGS
1. General Configuration
Swing Range -> This setting determines how the highest high / lowest low levels are calculated. This essentially means that the script will look back X bars before the current bar in calculation to find the highest / lowest wick points.
2. Golden Zone
Here you can select which range of the Fibonacci retracement levels should be considered as the golden zone. The default value is 0.5 - 0.618.
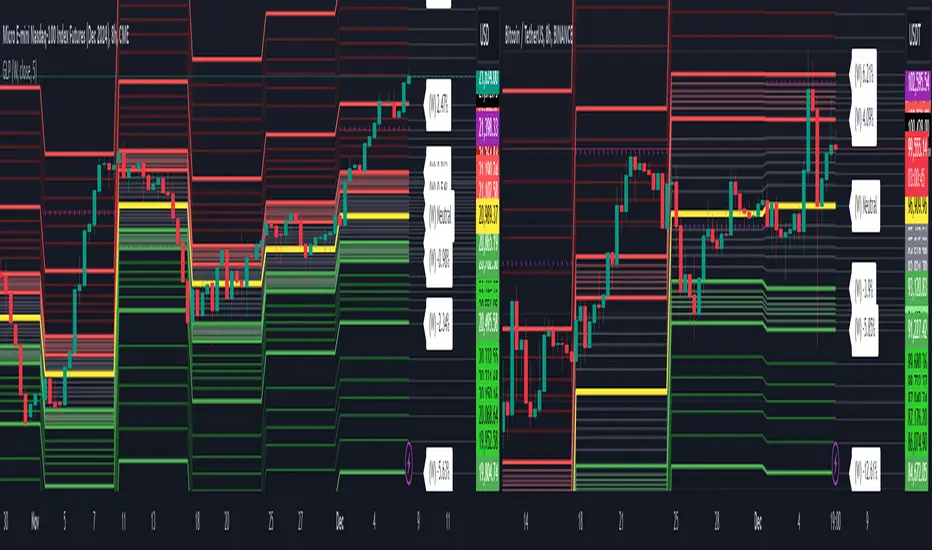
Golden Level Predictions v1.0Golden Level Predictions (GLP) Trading Indicator
This script introduces a custom trading indicator named "GLP" tailored for the TradingView platform. It offers various price levels derived from Fibonacci calculations and other mathematical models, assisting traders in pinpointing potential overpriced and discounted price levels.
Key Features:
User Inputs : Users have the flexibility to select their desired timeframe, with options ranging from Weekly, Daily, Monthly, and more. Additionally, they can opt to showcase Fibonacci lines and the associated prices within these levels.
Price Level Calculations :
- Employs constants such as the Golden Ratio (PHI) and Pi (PI) to extract various multipliers and factors.
- Assesses if the current asset is a cryptocurrency and tweaks calculations accordingly.
- Determines overpriced and discounted price levels, drawing from the current open price and past data.
Fibonacci Levels :
- For each overpriced and discounted level, the script computes intermediary Fibonacci levels, including 23.6%, 38.2%, 50%, 61.8%, and 78.6% (the 3rd level is excluded due to plot limitations).
- These levels are illustrated on the chart, granting traders a more detailed view of price targets.
Visual Elements :
- Projects horizontal lines to the subsequent selected indicator interval for every calculated price level.
- Exhibits potential percentage gains or losses at each tier, indicating the prospective price alteration upon reaching that level.
- Differentiates overpriced (green) and discounted (red) levels using color codes. A neutral price is depicted in yellow.
Anticipated Close Calculation : Offers a projected closing price for the current timeframe, based on a myriad of factors.
This indicator is particularly effective with cryptocurrencies due to their inherent volatility. It's also compatible with stocks and is most efficient with tickers that provide volume data.
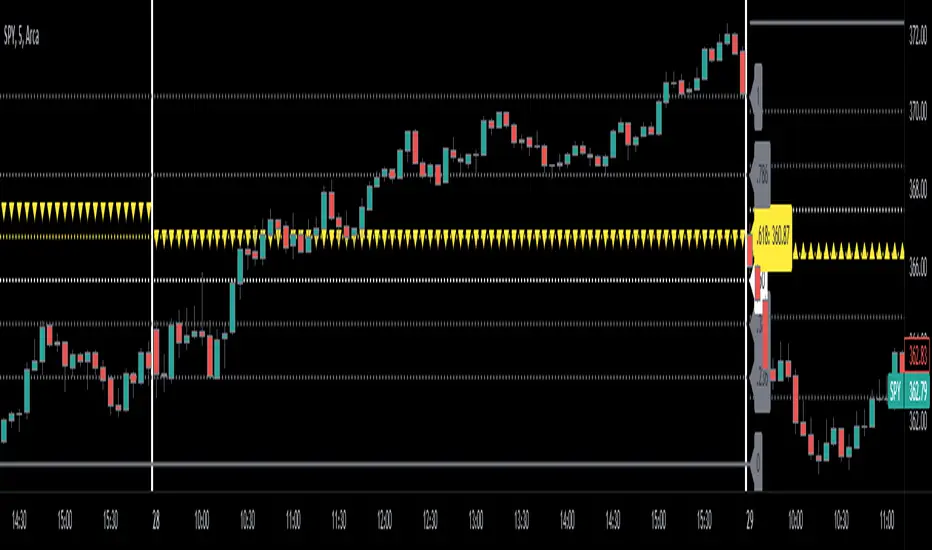
Automatic Fibonacci Retracement + Golden Ratio | by Octopu$👑 Automatic Fibonacci Retracement on Specific Timeframes + Golden Ratio | by Octopu$
Fibonacci Retracement is a method of technical analysis for determining support and resistance levels.
It is named after the famous Fibonacci sequence of numbers: 23.6%, 38.2%, 61.8%, and 78.6%
These ratios provide price levels to which markets tend to retrace a portion of a move.
Also used as a potential spot before a trend continues (or reverses) original direction.
While not officially a Fibonacci ratio, 50% is also used.
Fibonacci Levels can be drawn between any two significant price points or time frames.
(Such as a High and a Low or also on Daily and Weekly charts)
The indicator will then Automatically create the levels between those selected points.
Golden ratio, also known as the divine proportion, in mathematics, is the irrational number:
(1 + Square root of√5)/2, often denoted by the Greek letter ϕ or τ
Which is approximately equal to 1.618.
(Two quantities are in the golden ratio if their ratio is the same as the ratio of their sum to the larger of the two quantities.)
That's The Magic of the Fibonaccis, as well the Golden Ratio itself.
And this is exactly where this Indicator by Octopu$ kicks in:
This indicator Automatically sets all the Fibonacci Levels within the Retracement selected.
On top of that, it Highlights the Golden Ratio for the Fibonacci Levels drawn.
Additionally, it sets the Golden Ratio as possible Support or Resistance level,
Doing so by having visual identification to the Up or Down side.
This changes the game! Along with Price Action, Trend Direction, Chart Analysis and other Indicators as well.
(The combination relies on your own knowledge about Confluence Factors along with your Due Diligence)
www.tradingview.com
SPY
ANY Ticker. ANY Timeframe.
(SPY 5m as an example only)
Features:
• Multiple Timeframes
• Automatic Lines
• Fibonacci Setup
• Golden Ratio
• S/R Highlight
Options:
• Timeframe Selection
• Fibonacci Rates
• Line Customization
• Color Pickers
• Toggle On/Off
Notes:
v1.0
Indicator release.
Changes and updates can come in the future for additional functionalities or per requests. Follow and Stay Tuned!
Did you like it? Please Support and Shoot me a message! I'd appreciate if you dropped by to say thanks! Thank you.
- Octopu$
🐙
Gann Box by time frame
█ OVERVIEW
This script is designed to plot Gann boxes within a specific time frame candle. That means, you can get your intraday Gann box with one click and zoom in to low time frame. Highs and lows are set by candle chosen, you can display the yearly Gann box if that's something you want to view!
In addition, this script can highlight the golden ratio and its inverse ( .618 & .382 ) within the box itself. You have the option to select between a daily, a weekly, or a monthly candle. Not to mention that you have the ability to select a multiplier to those candles, where for example, you would be able to plot the 3 month ( quarterly ) gann box. or the yearly by selecting 12 months! This script includes zero, one and two divisions to Gann box. The first division would get you the sun lines only. while the first division has the middle 0.5 point and so on. This script is meant to be used as a one-click fast solution. Highs and lows get adjusted as the chart breaks those levels automatically.
█ Future Plans and upgrades to this script may include :
1. Adding more divisions.
2. Data box that shows box stats and performance.
3. More geometrical features such as the spirals and the circles on demand by one click.
and more! feel free to let me know what you'd like to see!
█ How to use :
1. Put the script on your chart
2. Navigate to the settings
3. Select your box's time frame.
give the script a few seconds and you should be set.
This script is coded as an addon to the Gann ToolBox package/scripts.

Bitcoin Golden Pi CyclesTops are signaled by the fast top MA crossing above the slow top MA, and bottoms are signaled by the slow bottom MA crossing above the fast bottom MA. Alerts can be set on top and bottom prints. Does not repaint.
Similar to the work of Philip Swift regarding the Bitcoin Pi Cycle Top, I’ve recently come across a similar mathematically curious ratio that corresponds to Bitcoin cycle bottoms. This ratio was extracted from skirmantas’ Bitcoin Super Cycle indicator . Cycle bottoms are signaled when the 700D SMA crosses above the 137D SMA (because this indicator is closed source, these moving averages were reverse-engineered). Such crossings have historically coincided with the January 2015 and December 2018 bottoms. Also, although yet to be confirmed as a bottom, a cross occurred June 19, 2022 (two days prior to this article)
The original pi cycle uses the doubled 350D SMA and the 111D SMA . As pointed out this gives the original pi cycle top ratio:
350/111 = 3.1532 ≈ π
Also, as noted by Swift, 111 is the best integer for dividing 350 to approximate π. What is mathematically interesting about skirmanta’s ratio?
700/138 = 5.1095
After playing around with this for a while I realized that 5.11 is very close to the product of the two most numerologically significant geometrical constants, π and the golden ratio, ϕ:
πϕ = 5.0832
However, 138 turns out to be the best integer denominator to approximate πϕ:
700/138 = 5.0725 ≈ πϕ
This is what I’ve dubbed the Bitcoin Golden Pi Bottom Ratio.
In the spirit of numerology I must mention that 137 does have some things going for it: it’s a prime number and is very famously almost exactly the reciprocal of the fine structure constant (α is within 0.03% of 1/137).
Now why 350 and 700 and not say 360 and 720? After all, 360 is obviously much more numerologically significant than 350, which is proven by the fact that 360 has its own wikipedia page, and 350 does not! Using 360/115 and 720/142, which are also approximations of π and πϕ respectively, this also calls cycle tops and bottoms.
There are infinitely many such ratios that could work to approximate π and πϕ (although there are a finite number whose daily moving averages are defined). Further analysis is needed to find the range(s) of numerators (the numerator determines the denominator when maintaining the ratio) that correctly produce bottom and top signals.

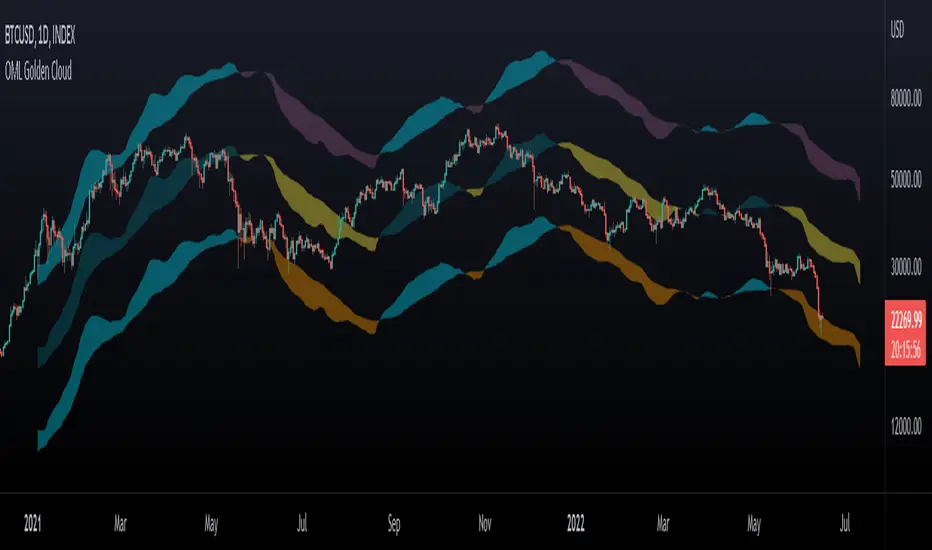
OhManLan Golden CloudThis indicator is a modification of the popular Ichimoku indicator, build high/low channels using the Golden Ratio, Volume-weighted average price allows smoother components.
high/low channels moves based on Fibo Levels (Golden Ratio: 1.618).
- Settings -
The indicator can be adjusted to your needs.
- How to use -
OhManLan Golden can be used a Support/Resistance , Stop loss, Trailing stop and Price target.
Volume-weighted average price allows smoother components.
Can be used with other indicators such as Moving Average Convergence Divergence (MACD).
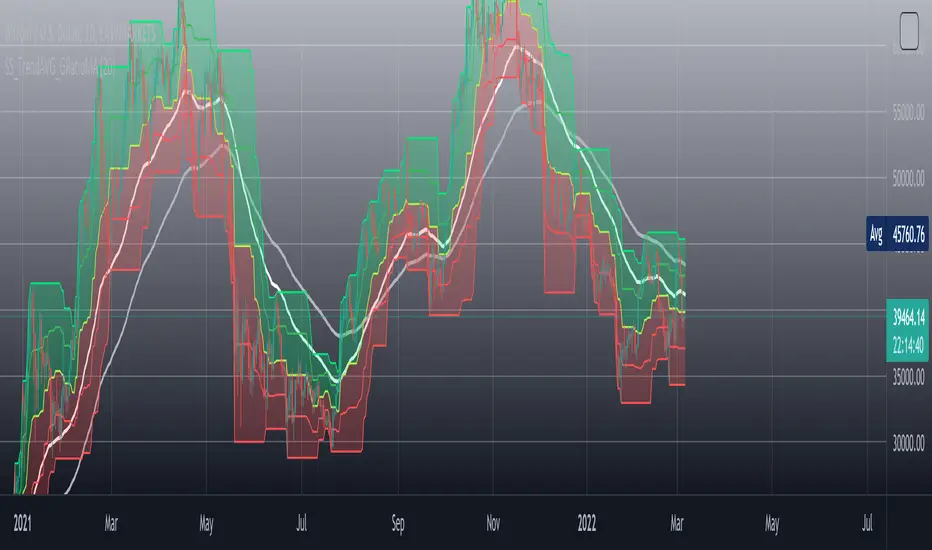
[SS]_TrendAVGZones_and_GoldenRatioMAThe _TrendAVGZones_and_GoldenRatioMA is an indicator that is composed first of a channel made of three price averages ( base average, middle lower and middle upper ) in red is the previous corrections average and in green the previous rises average. So that way we the setting of stop loss targets and price targets can be set up at first glance. It adjusts to any timeframe so no worries 'bout that.
Also I added two exponential moving averages ( white and silver lines ) on the chart which I modified their equations by multiplying as it follows :
is the simple modification I added to fine tune it's precision and after some trials and errors I finally found a perfect spot. Now I tried it with historical data of Bitcoin and when the two Golden Ratio EMA crosses there's a big move coming imminently : if the white one is on top of the silver one the trend is bullish inversely the white one finds itself under the silver line then it needs to cross to expect a reversal.
rphi = 0.6180339887498948 = is the conjugate root of the golden ratio also called the silver ratio
phi = 1.6180339887498948 = golden ratio
It should be used to find short to mid term price targets selling as well as buying ones. If you're a long term trader I suggest using trend lines analysis in combination with it.
I hope to make this indicator a community owned indicator so don't hesitate to perfect it so we can build the best tool traders can hope for ! Together we will no longer ask wen lambo? we will get it!
IF you've got any question you can always DM me
take care of yourselves you future millionaires :D
-SS
Pythagorean Means of Moving AveragesDESCRIPTION
Pythagorean Means of Moving Averages
1. Calculates a set of moving averages for high, low, close, open and typical prices, each at multiple periods.
Period values follow the Fibonacci sequence.
The "short" set includes moving average having the following periods: 5, 8, 13, 21, 34, 55, 89, 144, 233, 377.
The "mid" set includes moving average having the following periods: 5, 8, 13, 21, 34, 55, 89, 144, 233, 377, 610, 987, 1597.
The "long" set includes moving average having the following periods: 5, 8, 13, 21, 34, 55, 89, 144, 233, 377, 610, 987, 1597, 2584, 4181.
2. User selects the type of moving average: SMA, EMA, HMA, RMA, WMA, VWMA.
3. Calculates the mean of each set of moving averages.
4. User selects the type of mean to be calculated: 1) arithmetic, 2) geometric, 3) harmonic, 4) quadratic, 5) cubic. Multiple mean calculations may be displayed simultaneously, allowing for comparison.
5. Plots the mean for high, low, close, open, and typical prices.
6. User selects which plots to display: 1) high and low prices, 2) close prices, 3) open prices, and/or 4) typical prices.
7. Calculates and plots a vertical deviation from an origin mean--the mean from which the deviation is measured.
8. Deviation = origin mean x a x b^(x/y)/c.
9. User selects the deviation origin mean: 1) high and low prices plot, 2) close prices plot, or 3) typical prices plot.
10. User defines deviation variables a, b, c, x and y.
Examples of deviation:
a) Percent of the mean = 1.414213562 = 2^(1/2) = Pythagoras's constant (default).
b) Percent of the mean = 0.7071067812 = = = sin 45˚ = cos 45˚.
11. Displaces the plots horizontally +/- by a user defined number of periods.
PURPOSE
1. Identify price trends and potential levels of support and resistance.
CREDITS
1. "Fibonacci Moving Average" by Sofien Kaabar: two plots, each an arithmetic mean of EMAs of 1) high prices and 2) low prices, with periods 5, 8, 13, 21, 34, 55, 89, 144, 233, 377, 610, 987, 1597, 2584, 4181.
2. "Solarized" color scheme by Ethan Schoonover.

Center Of Gravity OscillatorThe COG Oscillator (center of gravity) is an indicator based on statistics and the Fibonacci golden ratio. It uses ALMA as a trigger and LSMA as "zero line". The trigger is set tight by default but can be tweaked by adjusting the window size and sigma in settings. This is a great indicator for setting up trades and spotting reversals. There are 2 main strategies that come with this indicator:
Strategy 1: Long positions are entered when current low point is higher than previous low. Short positions are entered as current high is lower than previous high. (Shown in image above)
Strategy 2 : If market is bullish long trades are entered as COG line crosses over red LSMA line. Traders have the option of scalping the first crossover or even scaling out of trade to close on second exit. This works the opposite for shorts when market is bearish.
Above shows different configurations of the indicator. Top shows length of 50, Middle has length of 21 and bottom is default 9.

Beam Bands + Fibonacci LevelsThis indicator calculates the Fibonacci retracement levels based on beam bands. As you can see the price very often reacts to these levels.

Euler Cubes - CubᵋI give you the "Euler Cubes", inspired by the mathematical number 'e' (Euler's number).
It is suggested (fibonacci ratios analogy) that price/e ratio can give Support/Resistance area's.
The first cube is made by a low/high of choice, for example:
You set the 'source low'/'source high' in position:
Then you choose the 'e ratio' (x times 'e')
This multiplies the distance 'high-low' times '0.271828' times 'the set number' .
For example, choosing 5 gives 5 x 0.271828 = 1.35914, the distance 'high-low' hereby multiplied by 1.35914, the following cubes multiply the previous distance by 1.35914.
(Settings below 5 will give cubes smaller than the 'high-low' distance)
In the case of x times 'e' = 5:
You can extend the lines:
Now you can give it an angle:
Do mind, using it over very little bars and using an angle can cause some lines to not align as intended, because for now, it is not possible to plot in between bars.
There are also 'Euler' SMA and EMA available with following length's:
27, 54, 82,109, 136, 163, 190 and 217
Cheers!
[blackcat] L5 Zen MasterLevel: 5
Background
L5 Zen Master is my favorite main chart indicator. I have been studying Zen Theory for long and keeping improving related home-baked private indicators. Zen Theory is less known out side of China. This situation is very similar to when Nilson did not introduce Japanese candlesticks worldwide. At that time, traders in other parts of the world rarely heard of Japanese candlesticks. This situation occurs again. When most Chinese bookstores and libraries are full of books on Zen Theory trading techniques, the rest of the world may not know this trading technique based on mathematical derivation axioms.
As for the author of the theory, he/she is as mysterious as Satoshi Nakamoto who created Bitcoin. People don't even know his/her gender, because he/she likes to call himself/herself a "woman" when he/she publishes original trading techniques on his/her blog. No one knows his/her name, only his/her nickname: "Preaching Zen in Tangles" (缠中说禅). People respectfully call him/her "Zen Master" (缠师). Zen Theory is based on geometric structures like Bill Williams' Fractals and ZigZag, but it is very host to MTF applications. In addition, there are unique insights on moving averages, this moving average technology is called Zen Kiss (缠论吻).
Function
It combine several novel indicators together but mainly focus on Zen Theory(缠论主图), including Zen Strokes (自动画笔) 和 Zen Kiss (缠论均线) Moving Averages. To Better understand the market geometry structure, I developped featured Fibonacci Space Indicator which is based on Semi-LOG and Fibonacci Time Window Indicator to help juge trend movements independently. Also, I integrated Better Volume Indicator(BVI) and Range Action Verification Index (RAVI) as well for volume and bias monitoring.
Indicator Set
Zen Stroke (Auto ZigZag, 自动画缠论笔)
Zen Kiss Moving Averages (缠论均线)
Fibonacci Space Indicator with Golden Ratios based on Semi-LOG (黄崇半对数)
Fibnacci Time Window Indicator with red/green background colors
Dynamic Fibnacci Space Arrows to indicate support and resistance immediately
Better Volume Indicator (BVI) with painted bars to juge trend strength
Range Action Verfication Index (RAVI) for large time frame for exetreme conditions warning
Inputs
BVI lookback period --> 5 as default
EnableBVIBarColors --> True as default
Show Zen Stroke --> True as default
Show Fib Space based on Semi-LOG --> True as default
Zen Fractals Lookback Period --> 377 as default
Key Signal
Zen Stroke
Yellow line section for up stroke
Blue line section for down stroke
Zen Kiss MA
Yellow MA for fast line (Cowgirl line)
Fuchsia MA for slow line (Cowboy line)
Fib Space w/ Golden Ratios
Low, 11.4%, 23.6%, 38.2%, 50%, 61.8%, 78.6%, 88.6%, High
Fib Time Window
Green background color for top indicator based on time window
Red background color for bottom indicator based on time window
Dynamic Fib Space Arrows
Green arrows for support
Red arrows for resistance
Better Volume Indicator
Yellow bar color --> low volume --> trend ends, commonly before trend reversals
Red bar color --> climax up volume --> very bullish and next bar may continue to be bullish
White bar color --> climax down volume --> very bearish and next bar may continue to be bearish
Green bar color --> churn volume --> Long and short forces play fierce games within a small price range
Fuchisia bar color --> climax churn volume --> Long and short forces play fierce games within a large price range
Range Action Verfication Index
Yellow background color for extremely negative bias, indicating bottom zone
Fuchsia background color for extremely positive bias, indiacting top zone
Pros and Cons
ONLY suitable for discretionary trading, and does NOT support automatic trading system/bots with alerts.
Intuitive and effective, the output signal is more reliable after multi-indicator resonance
Remarks
My second L5 indicator published
Closed-source
Invite-only
Redeem Fee Life Lock Guarantee
Although I take the efforts to inform the script requesters that the best way to promote trading skills is to learn from the open source scripts I released by themself and to improve their PNIE script programming skills, there are still many people asking how to obtain or pay to use BLACKCAT L4/L5 private scripts. In fact, I do not encourage people to use Tradingview Coins ( TVC ) / Cryptocurrency to redeem the right to use BLACKCAT L4/L5 scripts. However, redeeming private script usage rights through TV Coins/ Cryptocurrency may be an effective way to force more people to learn PINE script programming seriously. And then I can concentrate on answering more valuable community questions instead of being overwhelmed by L4/L5 scripting permission reqeusts.
I would like to announce a ‘Redeem Fee Lock Guarantee’ program to further simplify the L4/L5 indicator/strategy utility offering and distinguish itself from the competition. ‘Redeem Fee lock guarantee’ is one of the major initiatives by BLACKCAT as a part of overall value packaging designed to guard BLACKCAT’s followers’ against cost-overruns and operational risks usually borne by them when it comes to PINE script innovation ecosystem. The TVCs redeemed for L4/L5 a follower signs up for with BLACKCAT is their guaranteed lifetime locked in TVC Quantity/ cryptocurrency, with no special conditions, exclusions and fine print whatsoever. Based on this scheme, I can constantly refine, expand, upgrade and improve PINE script publishing to ensure the very best experiences for my followers. The 'Redeem Fee Lock Guarantee' is a step in the direction of rewarding the valuable followers. NOTE: Every L4/L5 script redeeming service is ONLY limited to TVC or Cryptocurrency ("Win$ & Donate w/ This" Addresses displayed on script page) redeeming which the 1st signed up TVC Qty/ equivalent cryptocurrency is the lifetime offered TVC Qty/ equivalent crypto.
How to subscrible this indicator?
The script subscription period only has two options of one month or one year, and its price is floating. The latest price of the script subscription is proportional to the number of likes/agrees this script has already received. Therefore, the price of subscribing to this script shows an increasing trend, and the earliest subscribers can enjoy the price of lifetime lock to this script. As the number of likes / agrees of this script increases, the subscription fee for one month and one year will also increase linearly. Whatever, the first subscription price of the use will be locked for life.
Monthly subscription and annual subscription can be done either by tradingview coins ( TVC ) or by converting into equivalent cryptocurrency at the exchange rate (1TVC=0.01USD) for redeem.
TVC payment needs to pay TVC directly in the comments under this script. Every time I authorize a new user, I will update the latest number of subscribed users and latest price for next subscription under the script comment. If there are any conflicting scenario happened to the rules and my update. My updated price based on the rule will be the final price for next subscription. The following subscribers need to pay the corresponding amount of TVC or cryptocurrency in accordance with the latest number of users and price announced by me in accordance with the rules published.
TVC redemption is the method I strongly recommend, and I hope you can complete the redemption in the comment area of this script. This is like a blockchain structure, each comment is a block, each subscription is a chain, which is conducive to open and transparent publicity and traceability to avoid unnecessary disputes.
Monthly Subscription Charges
500TVC <50 Agrees (A)
50A<850TVC<100A
100A<1000TVC<150A
150A<1350TVC<200A
200A<1500TVC<250A
250A<1850TVC<300A
300A<2000TVC<350A
350A<2350TVC<400A
400A<2500TVC<450A
450A<2850TVC<500A
500A<3000TVC<550A
550A<3350TVC<600A
600A<3500TVC<650A
650A<3850TVC<700A
700A<4000TVC<750A
750A<4350TVC<800A
800A<4500TVC<850A
850A<4850TVC<900A
900A<5000TVC<950A
950A<5350TVC<1000A
1000A<5500TVC<1050A
And so on...
Annual Subscription Charges
5000TVC <50 Agrees (A)
50A<8500TVC<100A
100A<10000TVC<150A
150A<13500TVC<200A
200A<15000TVC<250A
250A<18500TVC<300A
300A<20000TVC<300A
350A<23500TVC<400A
400A<25000TVC<450A
500A<28500TVC<550A
500A<30000TVC<550A
550A<33500TVC<600A
600A<35000TVC<650A
650A<38500TVC<700A
700A<40000TVC<750A
750A<43500TVC<800A
800A<45000TVC<850A
850A<48500TVC<900A
900A<50000TVC<950A
950A<53500TVC<1000A
1000A<55000TVC<1050A
And so on...

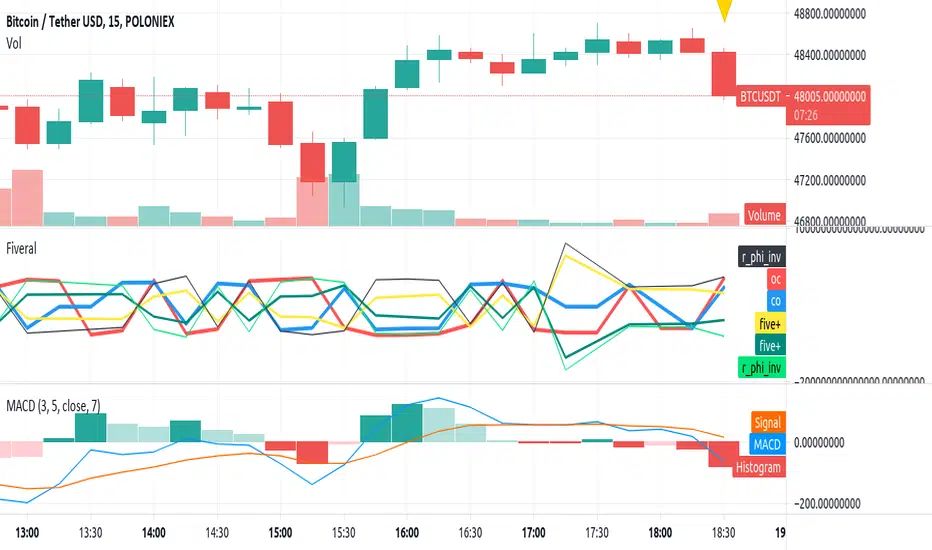
Fiveral: Repulsion/Golden Radio HackAnother in a series of experimental indicators using logarithmic scale visualisation.
This one extends into some work on I've been doing on 'the cube', but Pine isn't liking multiple log lines even when the equations are included for each plotted variable, meaning, no variables used in the definition of a variable, as is done here. As a result, accuracy of this indicator can't be guaranteed between scales, or during use.
Have at it, and enjoy!
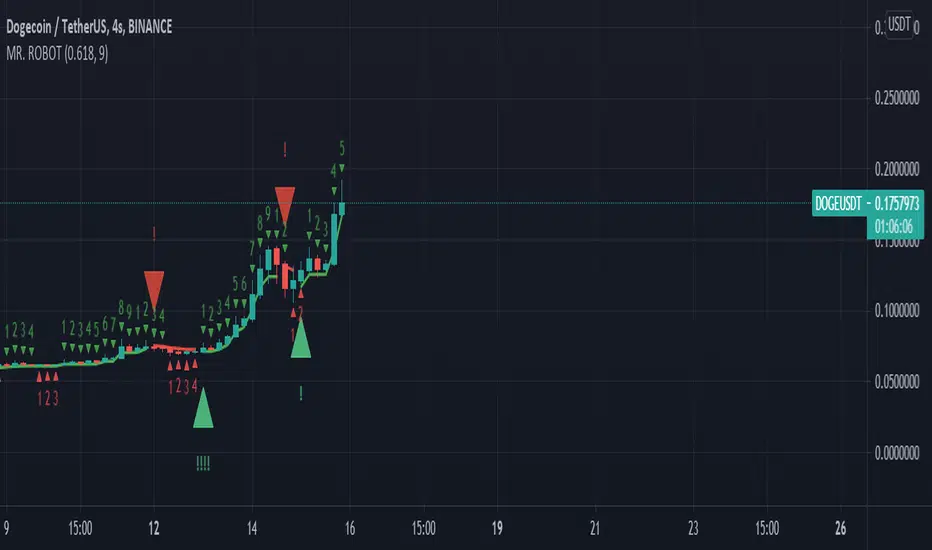
MR. ROBOT v.1.0.0This script consists of a logical blend of TD Sequental, MACD and Stochastic RSI based on the Supertrend function. In addition, these indicators use the golden proportional point of each candle as a source.
The exclamations on the signal indicating signs express the strength of the signal and consist of four levels;
! : Weak level signal
!! : Partial level signal
!!! : Medium signal
!!!! : High level signal
The fact that these interjections refer to four different levels is related to the programmatic consideration of four different indicators and functions. Since the script is based on four different indicators
basically, the exclamation numbers of the signals are related to how many indicators are signaling at the same time. However, it does not always overlap. For example, when 3 indicators signal at the same time, 3 exclamation points may not appear on the signal sign. This is because the script also takes into account special bar algorithms.
The only setting that you can intervene on the script - for now - is the multiplier and length values of the supertrend function. Changing these settings changes the signal strengths and frequencies. The script is based on the supertrend function alone, it is the ability to follow the trend after the signals given by the internal indicators. This situation decreases the rate of false signals and frequent signals in internal indicators.
This script or its author is not responsible in any way for any profits or losses arising from transactions. Does not contain investment advice.
Pi Cycle Top IndicatorIndicator Overview
The Pi Cycle Top Indicator has historically been effective in picking out the timing of market cycle highs to within 3 days.
It uses the 111 day moving average (111DMA) and a newly created multiple of the 350 day moving average, the 350DMA x 2.
Note: The multiple is of the price values of the 350DMA not the number of days.
For the past three market cycles, when the 111DMA moves up and crosses the 350DMA x 2 we see that it coincides with the price of Bitcoin peaking.
It is also interesting to note that 350 / 111 is 3.153, which is very close to Pi = 3.142. In fact, it is the closest we can get to Pi when dividing 350 by another whole number.
It once again demonstrates the cyclical nature of Bitcoin price action over long time frames. Though in this instance it does so with a high degree of accuracy over the past 7 years.
How It Can Be Used
Pi Cycle Top is useful to indicate when the market is very overheated. So overheated that the shorter term moving average, which is the 111 day moving average, has reached a x2 multiple of the 350 day moving average. Historically it has proved advantageous to sell Bitcoin at this time in Bitcoin's price cycles.
Created By
Philip Swift

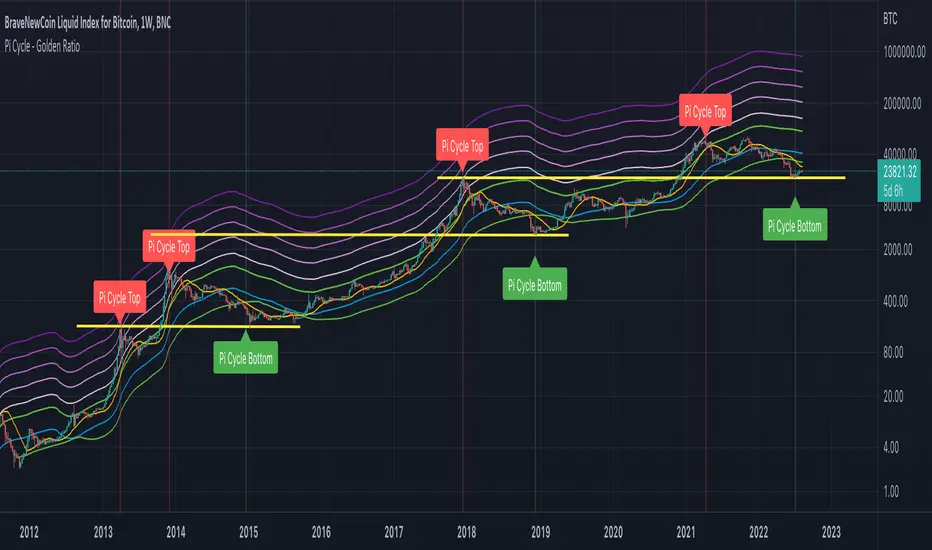
CryptoSignalScanner - Pi Cycle - Golden Ratio MultiplierDESCRIPTION:
All credits are going to Philip Swift who has written an article on Medium about the PI Cycle Top and The Golden Ratio Multiplier .
Based on the article this indicator has been created to display and indicate the Bitcoin PI Cycle Top which has historically been effective in picking out the market cycle highs within 3 days. It also displays the Golden Ratio Multiplier which explores Bitcoin's adoption curve and market cycles.
• The PI Cycle Top is based on the 350DMA (Daily Moving Average) multiplied by 2 and the 111DMA (Daily Moving Average)
• The Golden Ratio Multiplier is based on the 350DMA (Daily Moving Average) the The Golden Ratio which is defines as 350DMA * 1.61803398875 and the Fibonacci Sequence which is defined as 350DMA * 2, 350DMA * 3, 350DMA * 5, 350DMA * 8, 350DMA * 13 and 350DMA * 21
HOW TO USE:
• The PI Cycle Top is picking the market cycle tops within 3 days.
When the 350DMA x2 crosses below the 111DMA Bitcoin price peaks in its market cycle. This indicates that the market is overbought and it is time to take profit.
• The Golden Ratio Multiplier pics the top on every market cycle in Bitcoin’s history and forecasts when Bitcoin will top in the coming market cycle.
In 2011 the top was at 350DMA * 21
In 2013 the top was at 350DMA * 13
In 2014 the top was at 350DMA * 8
In 2018 the top was at 350DMA * 5
If we look at the results above the forecast for next top should be at 350DMA * 3
FEATURES:
• You can change the Long Moving Average which is by default 350
• You can change the Short Moving Average which is by default 111
• You can show/hide the Pi Cycle Top labels
• You can show/hide the Pi Cycle Bottom labels
• You can show/hide the Pi Cycle Moving Averages
• You can show/hide the Golden Ratio
• You can show/hide the Fibonacci Sequence
• You can set an alert when the Pi Cycle Top is reached
REMARKS:
• This advice is NOT financial advice.
• We do not provide personal investment advice and we are not a qualified licensed investment advisor.
• All information found here, including any ideas, opinions, views, predictions, forecasts, commentaries, suggestions, or stock picks, expressed or implied herein, are for informational, entertainment or educational purposes only and should not be construed as personal investment advice.
• We will not and cannot be held liable for any actions you take as a result of anything you read here.
• We only provide this information to help you make a better decision.
• While the information provided is believed to be accurate, it may include errors or inaccuracies.
HOW TO GET ACCESS TO THE SCRIPT:
• Access to this script is free of charge
• You can drop me a message to get access to the script
Good Luck,
SEOCO
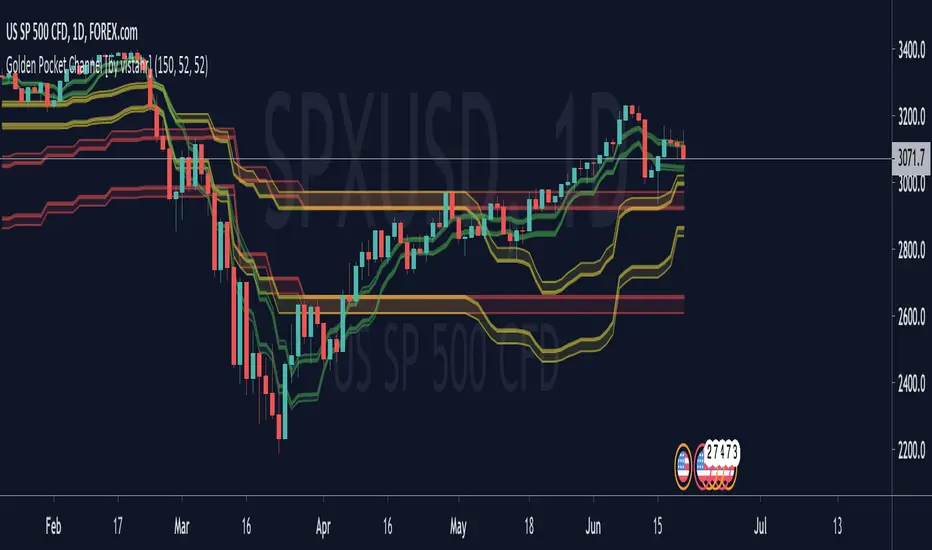
Golden Pocket Channel [by vistahr]The indicator plots the golden pocket (Fibonacci retracement 61% to 65%) of recent highs and lows. The golden pocket is calculated from the last high to the last low. The high and low are determined by the number of last bars.
The golden pocket is used for trading as support and resistance.
The length of the past highs and lows can be determined by yourself. You can define three different lengths to find the highs and lows of the past.
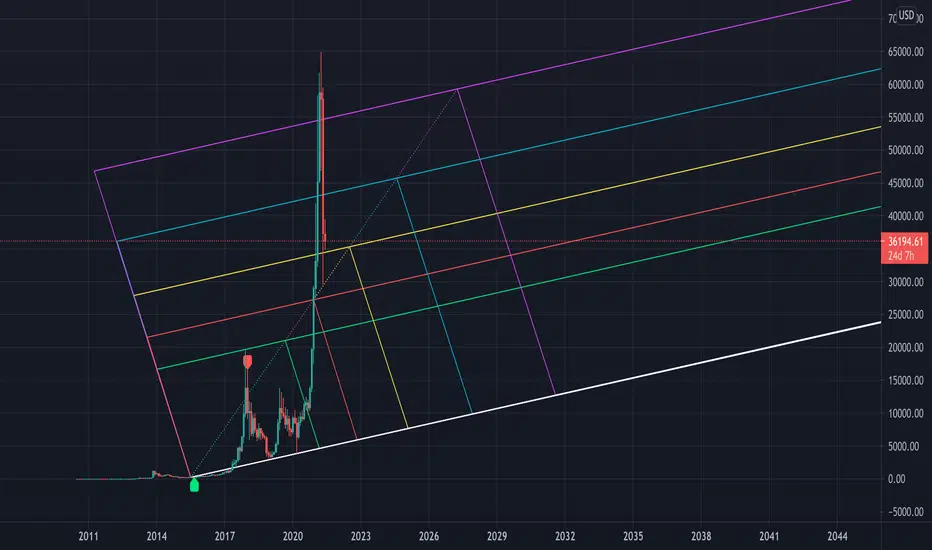
Golden Ratio MultiplesI call this "Phi Ribbons." The Golden Ratio, also known as Phi, is fantastic at predicting areas of price reversal.
Every moving average is a fibonacci multiple of the base function 355 SMA .
The rainbow above is an array of fibonacci multiples that are greater than one (1.618, 2, 2.618, 3, 5, 8, 13, 21)
The rainbow below is an array of fibonacci multiples that are less than one (0.786, 0.618, 0.5, 0.382, 0.236, 0.14)
Notice the precision of marking areas of potential price reversals
EASTER EGG: The two moving averages at the top of the script are 355 SMA & 113 SMA . This is one of the lowest ratios that closely approximates Pi (3.14159).
Simply plotting the 133 SMA will add a unique feature:
355/133 = 3.14159
When the 113 crosses below the 355 it tends to mark the end of major bullish impulses, and a crossover is a bullish sign.

Fib Thermometer - S&P500Fib Retracement is such an amazing tool 😎 , and when u incorporate it onto a chart, no matter a forex , stock or future one, you will always secure some important and meaningful levels for your trading. I am not a huge fan of it actually 😵, but I would say it is an eye opener for me, because sometimes things don't fully make sense will make you money. I can't deny its popularity in our community and also in the trading world.
In this script, I am not intending to give a brand new version of auto drawing fib levels, but to catch the optimal timings to buy the upcoming rally after a crash 😊. Buying the dips is the approach to get rich , right? But more wisely, we can instead to buy the higher lows , not the lowest lows in order to avoid the bankruptcy risk. Nothing advanced to teach here, doing so just takes your extra patience and willingness to seek confirmation. 🕵
To cut it short, I have utilized 52-week highs and lows and two important fib levels (0.236 and 0.618) , with ten most heavily weighted stocks in s&p500 index to create some awesome signals. The rationale is first defining two fib levels with the 52-week-high-low range, then if those stocks rebounded just higher than 0.236 levels, we can confirm the trend has changed and start our buying . For the 0.618 level, you can use it as a profit taker , or a sell signal during the bull run. What decides a trend continuation or a trend change is the degree of the retracement , and 0.236 would be an ideal level to confirm the trend has changed.😃
For your own convenience, you can amend or diy the script to make it work for you by simply put your favorite stocks or indexes on the list. Hope you find it really helpful and HAPPY TRADING!!! 😃
If you find my scripts useful, please click the FOLLOW button and I am VERY VERY GRATEFUL.😘

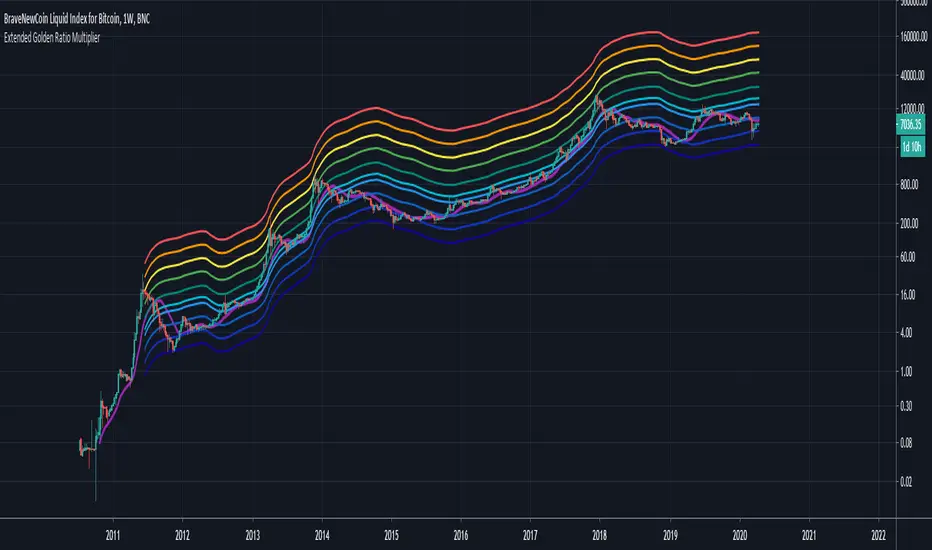
Extended Golden Ratio Fibonacci Multiplier + Pi Cycle TopHere I present the Golden Ratio Multiplier and Pi Cycle Top Indicator originally conceptualized by Philip Swift, and extend it. Due to popular demand for a nicer looking color scheme and added MAs & functionalities, I decided to publish this indicator, of course with free access for everyone as the discovery is attributed to Philip. The indicator works best for BLX (BraveNewCoin Liquid Index for Bitcoin) on daily (D) or weekly (W) timeframe. Other timeframes are not supported (and also generally not needed as this is a rather high timeframe indicator).
Added functionality:
- Additional Fibonacci MAs for Bottom: 0.618*MA(50W) and 0.382*MA(50W), which seem to be distinct high timeframe support MAs
- Pi Cycle Top and all Fibonacci MAs can be plotted or hidden individually
- Correct MA values for daily (D) and weekly (W) timeframes are automatically assigned, so you do not need to change anything when you switch between those timeframes.
It is generally said that Bitcoin's peaks always only reach a lower yearly Fibonacci MA. The next one to eye would be the 3*MA(50W) = 3*MA(350D) here plotted in dark green. Historically when the MA(16W) = MA(111D) (here plotted in magenta) line crossed the 2*MA(50W) = 2*(350D) line (plotted in cyan) from below a cycle peak is reached. This indicator might therefore be a good high timeframe indicator for Bitcoin trading. Of course this is no financial advice.