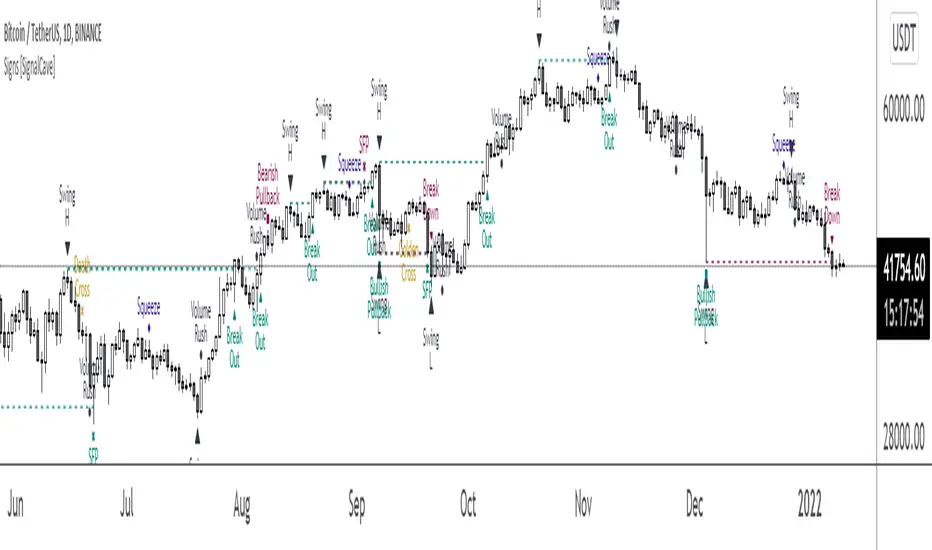
Signs [SignalCave]Swings, Engulfs, Golden & Death Crosses, Price Squeezes, Pullbacks, Breakout & Breakdowns, Volume Rushes
A swing low is when price makes a low and is immediately followed by consecutive higher lows. Likewise, a swing high is when price makes a high and is followed by consecutive lower highs.
Swing Failure Pattern (SFP) is a type of reversal pattern that can be used as buy or sell signals.
Engulfing candles tend to signal a reversal of the current trend in the market. This specific pattern involves two candles with the latter candle 'engulfing' the entire body of the candle before it.
On this indicator, bullish engulfs visible only on downtrend and oversold conditions. Bearish engulfs visible only on uptrend and overbought conditions.
The death cross and golden cross are technical analysis terms for when a moving average (MA) intersects with another from either above or below.
The cross, depending on which it is, can signal the start of a new trend or the end of one.
Squeeze signs signifies low volatility, market preparing itself for an explosive move up or down direction.
Bullish Pullbacks are widely seen as buying opportunities after an asset has experienced a large upward price movement. Most pullbacks involve an asset's price moving to an area of technical support , such as a moving average, before resuming their uptrend.
Bearish Pullbacks are widely seen as selling opportunities after an asset has experienced a large downward price movement. Most pullbacks involve an asset's price moving to an area of technical resistance , such as a moving average, before resuming their downtrend.
A breakout refers to when the price of an asset moves above a resistance area, breakdown refers to when the price of an asset moves below a support area.
Breakouts/breakdowns indicate the potential for the price to start trending in the breakout direction.
For example, a breakout to the upside from a chart pattern could indicate the price will start trending higher.
Volume rush signs appears when the trading volume increases more then a usual period. It can be useful with combining breakout signals as a confirmation.
Alerts are available for various conditions such as "Bullish/Bearish SFP, New Swing High/Low, Breakout/Breakdown, Bullish/Bearish Engulf, Golden & Death Cross, Bullish/Bearish Pullbacks, Squeeze, Volume Rush"
Type asset name on symbol search area.
Adjust your timeframe that you wish to track.
Click "Create Alert" .
Select one of the condition that you wish to get inform from create alert panel.
Select "Once Per Bar Close" option.
Click "Create" .
Goldencross
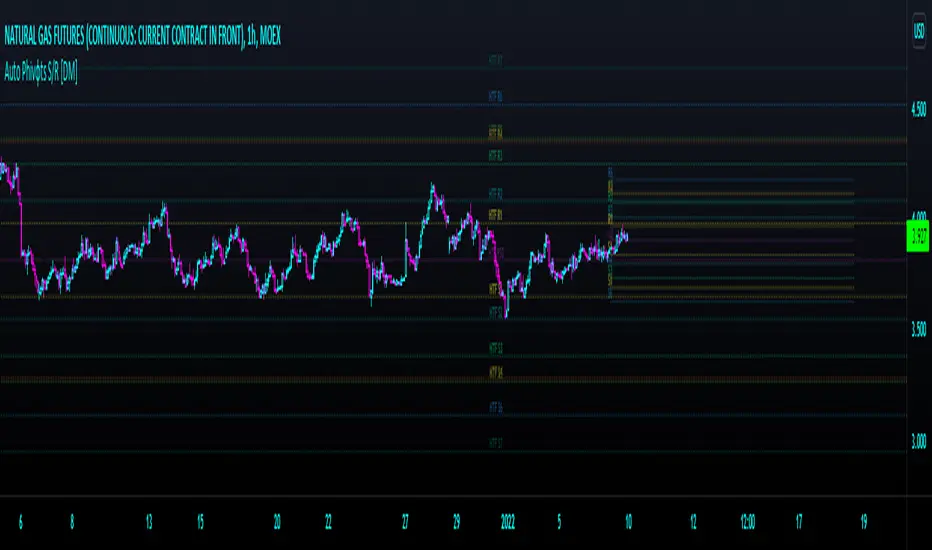
Auto Phivots PP S/R Log /Lin V2 [DM]Greetings, I cover version two since the code has had great changes.
This script has two time frames with a separate symbol from the main window.
Alerts for the two different configurable time frames.
Van use for a big ranges or small and Log Scales.
The colors, extensions, thickness, style of the lines and the labels are completely configurable.
With a few small adjustments it can be used in a separate window with another symbol
Enjoy BigfOOts
KayipAdisyon - ATH / ATL - EMA - Golden / Death Cross - RSI50-167-200 EMA , ATH/ATL information widget, Golden & Death Cross lines and RSI bands...

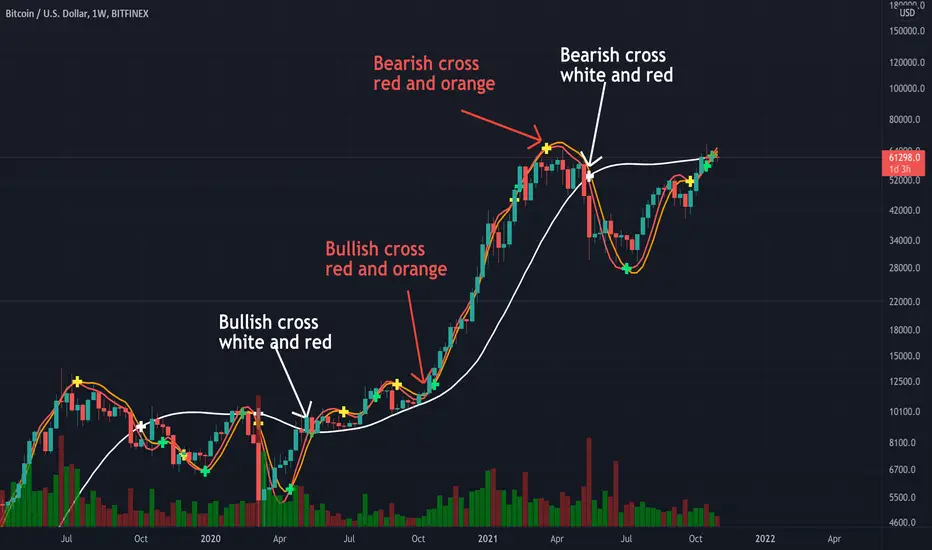
Triple Modified Hull Moving Average Cross By <Zakaria>Triple Modified Hull Moving Average Cross By
What is this?
this is a modified formula for Hull moving average, it is more accurate and predicts the golden and death cross earlier.
How to use?
Work better in high time frames (1D,1W)
the white line vs the red and the orange lines :
1 - when the white line crosses the red and the orange lines from the bottom the price will go down . Death cross!
2 - when the white line crosses the red and the orange lines from the top the price will go up . Golden Cross!
the red line vs the orange line :
1- when the orange line crosses the red line from the bottom the price will go down . Death cross!
2 - when the orange line crosses the red line from the top the price will go up . Golden Cross!
p.s: the lag between these two lines will be very small. use it in the 1W time frame to predict where exactly the bull market will end.
You can input your personalized values if you want!
SMA PredictionThis indicator predicts future moving average (SMA) values assuming the prices remains at configured level (-50% to +50%).
It can be used to predict golden/death crosses as well - when two of these indicators are on - one configured for length 50 and one for length 200.
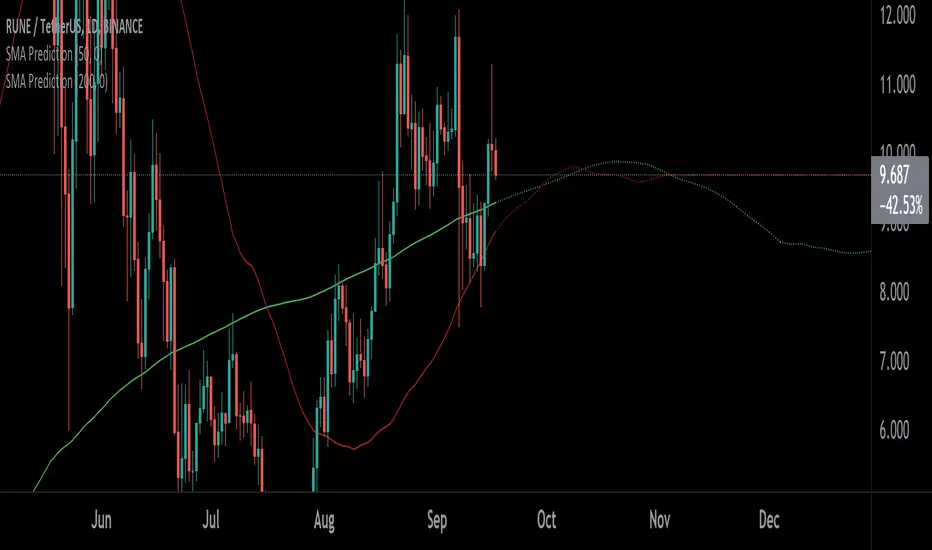
Golden/Death Cross PredictionScript which calculates/predicts future golden/death cross times assuming the prices remains at configured level (-50% to +50% relative to current price)

Long only EMA CROSS 8/50/200 BacktestImprove EMA CROSS 8/50/200 with adjustable Exit EMA Level, and can open trade only when above EMA200

Golden/Death Cross Predictor (by Alex L.)Golden/Death Cross indicator to picture if we're in a Bull or Bear trend, but it's much more - it indicates a potential upcoming golden/death cross, draws a potential continuation of the moving averages to indicate when it might occur, shows a 4-hourly cross which can often alert of a potential trend reversal, and is multi timeframe!
Potential Golden/Death Cross Mark - shows a potential upcoming golden/death cross (with approximate % for its occurrence as a hint).
Potential Golden/Death Cross Projection - shows a potential continuation of the MAs to visually illustrate when the potential cross might occur.
Actual Golden/Death Cross Mark - all previous golden/death crosses are marked on chart with a green/red "X" (which is when indicator's "Short Term MA" crosses "Long Term MA" up or down).
Actual 4-hourly Golden/Death Cross Mark - shows latest golden/death cross on 4-hourly timeframe (regardless of chart's timeframe), which can alert of potential higher timeframe trend reversal.
Multi Timeframe - you can set indicator's timeframe having chart in different timeframe.
Enjoy!

Easy Entry/Exit Trend Colors (With Alerts)This is an updated version of user Algokid's script called 'AK MACD BB INDICATOR V 1.00'. You can find that original script here:
I added many alerts along with the Bullish and Bearish alerts when the MACD crosses over the Upperband or crosses down on the Lowerband.
I personally use this indicator with Crypto charts (Bitcoin on a 15min, 1hour, and 4 hour timeframe) as one of many confirmations that it's a good time to enter a trade. This script was made to be easy to follow with the colors of GREEN triangles being a good uptrend or entry confirmation, and RED being a confirmation to sell/short or exit your trade.
It's important to use this indicator in combination with other indicators that can give you more confirmations to enter or exit a trade, and make sure you are on normal candles and not HA or any other candles as you can get wildly inaccurate results.
This script also has the Death & Golden crosses, which is the slow and fast moving averages crossing over each other. I don't use this as an additional confirmation, it's just nice to know where the cross happens.

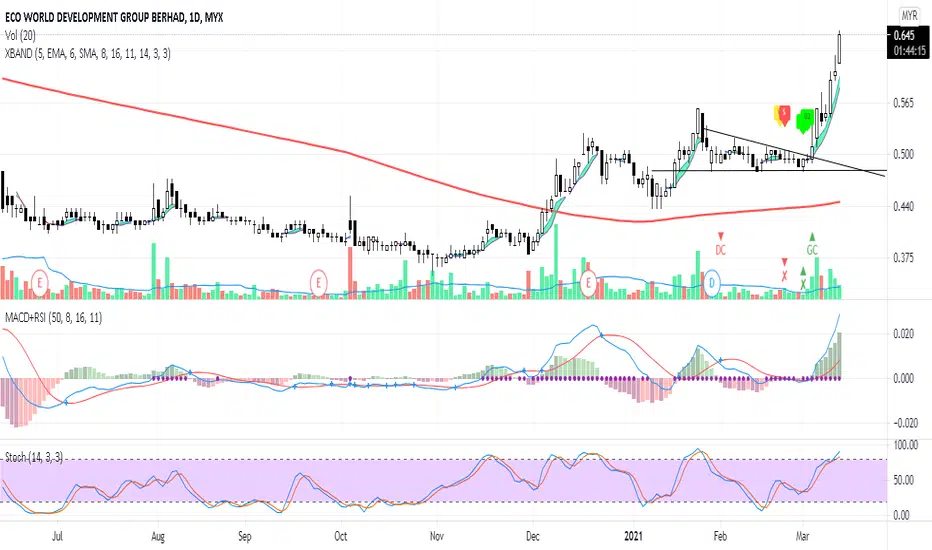
XBANDCombination of 3 Moving Average:
- Preset setting for MA 1 : SMA 5 (can be changed in setting)
- Preset setting for MA 2 : SMA 6 (can be changed in setting)
- Preset setting for SMA 200 (can't be changed)
Labels for Moving Average actions:
- Label B1 (lime color) : Current MA 1 price greater than previous MA 1 price
- Label B2 (lime color) : MA 1 crossed up MA 2
- Label W (yellow color) : Current MA 1 price lower than previous MA 1 price
- Label S (red color) : MA 1 crossed down MA 2
- Green Cloud: MA 1 crossed up MA 2
MACD (only display labels on chart):
- Preset setting for MACD 18, 16 & 11 (can be changed in setting)
- Label GC (green color) : Golden Cross occurred
- Label DC (red color) : Death Cross occurred
Stochastic (only display labels on chart):
- Uses default setting (can be changed in setting)
- Label x up (green color) : Stochastic k cross D
- Label x down (red color) : Stochastic D cross k
Notes:
Notes: This indicator is a secondary indicator. Therefore, you shouldn't used it solely for trading.
Multi Moving Average Crossing (by Coinrule)Moving Averages are among the most common trading indicators. They are straightforward to interpret and effective to use.
One of the limitations of using moving averages is they can provide buy and sell signals with a relatively high lag , making it very difficult to spot the lows and tops of the trend.
Moving averages calculated with a low number of periods like the MA9 (the average of the previous nine price periods) react very fast to price moves providing prompt signals. On the other side, more signals may end up with more false-signals and more trades in a loss.
On the contrary, moving averages calculated with a higher number of periods like the MA100 (which considers the previous one hundred price periods) give more reliable signals, but with a delay.
A system catching the crossing of the MA50 over the MA100 is a good compromise for successful long-term strategies. It provides, on average, reliable buy signals.
The Multi Moving Average Crossing Strategy tries to optimize the exit without waiting for the same opposite crossing (MA50 below MA100). It uses the MA9 crossing below the MA50, instead, to spot a better time for selling.
The setup is as follows.
BUY when the Moving Average 50 crosses above the Moving Average 100
SELL when the Moving Average 9 crosses below the Moving Average 50
The higher is the time frame to calculate the Moving Averages, the better is the overall performance of the strategy. The 4-hour (or 6-hour) time frame seems to be the best, even if it results in fewer trades. If you want to trade more still with good results, the 1-hour time is a good compromise.
Advantages of the strategy
This strategy seeks to catch those that are more likely relevant uptrends and close the trade relatively quickly. More trades mean more opportunities. This is especially effective if you run the strategy on all the available coins on the market, as you could do with Coinrule.
Generally, a Multi Moving Averages approach beats the classic crossing strategy involving only two Moving Averages. We backtested a sample of twenty trading pairs to assess the benefits empirically.
The results show that the Multi Moving Average Strategy
outperforms 13 out of 20 times
has 95% higher average return
has 67% higher median return
The strategy assumes each order to trade 30% of the available capital and opens a trade at a time. A trading fee of 0.1% is taken into account.

EMA Cross LevelsCalculates fast and slow moving averages of lengths(inputs= 'n_fast', 'n_slow').
Plots the price level of the most recent cross. If bullish cross (fast crosses up over slow), color = green, and color=red if cross was bearish.

Crypto EMA+MA+MACS by hobbeLeThis is an indicator that includes several EMAs and MAs (Used in Cryptotrading).
In addition, the Golden and Death Cross are also displayed.
Used MAs
MA 7 - Orange Line
MA 21 - Yellow Line
MA 25 - Grey Line
MA 99 - Blue Line
MA 200 - Green Line
Used EMAs
EMA 200 - Grey Dotted Line
EMA 222 - Pink Dotted Line
Golden Cross
Crossover MA25 + MA200
Death Cross
Crossunder MA25 + MA200
What is a Moving Average (MA) ?
A moving average (MA) is a widely used indicator in technical analysis that helps smooth out price action by filtering out the “noise” from random short-term price fluctuations.
Moving average is a trend-following, or lagging, indicator because it is based on past prices. The most common applications of moving averages are:
to identify the trend direction
to determine support and resistance levels
The two basic and commonly used moving averages are the simple moving average ( SMA ), which is the arithmetic average of a security over a defined number of time periods, and the exponential moving average ( EMA ), which gives greater weight to more recent prices.
What is a Golden Cross?
The golden cross is a candlestick pattern that is a bullish signal in which a relatively short-term moving average crosses above a long-term moving average. The golden cross is a bullish breakout pattern formed from a crossover involving a security's short-term moving average (such as the 15-day moving average) breaking above its long-term moving average (such as the 50-day moving average) or resistance level. As long-term indicators carry more weight, the golden cross indicates a bull market on the horizon and is reinforced by high trading volumes.
What Is a Death Cross?
The death cross is a technical chart pattern indicating the potential for a major selloff. The death cross appears on a chart when a stock’s short-term moving average crosses below its long-term moving average.
Source; Investopedia

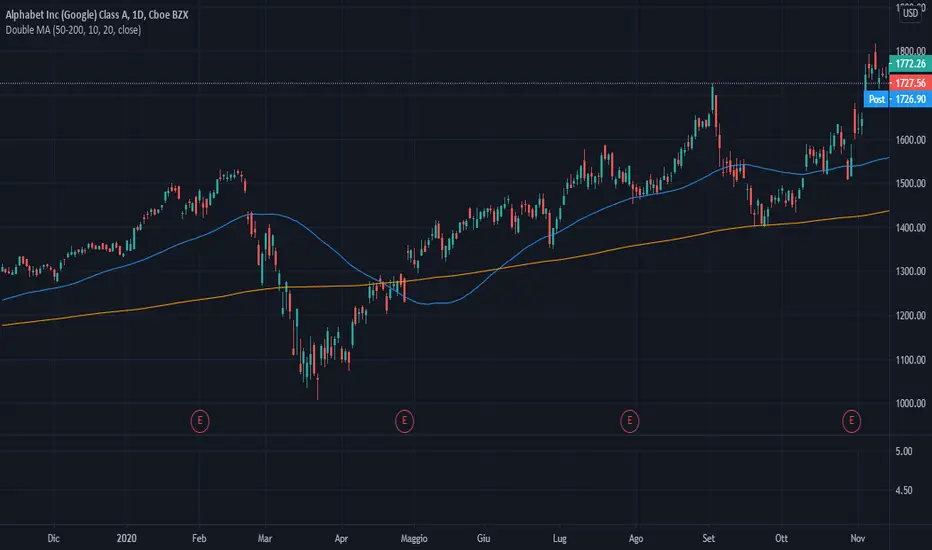
Double Moving AverageWith this script you can view TWO moving average with ONE indicator (really helpful if you have the limit of four indicator in the chart).
It is very simple to use:
1) In "Preset" you can choose between three standard pairs (7-21, 11-22, 50-200) or "Custom".
2) The parameters "Custom M1" and "Custom M2" only work if "Custom Preset" is selected, otherwise they are IGNORED.
Easy Loot Golden CrossGolden/Death Cross Moving Average Indicator
30, 100 & 200 period Simple Moving Average (SMA).
30 = Yellow
100 = Green
200 = Black
Black crosses mark the 'golden crosses' as well as the 'death crosses'. These black crosses appear when the 30 crosses the 100 & when the 100 crosses the 200. These black crosses don't tell you when to buy/sell, but simply indicate interest in the market.
This code is open-source so feel free to add this indicator to your chart and play around with the different moving average timeframes & color schemes.
Golden Cross
The golden cross occurs when a short-term moving average crosses over a major long-term moving average to the upside and is interpreted by analysts and traders as signaling a definitive upward turn in a market. Basically, the short-term average trends up faster than the long-term average, until they cross.
There are three stages to a golden cross:
A downtrend that eventually ends as selling is depleted
A second stage where the shorter moving average crosses up through the longer moving average
Finally, the continuing uptrend, hopefully leading to higher prices
Death Cross
Conversely, a similar downside moving average crossover constitutes the death cross and is understood to signal a decisive downturn in a market. The death cross occurs when the short term average trends down and crosses the long-term average, basically going in the opposite direction of the golden cross.
The death cross preceded the economic downturns in 1929, 1938, 1974, and 2008.

Long only strategy VWAP with BB and Golden Cross EMA50/200
This is strategy, mainly designed for stock markets
It makes uses of the EMA 50/ 200 ( Golden cross) and VWAP and Bollinger bands.
It only takes long positions. It can be adapted to all time frames, but preferably to be used with longer timeframes 1h +
The rules for entry are the next ones :
1. EMA50 > EMA 200
2. if current close > vwap session value
3. check if price dipped BB lower band for any of last 10 candles
EXIT RULE
1. price closes above BB upper
STOP LOSS EXIT
1. As configured --- default is set to 1%

MACD/EMA Golden CrossThis is a slight modification to the MACD indicator. The golden cross indicator makes use of EMA 7 and EMA 21 as well as MACD together, in which it will turn the MACD line yellow & fill the MACD with a yellow background when MACD is above the signal line and EMA7 is above EMA21. This is best suited for swing trading on a daily timeframe.

Golden & Death CrossThis indicator allows you to see Golden Cross and Death Cross.
Each Sma line can be hidden.
It is for educational purposes only.
Enjoy it.
Best Regards,
Bilgin , Kaptanin Seyir Defteri

MACD_trendtrader v2 (picte)This is an upgraded version of my MACD_trendtrader indicator.
UPGRADES:
- Histogram slope changes colors according to the direction of the slope.
- Panel that displays volatility of the asset. The volatility is measured from 0 to 100. Zero being the lowest and 100 the highest volatility. I also included different text colors for a certain volatility value (white= very low volatility, blue = low volatility, purple= high volatility, green= very high volatility)
It works well on all time-frames but i found it particularly useful on the lower time-frames for identifying pullbacks in a trending market.
It has been tested in the Forex and Traditional market.

Ultimate Moving Averages (SMA & EMA)Welcome to the Ultimate Moving Average indicator.
Never again spend time looking for EMA / SMA indicators when you can have them all in this single indicator.
Options include :
Daily Chart: Classic Golden / Death Cross - 50/D and 200/D SMA
Daily Chart: 3-day Golden / Death Cross - 150/D and 600/D SMA
Daily Chart: 140/D SMA
Daily Chart: 700/D SMA
Daily Chart: 1458/D SMA
Daily Chart: Golden Ratio Multiplier
Any Chart: Scalping
9 SMA
10 SMA
20 SMA
21 SMA
30 SMA
34 SMA
50 SMA
80 SMA
100 SMA
200 SMA
8 EMA
10 EMA
13 EMA
20 EMA
21 EMA
26 EMA
30 EMA
34 EMA
50 EMA
55 EMA
80 EMA
89 EMA
100 EMA
200 EMA

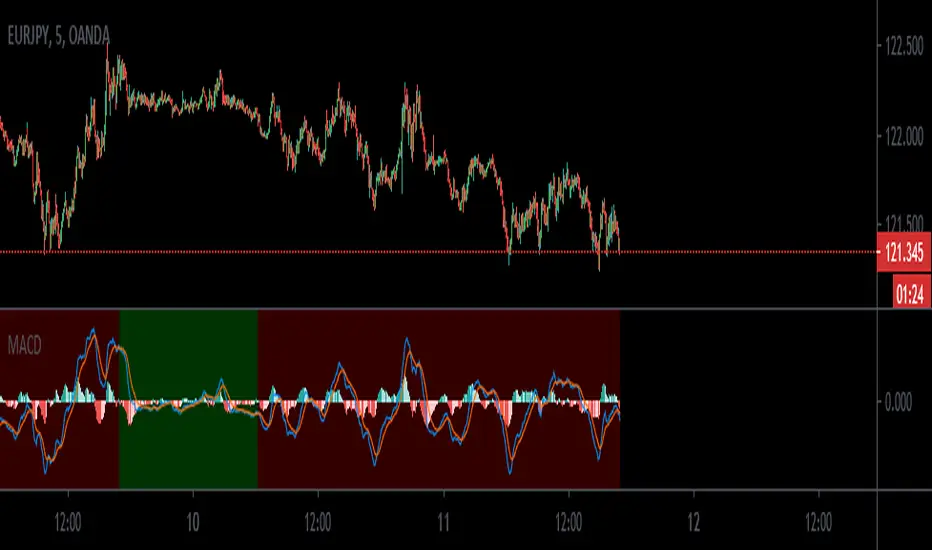
MACD_trendtraderThis is my modified macd indicator. It uses moving averages to determine the trend of the market. It is best used on lower time frames such as 5min and 15min. I found it useful especially with Forex pairs and also traditional markets.
This indicator will help you get in at a pullback in a trending market.
RED background tells you the trend is down. A possible entry happens when you get a sell signal from the macd oscillator above the 0 line.
GREEN background tells you the trend is up. A possible entry happens when you get a buy signal from the macd oscillator below the 0 line.
a couple of examples:
Leave your feedback in the comments. Enjoy:)
Big Picture 50/200Crazy as this may sound, it took 126 iterations to get something so simple sone right.
Big Picture helps offload some longer-term SMA lines off your chart so you can clutter it up again with some other stuff. It works by comparing SMAs 50 and 200 in histogram form. If the histogram is over the zero-line, 50 is over 200, and vice versa.
The histogram is green when the slope rises, suggesting that 50 is rising relative to 200. When the histogram turns red, 50 is falling.
Some Heikin-Ashi inspired averaging helps smooth the line just a little to help give a better idea as to overall trend.

[JOHN] CROSSHello this is CROSS indicator. (work on ALTCOINS, BTC AND ETH)
---------------------------------
How this indicator work?
CROSS script work with MOVING AVERAGES and MA CROSS DISPLAYED ON CHART.
This system provide
- Possible buy/sell zones, to catch bull and bear cycle. (H4 AND D1 WORK PERFECTLY)
----> YELLOW BARS BUY
----> RED BAR SELL (TAKE PROFIT ON POSITION OR SHORT)
- Crossover of the 2 Moving averages ploting on chart with "GOLDEN CROSS" and "DEATH CROSS" with alert condition included if you want receive alerts.
BELOW SOME EXAMPLE WITH SOME COINS
Remember the rules and watch the charts below
YELLOW CANDLES = BUY
RED CANDLE = SELL
----------------------
LEO / BTC
MATIC / BTC
XTZ / BTC
LINK / BTC
ETH / BTC
ETH / USDT
BTC / USDT
THIS CAN BE USED WITH KNIFE CUT INDICATOR FOR HELP ON BIAS.
----------------------
i hope you like, if you have question please comment below
i will help you.
Thanks
