Forexsebi - DAX Future Psychological Levels - TrendflowTrendflow is an advanced TradingView indicator combining psychological price levels with trend and multi-timeframe analysis.
The indicator automatically plots psychological levels in around the current price. Each level is visualized using horizontal lines and price zones (boxes) to clearly highlight potential support and resistance areas.
Psychological Levels – Trendflow ist ein fortschrittlicher TradingView-Indikator , der wichtige psychologische Preislevel mit einer klaren Trend- und Multi-Timeframe-Analyse kombiniert.
Trend Analysis with SMAs
SMA 50 & SMA 200 plotted directly on the chart
Individually toggleable
Clear color separation for fast trend recognition
Multi-Timeframe SMA Trend Table
Trend status (BULLISH / BEARISH / NEUTRAL) across:
5M, 15M, 1H, 4H, 1D
Logic: Price relative to SMA 50 & SMA 200
Color-coded, easy-to-read table
Info Box
Current Gold price
Nearest psychological level above and below price
Alert System
Alerts when price approaches a psychological level
User-defined alert distance
Futures

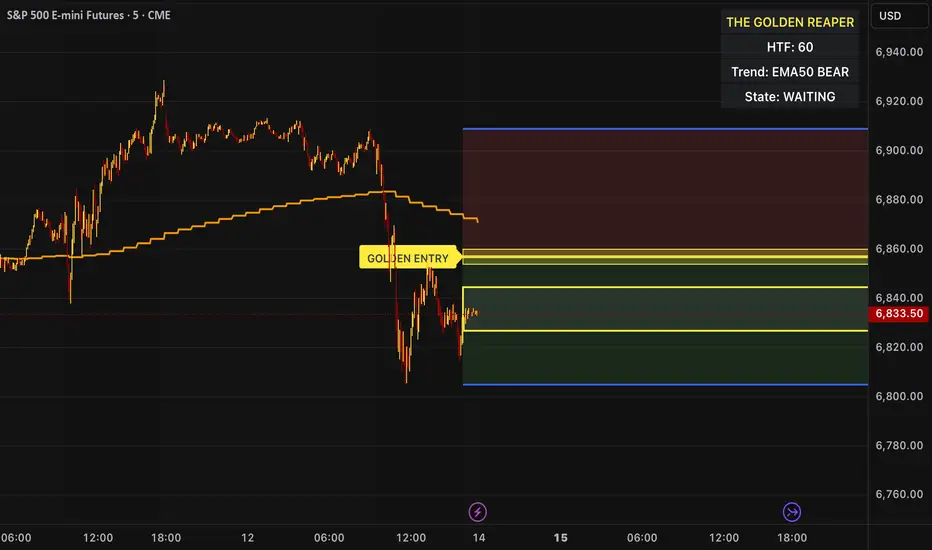
The Golden Reaper 🟡 THE GOLDEN REAPER
HTF OTE + EMA50 — Futures Scalping Framework
The Golden Reaper is a high-timeframe execution framework designed specifically for futures scalpers who trade with precision, patience, and structure.
This indicator focuses on HTF market structure, Optimal Trade Entry (OTE) zones, and equilibrium (50%) reclaim confirmation to identify high-probability execution areas for fast, controlled scalps.
It is not a signal spam tool.
It is a framework built for disciplined traders who wait for price to come to them.
⸻
🔑 Designed For
✔ Futures markets (ES, NQ, MNQ, MES, GC, MGC, CL, etc.)
✔ Scalpers & intraday traders
✔ 1H structure → 5m / 1m execution
✔ Traders who prefer few high-quality setups
⸻
🧠 Core Logic (How It Works)
1️⃣ High-Timeframe Structure (HTF)
The indicator identifies the most recent HTF swing high and low to define the active trading leg.
2️⃣ OTE Zone (Premium / Discount)
Price is expected to react within the OTE zone where liquidity is commonly targeted.
3️⃣ Golden Entry (EQ 50%)
The 50% equilibrium level is marked as the Golden Entry.
Price must reclaim this level for a setup to become valid.
4️⃣ Golden Execution Zone
After reclaim, a golden execution zone appears to define where entries are allowed.
5️⃣ EMA 50 Trend Filter
Trades are taken only in the direction of the HTF EMA 50 to avoid counter-trend scalps.
⸻
⚡ How Futures Scalpers Use It
Recommended Timeframes
• HTF Structure: 1 Hour
• Execution: 5 Minute / 1 Minute
Process
• Wait for price to reach the OTE zone
• Allow the setup to arm
• Enter only after price reclaims the Golden Entry
• Execute within the Golden Execution Zone
• Manage stops and targets manually
This approach helps scalpers:
✔ Avoid chasing price
✔ Reduce over-trading
✔ Improve entry precision
✔ Maintain consistency
⸻
🔔 Alerts Included
• OTE Touched – Setup is armed
• C-Reclaim Confirmed – Entry condition met
(Alerts are designed to assist — not replace — trader judgment.)
⸻
⚠️ Important Notes
• Designed for futures markets only
• Best used with price action confirmation
• No built-in stop loss or take profit (manual risk management required)
• Not financial advice
⸻
🧬 Who This Indicator Is For
✔ Futures scalpers
✔ ICT / Smart Money traders
✔ Structure-based traders
✔ Traders who value patience over frequency
❌ Not for:
• Signal chasers
• Indicator stacking
• Automated trading
• Beginners who want instant entries
⸻
🟡 Created By
ChartReaper / Tactiko
Instagram:
@officialchartreaper
@tactiko
MorphWave Bands [JOAT]MorphWave Bands - Adaptive Volatility Envelope System
MorphWave Bands create a dynamic price envelope that automatically adjusts its width based on current market conditions. Unlike static Bollinger Bands, this indicator blends ATR and standard deviation with an efficiency ratio to expand during trending conditions and contract during consolidation.
What This Indicator Does
Plots adaptive upper and lower bands around a customizable moving average basis
Automatically adjusts band width using a blend of ATR and standard deviation
Detects volatility squeezes when bands contract to historical lows
Highlights breakouts when price moves beyond the bands
Provides squeeze alerts for anticipating volatility expansion
Adaptive Mechanism
The bands adapt through a multi-step process:
// Blend ATR and Standard Deviation
blendedVol = useAtrBlend ? (atrVal * 0.6 + stdVal * 0.4) : stdVal
// Normalize volatility to its historical range
volNorm = (blendedVol - volLow) / (volHigh - volLow)
// Create adaptive multiplier
adaptMult = baseMult * (0.5 + volNorm * adaptSens)
This creates bands that respond to market regime changes while maintaining stability.
Squeeze Detection
A squeeze is identified when band width drops below a specified percentile of its historical range:
Background highlighting indicates active squeeze conditions
Low percentile readings suggest compressed volatility
Squeeze exits often precede directional moves
Inputs Overview
Band Length — Period for basis calculation (default: 20)
Base Multiplier — Starting band width multiplier (default: 2.0)
MA Type — Choose from SMA, EMA, WMA, VWMA, or HMA
Adaptation Lookback — Historical period for normalization (default: 50)
Adaptation Sensitivity — How much bands respond to volatility changes
Squeeze Threshold — Percentile below which squeeze is detected
Dashboard Information
Current trend direction relative to basis and bands
Band width percentage
Squeeze status (Active or None)
Efficiency ratio
Current adaptive multiplier value
How to Use It
Look for squeeze conditions as potential precursors to breakouts
Use band touches as dynamic support/resistance references
Monitor breakout signals when price closes beyond bands
Combine with momentum indicators for directional confirmation
Alerts
Upper/Lower Breakout — Price exceeds band boundaries
Squeeze Entry/Exit — Volatility compression begins or ends
Basis Crosses — Price crosses the center line
This indicator is provided for educational purposes. It does not constitute financial advice.
— Made with passion by officialjackofalltrades

Vib ORB Range (Free)Vib ORB Range (Free) plots the Opening Range High and Low for the session based on a user-defined start time and duration.
This tool is designed for traders who want a clean, no-noise display of the ORB zone without extra indicators or automation.
Features:
Customizable Opening Range start time
Customizable Opening Range duration
Automatically resets daily
Plots ORB High, ORB Low, and optional ORB Midline
Shaded range zone for improved clarity
Works on all timeframes and markets
How to Use:
Set the ORB start time (default 9:30 New York)
Set the ORB duration (default 15 minutes)
The indicator will draw the ORB zone once the range completes
Use the outlines or shaded zone to visually identify potential breakout areas
This free tool is intended as a simple, reliable ORB visualizer without alerts, filters, or strategy logic.

Quantellics: NQ Reverse From EMA [Strategy]//@version=5
// © 2025 Quantellics. All rights reserved.
strategy("Quantellics: NQ Reverse From EMA ", overlay = true, default_qty_type = strategy.percent_of_equity, default_qty_value = 100, pyramiding = 0)
// Inputs
emaLen = input.int(60, "EMA Length", minval = 1)
rsiLen = input.int(14, "RSI Length", minval = 1)
lb = input.int(10, "Lookback Candles", minval = 1)
entryOff = input.float(75.0, "Entry Offset ($)", minval = 0, step = 1)
slDollar = input.float(50.0, "Stop Loss ($)", minval = 0, step = 1)
tpDollar = input.float(50.0, "Take Profit ($)", minval = 0, step = 1)
trailAct = input.float(30.0, "Trail Activation ($)", minval = 0, step = 1)
trailOff = input.float(30.0, "Trail Offset ($)", minval = 0, step = 1)
trailDelay = input.int(2, "Trail Delay (Candles)", minval = 0, step = 1)
ssH = input.int(9, "Session Start Hour (ET)", minval = 0, maxval = 23)
ssM = input.int(30, "Session Start Minute (ET)", minval = 0, maxval = 59)
seH = input.int(12, "Session End Hour (ET)", minval = 0, maxval = 23)
seM = input.int(0, "Session End Minute (ET)", minval = 0, maxval = 59)
// Session calc
int h = hour(time, "America/New_York")
int m = minute(time, "America/New_York")
sStart = ssH * 60 + ssM
sEnd = seH * 60 + seM
nowMin = h * 60 + m
inSess = nowMin >= sStart and nowMin < sEnd
eos = nowMin >= sEnd
// Indicators
ema60 = ta.ema(close, emaLen)
rsi = ta.rsi(close, rsiLen)
hiN = ta.highest(high, lb)
loN = ta.lowest(low, lb)
// Levels
longLvl = hiN - entryOff
shortLvl = loN + entryOff
// Conditions
longOk = high > ema60 and rsi > 50 and strategy.position_size == 0 and inSess and not eos
shortOk = low < ema60 and rsi < 50 and strategy.position_size == 0 and inSess and not eos
// State
var float ePrice = na
var float slLvl = na
var float tpLvl = na
var int bars = 0
if strategy.position_size != 0
bars += 1
else
bars := 0
// Orders
if longOk
strategy.entry("Long", strategy.long, limit = longLvl)
else
strategy.cancel("Long")
if shortOk
strategy.entry("Short", strategy.short, limit = shortLvl)
else
strategy.cancel("Short")
if strategy.position_size > 0
if bars > trailDelay
strategy.exit("Long Exit", "Long", stop = strategy.position_avg_price - slDollar, limit = strategy.position_avg_price + tpDollar, trail_points = trailAct, trail_offset = trailOff)
else
strategy.exit("Long Exit", "Long", stop = strategy.position_avg_price - slDollar, limit = strategy.position_avg_price + tpDollar)
if strategy.position_size < 0
if bars > trailDelay
strategy.exit("Short Exit", "Short", stop = strategy.position_avg_price + slDollar, limit = strategy.position_avg_price - tpDollar, trail_points = trailAct, trail_offset = trailOff)
else
strategy.exit("Short Exit", "Short", stop = strategy.position_avg_price + slDollar, limit = strategy.position_avg_price - tpDollar)
// EOS flat
if eos and strategy.position_size != 0
strategy.close_all(comment = "EOS Exit")
if eos
strategy.cancel_all()
// Tracking
if strategy.position_size > 0 and strategy.position_size <= 0
ePrice := strategy.position_avg_price
slLvl := ePrice - slDollar
tpLvl := ePrice + tpDollar
if strategy.position_size < 0 and strategy.position_size >= 0
ePrice := strategy.position_avg_price
slLvl := ePrice + slDollar
tpLvl := ePrice - tpDollar
// Plots
plot(ema60, color = color.blue, title = "EMA 60", linewidth = 2)
plot(hiN, color = color.new(color.green, 50), title = "Lookback High", linewidth = 1, style = plot.style_stepline)
plot(loN, color = color.new(color.red, 50), title = "Lookback Low", linewidth = 1, style = plot.style_stepline)
plot(longLvl, color = color.new(color.orange, 30), title = "Long Entry", linewidth = 2)
plot(shortLvl, color = color.new(color.purple, 30), title = "Short Entry", linewidth = 2)

Bayesian Order Flow Predictor📌 Bayesian Order Flow Predictor — Advanced Probability Engine for Nasdaq and Futures
This indicator is a next-generation probabilistic forecasting system designed for Nasdaq traders who rely on Order Flow, Auction Market Theory, Value Area dynamics, market structure, DOM imbalance, and Bayesian probability models.
It combines 7 professional-grade factors (DOM, CVD, RSI, EMA trend, ATR volatility, Market Structure, Value Area positioning) into a unified Bayesian probability panel that outputs a clean bullish/bearish probability curve with high-confidence reversal and trend-continuation signals.
Engineered for scalpers, day traders, futures traders, and ICT-style order flow technicians, it delivers real-time directional probability, session-aware signals, and optional news-filter exclusion.
⭐ Features
Bayesian Probability Model (0–100%)
DOM imbalance scoring across dynamic depth levels
Cumulative Volume Delta (CVD) scoring
Market structure detection (HH/LL micro-trend shifts)
RSI momentum and overbought/oversold scoring
EMA directional bias + ATR-normalized deviation
Value Area positioning (VAH / VAL / POC) with optional previous-session mode
Session filtering (only signals during active hours)
Automated news filter (exclude signals around scheduled macro events)
Bull/Bear probability zones with background coloring
Anti-repetition system (no double signals in same direction)
Designed for future scalping, futures order flow, and high-precision timing
🧠 Bayesian Probability Engine — How It Works
The model evaluates 7 independent market factors simultaneously:
DOM imbalance
CVD pressure
Market structure
RSI deviation
EMA trend
Value Area position
ATR volatility shift
Each factor is transformed into a normalized score, multiplied by its weighting parameter, and aggregated into a global score.
This score is then passed through a Bayesian logistic function to convert uncertainty into a smooth probability curve, giving traders a clean, mathematically stable, and noise-resistant forecast.
📈 Buy & Sell Signal Logic
Signals trigger when:
Bullish Probability crosses above the user threshold
Bearish Probability crosses below the opposite threshold
Session is active
No protected news event is occurring
This avoids noise, prevents over-signaling, and focuses only on high-confidence inflection points.
🎯Fully compatible with the indicator: ➡️ AI Probabilistic Orderflow scalper
Both indicators synchronize perfectly when used together:
Bayesian panel → trend probability
Scalper v1 → timing + TP/SL engine
Together they create a complete probability-driven revenue management system for scalping Future.
📘 How to Use
Add the indicator to your chart
Set your trading session (e.g., 09:30–16:00 EST)
Adjust weights depending on your style (Order Flow / Momentum / Value Area)
Watch the probability curve:
Above threshold → bullish bias
Below threshold → bearish bias
Take signals when the curve crosses thresholds, not when flat
Combine with "AI Probabilistic Orderflow scalper" indicator for execution timing
Avoid high-impact news using the News Filter
💎 Advantages
Professional-grade Bayesian model
Works in all volatility regimes
Noise-resistant and smoother than traditional oscillators
Integrates Order Flow + Auction Theory + Momentum + Volatility
Perfect for NQ scalpers seeking an AI-style probability dashboard
Reduces emotional decision-making
Compatible with any execution strategy
Optimized for high winrate scalping and sniper entries

Robrechtian Long-Medium Breakout Trend SystemRobrechtian Long–Medium-Term Breakout Trend System
A professional, rule-based trend-following strategy designed to capture large, sustained price movements using pure price action and breakouts.
This system follows long-established trend-following philosophy: no prediction, no volatility targeting, and no profit targets. Only disciplined entries, position additions, and exits driven entirely by trend structure.
Core Principles
Breakout-driven entries: Initial positions are taken only when price breaks above/below the 80-day Donchian channel, confirming a long–medium-term trend shift.
Short-term confirmation: Breakouts must also exceed the 20-day channel, reducing false positives.
Trend-direction filter: A 50-day moving average slope filter ensures alignment with the broader trend.
Explosive bar filter: Entries avoid excessively large, single-candle expansions (>2.5× ATR(20)) to prevent chasing exhaustion spikes.
Pyramiding into strength: Additional units are added only when price makes fresh 20-day breakouts in the direction of the trend. No scaling out. No adding on dips.
Exit only on trend violation: Positions are closed exclusively when price breaks the opposite 80-day channel. This preserves unlimited upside while enforcing disciplined exits.
Pure trend philosophy: No volatility targeting, no smoothing, no discretionary overrides, no optimization for short-term performance.
Intended Use
This system is designed primarily for diversified futures portfolios, where diversification across dozens of globally liquid markets creates robustness and stability. However, it may also be used on individual assets for educational and analytical purposes.
The system embraces the core trend-following logic:
Small losses, big winners, and unlimited upside when trends persist.
⚠️ WARNINGS / DISCLAIMERS
⚠️ Warning 1 — This strategy is not optimized for single stocks
The Robrechtian Trend System is designed for multi-asset futures portfolios, not single equities.
Performance on individual tickers may vary greatly due to lack of diversification.
⚠️ Warning 2 — Trend following includes substantial drawdowns
Deep drawdowns are a normal and expected feature of all long-term trend-following systems.
The strategy does not attempt to smooth returns or manage volatility.
If you seek steady, low-volatility equity curves, this system is not suitable.
⚠️ Warning 3 — No volatility targeting or risk smoothing
This system intentionally avoids volatility-based position sizing.
Trades may experience larger fluctuations than systems using risk parity or vol targeting.
⚠️ Warning 4 — Not financial advice
This script is for educational and research purposes only.
Past performance does not guarantee future results.
Use at your own risk.
⚠️ Warning 5 — TradingView backtests have known limitations
TradingView does not simulate:
futures contract roll logic
slippage
real bid/ask spreads
liquidity conditions
limit-up/limit-down behavior
Results may vary from live market execution.

ROC Bot AlertsA rules-based momentum scalping framework for short-term index futures
This indicator is designed for traders who focus on fast-moving, intraday momentum opportunities—particularly on lower timeframes such as the 1-minute chart. It uses a structured combination of trend filters and short-term momentum tools to help identify potential continuation entries during active market conditions.
Core Concept
The tool evaluates price behavior relative to a dynamic trend line while measuring short-term rate-of-change and directional strength. When all components align, the indicator highlights moments where the market may be transitioning into or sustaining momentum in one direction. Conversely, when conditions deteriorate or momentum weakens, the indicator suppresses signals to reduce noise and avoid choppy environments.
This approach aims to provide buy/sell signals for scalping in trending or expanding-volatility conditions.
What the Indicator Uses
The system assesses several factors before confirming a potential momentum signal:
A dynamic trend filter to determine directional bias
A rate-of-change threshold to confirm short-term acceleration
A trend-strength component to avoid signals during low-energy or ranging conditions
A cooldown mechanism to prevent rapid, back-to-back signals in unsettled areas
Only when all conditions align does the indicator paint a long or short trigger on the chart.
Intended Use
This tool is best suited for:
- Active scalpers
- Intraday index futures traders (NQ, ES, GC, etc.)
- Short-duration momentum traders
- Traders who prefer clean, rules-based decision making
It is not designed for swing trading, long-term trend following, or counter-trend strategies.
How to Read the Signals
- Buy markers appear when trend, momentum, and strength all support upward continuation.
- Sell markers appear when these same factors align in the opposite direction.
- The 90-period trend line can be shown or hidden based on user preference, but it remains part of the decision framework internally.
- The user may optionally adjust the momentum threshold (ROC%) to suit different volatility environments.
Important Notes
Signals are generated only on completed bars.
As with all technical tools, this should be used alongside proper risk and trade management practices.

FX COT (TT314)Part of FX Dashboard, based on @lord_fed document:
www.lordfed.co.uk
CFTC Commitment of Traders - large speculators view by default.

Futures Position Size Calculator (NQ/ES)DISCLAIMER:
This indicator is provided solely for informational and educational purposes. It calculates position sizing based on user-defined inputs such as entry and stop-loss levels, but it does not provide trading signals, recommendations, or financial advice . All trading decisions are made at the sole discretion of the user.
By using this indicator, you acknowledge that you are fully responsible for your own trades and risk management . The developer/publisher of this indicator assumes no liability for any losses, damages, or financial consequences that may arise from its use.
Features:
• Position size calculator (based on Entry & Stop Loss)
• Reward ratio calculator (1R, 2R, 3R, etc.)
• Supports: NQ / MNQ / ES / MES
Usage:
When you first add the script to your chart (on any supported futures symbol), you will be prompted to set the Entry Price and Stop Loss Price on the chart using draggable lines .
After setup, you can freely move the price lines, and the indicator will automatically update:
• Position size
• Reward targets
• Direction (long/short is auto-detected)
RISK Settings:
You can calculate position size using either:
1. Account Percent
Select "Percent" in the Risk Method dropdown and enter the percent of your account you want to risk per trade.
2. Fixed Dollar Amount
Select "Fixed Dollar" in the Risk Method dropdown and enter the dollar amount you want to risk.
You may set separate values for: NQ, MNQ, ES, and MES.
Reward Calculator:
Enable the checkbox "Show Reward Targets" in the Reward Ratio section to display projected targets (1R, 2R, etc.).
You can also choose how many R-levels are displayed on the chart.

Position Sizing Calculator (Real-Time) - Futures Edition█ SUMMARY
The following indicator is a Position Sizing Calculator based on Average True Range (ATR), originally developed by market technician J. Welles Wilder Jr., intended for real-time trading.
This script utilizes the user's account size, acceptable risk percentage, and a stop-loss distance based on ATR to dynamically calculate the appropriate position size for each trade in real time.
█ BACKGROUND
Developed for use on the Micro E-mini Nasdaq-100 futures (MNQ), this script provides traders with continuously updated dynamic position sizes. It enables traders to instantly determine the exact number of contracts to use when entering a trade while staying within their acceptable risk tolerance.
This real-time position sizing tool helps traders make well-informed decisions when planning trade entries and calculating maximum stop-loss levels, ultimately enhancing risk management.
█ USER INPUTS
Trading Account Size: Total dollar value of the user's trading account.
Acceptable Risk (%): Maximum percentage of the trading account that the user is willing to risk per trade.
ATR Multiplier for Stop-Loss: Multiplier used to determine the distance of the stop-loss from the current price, based on the ATR value.
ATR Length: The length of the lookback period used to calculate the ATR value.
Show Target Risk Row: Toggle to hide/show the Target Risk Row
SL Levels Display: Option to see Both, Long Only, Short Only, or None of the Stop Loss Level Values.
Contract Point Value ($): Point value per contract. Tooltip highlights common values.
Tick Size: Minimum Price Movement (Default set to 0.25)
Minimum Contracts: Override the Minimum Contracts per trade to a user selected value.
(May Exceed User's Target Risk)

Auto Position CalculatorA position sizing tool that automatically detects the instrument you're trading and calculates the correct position size based on your risk parameters.
What It Does
This indicator calculates how many contracts, lots, or shares to trade based on your account size, risk percentage, and stop loss distance. It auto-detects the instrument type and adjusts the point/pip value accordingly.
Supported Instruments
Futures: NQ, MNQ, ES, MES, YM, MYM, RTY, M2K, CL, MCL, GC, MGC
Forex: All major pairs (USD, EUR, GBP, JPY, etc.)
Index CFDs: NAS100, US500, US30, GER40, UK100
Metals: XAU, XAG
Crypto and Stocks: Automatic detection
How to Use
Set your account size and risk % in settings
Click the settings icon and place Entry, Stop Loss, and Take Profit on the chart
The position size and risk calculations appear automatically
Levels auto-reset at your chosen session (Asia, London, or New York open)
Limitations
CFD and forex pip values assume standard lot sizing - your broker may differ
Auto-detection relies on ticker naming conventions, which vary by broker/data feed
Session reset times are based on ET (Eastern Time)

Custom Daily Close Line Ver2Plots a line for the Daily closing price for Futures intraday charts.
Default closing price is 16:15 Eastern time.
Plot Line can be customized for different times based on the market.

Futures Custom Daily Close Line Plots closing price at 4:15pm ET for futures on an intraday chart.
Closing price can be adjusted to any time you want.

GT3_Trades Sessions Highs & LowsThis indicator automatically identifies and displays the session highs and lows for the three major global market sessions: Asia, London, and New York. It is designed for intraday traders who rely on session-based structure, liquidity levels, and volatility windows. The script dynamically tracks and plots the highest and lowest price reached during each session and extends these levels forward on the chart for strong visual clarity.
Key Features
Session-Based Highs & Lows
Calculates and updates the high and low for each session (Asia, London, New York) in real time as price develops within the session window.
Fully Customizable Display Options
Traders can individually toggle the visibility of each session’s high and low levels.
Line colors, styles (Solid, Dashed, Dotted), and thickness are also user-configurable.
Accurate Timezone Handling
Session times are defined using user-selected timezone settings (default UTC+3), ensuring session boundaries match the trader’s desired market timing.
Automatic Daily Reset
At the start of each new trading day, the indicator clears the previous levels and begins tracking fresh highs and lows for the new day.
Dynamic Line Drawing
Each level is plotted using real Pine Script line objects, which update automatically as new highs or lows form. Once created, each line extends forward to the right—providing clear, persistent references for potential liquidity zones, breakouts, and reversions.
Efficient Tracking Logic
The script keeps track of the bar index where each high/low occurs and updates the line endpoints in real time. Historical levels are not reused, ensuring clean, uncluttered visuals.
How It Helps Traders
Identifies liquidity pools and sweep areas based on session extremes.
Highlights intraday structure shifts when price breaks or respects session highs/lows.
Provides a clear overview of volatility cycles across the global trading day.
Helps detect potential reversal or continuation setups when interacting with session boundaries.
Ideal For
Intraday and scalping strategies
ICT-based session analysis
Liquidity, sweep, and FVG traders
Forex, indices, crypto, and commodities

WASDE Dates V2WASDE Dates V2 – USDA Release Calendar with Alerts, Countdown & Event Markers
By cot-trader.com
WASDE Dates V2 is a complete and reliable visualization tool for all scheduled WASDE (World Agricultural Supply and Demand Estimates) releases for 2025 and 2026.
The USDA’s WASDE report is one of the most market-moving fundamental catalysts in agricultural futures—affecting Corn (ZC), Wheat (ZW), Soybeans (ZS), Soymeal (ZM), Soybean Oil (ZL), and many related CFD products.
This script gives traders a precise timing layer directly inside their TradingView charts.
🔍 What this script does
WASDE Dates V2 automatically:
Marks each WASDE release day with a vertical line and label.
Shows an automated countdown to the next WASDE release:
In days (>24h)
In hours & minutes (<24h)
Displays an optional table of upcoming WASDE dates for quick reference.
Provides two alert conditions:
WASDE Day Alert – triggers exactly on the event
WASDE 24h Reminder – pre-alert when less than 24 hours remain
Handles both 2025 and 2026 confirmed dates.
Works on any symbol and timeframe.
📌 Why WASDE matters
The WASDE report updates global supply and demand estimates for:
Corn
Soybeans
Wheat
Other major agricultural commodities
Changes in yield, acres, production, imports/exports, and ending stocks can cause immediate and significant volatility.
Many traders combine WASDE awareness with seasonality, COT positioning, volatility filters, or fundamental models.
This script ensures you never miss the timing of these key releases.
⚙️ How the script works
The script stores official USDA WASDE release dates for 2025 and 2026 in two dedicated arrays.
On every bar, it compares the bar’s timestamp with known WASDE timestamps to detect an event day.
When an event occurs:
A red “WASDE” label is plotted above the candle
A dotted vertical line is drawn through the bar
It finds the next upcoming WASDE by scanning forward through both arrays.
A live-updating countdown label is displayed, showing days or hours/minutes until release.
If the event is less than 24 hours away:
A yellow “WASDE soon” warning appears near price
The 24h alert condition becomes active
An optional table lists upcoming events for 2025 & 2026.
This script does not generate trading signals.
It provides a time-based event layer designed to complement any discretionary or algorithmic trading approach.
🧭 How to use
Add the script to your chart.
Enable alerts for:
“WASDE Day Alert”
“WASDE 24h Reminder”
Follow the countdown to prepare for upcoming volatility.
Use together with other agricultural tools such as:
Seasonality indicators
COT (Commitment of Traders) analysis
Trend / VWAP / Volume signals
Pre- and post-WASDE trading strategies
Works on all chart types, all symbols, and all timeframes.
📅 Included WASDE Dates (Confirmed)
2025:
Jan 12, Feb 11, Mar 11, Apr 10, May 12, Jun 12, Jul 11, Aug 12, Sep 12, Oct 9, Nov 10, Dec 9
2026:
Jan 12, Feb 10, Mar 10, Apr 9, May 12, Jun 11, Jul 10, Aug 12, Sep 11, Oct 9, Nov 10, Dec 10
(All dates based on USDA’s official 12:00pm ET schedule.)
💡 What makes this script original
Fully updated 2025 + 2026 calendar
Uses a robust time-comparison method for accurate marking
Unique dual alert system (event + 24h pre-alert)
Clean, readable layout with countdown + upcoming dates table
Tailored specifically for grain & agricultural traders
Built entirely in Pine Script v6 with careful attention to performance

Spot-Futures SpreadSpot-Futures Spread Indicator
A comprehensive indicator that automatically calculates and visualizes the percentage spread between spot and perpetual futures prices across multiple exchanges.
Key Features:
Automatic Exchange Detection - Automatically detects your current exchange and finds the corresponding spot/futures pair
Smart Fallback System - If the counterpart isn't available on your exchange, it automatically searches across 7+ major exchanges (Binance, Bybit, OKX, Gate.io, MEXC, KuCoin, HTX) and uses the first valid match
Multi-Exchange Support - Works with 14 exchanges including Binance, Bybit, OKX, MEXC, BitGet, Gate.io, KuCoin, and more
Clear Exchange Attribution - Shows exactly which exchanges are providing spot and futures data in the statistics table
Configurable Moving Average - Track the average spread with customizable period
Standard Deviation Bands - Identify unusual spread conditions with Bollinger-style bands
Built-in Alerts - Get notified when spread crosses bands or zero (parity)
Statistics Table - Real-time stats showing current spread, MA, std dev, and bands
Manual Override Options - Advanced users can manually specify exchanges and symbols
How It Works:
The indicator calculates the spread as: (Futures Price - Spot Price) / Spot Price × 100
Positive spread = Futures trading at a premium (contango)
Negative spread = Futures trading at a discount (backwardation)
Zero = Parity between spot and futures
Use Cases:
Funding Rate Analysis - Correlates with perpetual funding rates
Arbitrage Opportunities - Identify significant spot-futures divergences
Market Sentiment - Premium/discount indicates bullish/bearish positioning
Cross-Exchange Analysis - Compare spreads when spot and futures are on different exchanges
Smart Features:
Works whether you're viewing a spot or futures chart
Automatically handles exchange-specific perpetual contract naming (.P, PERP, SWAP, etc.)
Color-coded visualization (green for premium, red for discount)
Customizable colors and display options
Background shading based on spread direction
Perfect For:
Crypto traders monitoring funding rates, arbitrage traders, market makers, and anyone interested in spot-futures dynamics across multiple exchanges.
Getting Started:
Simply add the indicator to any spot or perpetual futures chart. It will automatically detect the exchange and find the corresponding pair. The statistics table shows which exchanges are being used for maximum transparency.
Note: The indicator automatically ignores invalid symbols, so you'll never see errors even if a specific pair doesn't exist on a particular exchange.
Kudos to @AlekMel that made the "Spot - Fut Spread v2" indicator that I enhance the Automatic detection feature which was not working in some case.

Liquidity Hunt Detector PDH/PDL [SmartFoxy]Liquidity Hunt Detector PDH/PDL
The Liquidity Hunt Detector (LHD) is designed to identify and anticipate liquidity grabs around the:
• Previous Day High (PDH);
• Previous Day Low (PDL).
It builds dynamic trigger levels that highlight where price may deliver its first impulse before reaching PDH/PDL.
The Liquidity Hunt Detector (LHD) identifies high-probability reversals and continuations around the Previous Day High (PDH) and Previous Day Low (PDL).
It dynamically tracks the market’s move from the session open, builds trigger levels toward PDH/PDL, and highlights where liquidity is most likely to be taken.
When price taps a Trigger Up/Down level, the indicator generates Long/Short signals with optional confirmation from the integrated MA Ribbon , ensuring only high-quality, trend-aligned setups are shown.
When price interacts with these trigger levels, the indicator generates signals that help traders evaluate the market structure and prepare for potential entries.
Designed for Forex, Crypto, Indices, Stocks , the LHD provides a clean and intuitive structure for navigating intraday liquidity grabs, session impulses, and directional bias shifts.
The indicator is built from three fully independent modules, each of which can be used separately:
Liquidity Hunt Detector (LHD)
Moving Average Ribbon (MA Ribbon)
Previous Day High/Low (PDH/PDL) levels
Liquidity Hunt Detector (LHD) Logic
1.1 Display LHD – Enables or disables the entire Liquidity Hunt Detector module.
1.2 Max Days – Number of previous days used to generate PDH/PDL levels.
1.3 GMT – Corrects all time-based calculations based on your broker/session timezone.
1.4 Calculation Method (Point A Logic)
1) Static Method
Point A = the session’s opening price.
Trigger lines are calculated strictly as a percentage of the move A → PDH or A → PDL.
Intraday fluctuations do not affect the calculation.
2) Dynamic Method
Point A updates using the current intraday high/low:
• If price forms a new low, Point A updates for the PDH-side calculations;
• If price forms a new high, Point A updates for the PDL-side calculations.
This produces trigger lines that reflect the true live market structure rather than a fixed opening reference.
1.5 Main OTT Time (Operational Trading Time)
This is the core time window during which the indicator:
• updates Point A;
• calculates trigger levels;
• validates PDH/PDL;
• draws AB / AC movement structure;
• generates entry signals.
Outside this window, no new signals or recalculations occur.
⚠ If your broker’s first candle opens at a non-standard time (e.g., 00:08), adjust the OTT start time to avoid visual artifacts.
1.6 Show Line A – Displays the opening price level (Point A) until the end of the OTT window.
Style, width, and color are customizable.
1.7 Show Line AB — Price Movement Toward PDH.
Static Method – Single line: A → PDH
Dynamic Method – Two segments:
• A → Daily Low;
• Daily Low → PDH.
If PDH is swept, the “B” label switches to Sweep PDH.
1.8 Show Line AC – Price Movement Toward PDL.
Static Method – Single line: A → PDL
Dynamic Method – Two segments:
• A → Daily High;
• Daily High → PDL.
If PDL is swept, the “C” label switches to Sweep PDL.
1.9 Show Trigger Up Line (LONG Trigger) – Defines the level where the Long signal can activate.
By default, at 50% of the A → PDH movement.
When price touches this line, the script may:
• show a LONG label;
• trigger an alert.
All visual parameters are customizable.
1.10 Show Trigger Up Line (LONG Trigger)
Same logic as Trigger Up, but based on A → PDL.
1.11 Show Main Zone (OTT Zone) – Visual background highlighting of the active OTT window.
Helps instantly see:
• whether signals are allowed;
• how much time remains in the trading window?
Color and opacity are adjustable.
1.12 Upper Zone (toward PDH) – Tracks the protected area towards PDH.
Updates dynamically with new highs.
1.13 Lower Zone (toward PDL) – Tracks the zone toward PDL.
Updates dynamically with new lows.
1.14 Show Labels – Displays reference labels (A, B, C, Trigger Up, Trigger Down).
Label size is customizable.
1.15 Add Price – Adds the exact price value to each label.
1.16 Change Color after Sweep PDH or PDL – After PDH or PDL is broken, the indicator automatically recolors lines and labels to visually confirm the sweep.
1.17 Show SHORT Label – Displays the SHORT entry label when all conditions for a bearish signal are met.
Style parameters are set in the previous blocks.
1.18 Alert on Bearish Trigger Down – Triggers an alert when the price activates the bearish trigger.
1.19 Show LONG Label – Displays the LONG entry label when bullish conditions are met.
Style parameters are set in the previous blocks.
1.20 Alert on Bullish Trigger Up – Triggers an alert when the price activates the bullish trigger.
1.21 Alerts Active Time – Defines a custom time interval during which trigger signals are allowed.
Even if price touches a trigger level,
❗ signals will NOT be generated outside this allowed time.
Useful for:
• avoiding Asian session signals;
• reducing noise in low-liquidity periods.
1.22 Labels and Alerts Display Mode
Two settings modes:
• On Trigger (Instant Mode) – Signals appear immediately when price touches the trigger.
• On Candle Close (Conservative Mode) – Signals form only after the candle closes beyond the trigger level.
A more conservative option.
1.23 Delay LHD Signal Until MA Ribbon Confirms Direction – If enabled, LHD signals will NOT fire until the MA Ribbon produces a matching directional signal.
Logic:
• Price hits the trigger → LHD conditions become “armed”;
• The indicator waits;
• When MA Ribbon confirms trend direction (Long/Short);
• The final LHD label + alert is generated.
This ensures LHD trades are filtered and aligned with MA-based trend confirmation.
⚠ Works only when the MA Ribbon module is active.

Qullamagi EMA Breakout Autotrade (Crypto Futures L+S)Title: Qullamagi EMA Breakout – Crypto Autotrade
Overview
A crypto-focused, Qullamagi-style EMA breakout strategy built for autotrading on futures and perpetual swaps.
It combines a 5-MA trend stack (EMA 10/20, SMA 50/100/200), volatility contraction boxes, volume spikes and an optional higher-timeframe 200-MA filter. The script supports both long and short trades, partial take profit, trailing MA exits and percent-of-equity position sizing for automated crypto futures trading.
Key Features (Crypto)
Qullamagi MA Breakout Engine – trades only when price is aligned with a strong EMA/SMA trend and breaks out of a tight consolidation range. Longs use: Close > EMA10 > EMA20 > SMA50 > SMA100 > SMA200. Shorts are the mirror condition with all MAs sloping in the trend direction.
Strict vs Loose Modes – Strict (Daily) is designed for cleaner swing trades on 1H–4H (full MA stack, box+ATR and volume filters, optional HTF filter). Loose (Intraday) focuses on 10/20/50 alignment with relaxed filters for more frequent 15m–30m signals.
Volatility & Volume Filters for Crypto – ATR-based box height limit to detect volatility contraction, wide-candle filter to avoid chasing exhausted breakouts, and a volume spike condition requiring current volume to exceed an SMA of volume.
Higher-Timeframe Trend Filter (Optional) – uses a 200-period SMA on a higher timeframe (default: 1D). Longs only when HTF close is above the HTF 200-SMA, shorts only when it is below, helping avoid trading against dominant crypto trends.
Autotrade-Oriented Trade Management – position size as % of equity, initial stop anchored to a chosen MA (EMA10 / EMA20 / SMA50) with optional buffer, partial take profit at a configurable R-multiple, trailing MA exit for the remainder, and an optional cooldown after a full exit.
Markets & Timeframes
Best suited for BTC, ETH and major altcoin futures/perpetuals (Binance, Bybit, OKX, etc.).
Strict preset: 1H–4H charts for classic Qullamagi-style trend structure and fewer fake breakouts.
Loose preset: 15m–30m charts for higher trade frequency and more active intraday trading.
Always retune ATR length, box length, volume multiplier and position size for each symbol and exchange.
Strategy Logic (Quick Summary)
Long (Strict): MA stack in bullish alignment with all MAs sloping up → tight volatility box (ATR-based) → volume spike above SMA(volume) × multiplier → breakout above box high (close or intrabar) → optional HTF close above 200-SMA.
Short: Mirror logic: bearish MA stack, tight box, volume spike and breakdown below box low with optional HTF downtrend.
Best Practices for Crypto
Backtest on each symbol and timeframe you plan to autotrade, including commissions and slippage.
Start on higher timeframes (1H/4H) to learn the behavior, then move to 15m–30m if you want more signals.
Use the higher-timeframe filter when markets are strongly trending to reduce counter-trend trades.
Keep position-size percentage conservative until you fully understand the drawdowns.
Forward-test / paper trade before connecting to live futures accounts.
Webhook / Autotrade Integration
Designed to work with TradingView webhooks and external crypto trading bots.
Alert messages include structured fields such as: EVENT=ENTRY / SCALE_OUT / EXIT, SIDE=LONG / SHORT, STRATEGY=Qullamagi_MA.
Map each EVENT + SIDE combination to your bot logic (open long/short, partial close, full close, etc.) on your preferred exchange.
Important Notes & Disclaimer
Crypto markets are highly volatile and can change regime quickly. Backtest and forward-test thoroughly before using real capital. Higher timeframes generally produce cleaner MA structures and fewer fake breakouts.
This strategy is for educational and informational purposes only and does not constitute financial advice. Trading leveraged crypto products involves substantial risk of loss. Always do your own research, manage risk carefully, and never trade with money you cannot afford to lose.

XenoSmooth Predictive Candles - Advanced Heikin Ashi CandlesXenoSmooth Predictive Candles
Summary in one paragraph
A synthetic candle engine for crypto, FX, equities, and futures on intraday to swing timeframes. It reduces noise and flip delay so structure is easier to read. The core novelty is a predictive open with inertia plus slope lead fused with a zero lag body filter and an overshoot based wick model normalized by the real range and capped by ATR. Add it to a clean chart, hide regular candles if desired, and tune lengths. Shapes can move while the bar is open and settle on close. For conservative workflows read on bar close.
Scope and intent
• Markets. Major FX pairs, index futures, large cap equities, liquid crypto
• Timeframes. One minute to daily
• Purpose. Faster and smoother visual structure than Heikin Ashi while keeping causality and realistic wicks
Originality and usefulness
• Unique concept. Predictive open with inertia and slope lead plus selectable zero lag body filter and ATR capped wick overshoot in percent of real range
• Failure mode addressed. Late flips in chop and unreal long wicks from raw extremes
• Testability. Every control is an input. Users can toggle body method, lengths, clipping, and percent modeling
• Portable yardstick. ATR based wick cap and percent of bar range scale across symbols
Method overview in plain language
Build a robust base price from O, H, L, and extra weight on Close. Smooth it with a chosen filter to produce the synthetic close. Drive a predictive open that follows the synthetic close with tunable inertia and a small lead from the last bar slope. Model wicks as the portion of the real extremes that extends beyond the synthetic body, smooth that overshoot, normalize by the bar range if selected, then cap by ATR to avoid tail spikes. Clamp synthetic values to the real high and low if enabled.
Base measures
• Range basis. True Range for the ATR cap and High minus Low for percent normalization
• Return basis. Not used
Components
• Body Base Blend. Weighted O H L with a close bias to stabilize the base
• Zero Lag Body Filter. ZLEMA or Super Smoother or WMA to set the synthetic close
• Predictive Open. Inertial follow of the synthetic close plus a slope lead term
• Wick Overshoot Model. Smoothed extension beyond the body, optional percent of real range, ATR cap
• Clamp Option. Keeps synthetic open and close inside the real bar range
Fusion rule
• Synthetic close equals filtered base
• Synthetic open equals previous open plus inertia times distance to synthetic close plus slope lead
• Wicks equal smoothed overshoot above and below the body, optionally percent of range then converted back to price and capped by ATR
Inputs with guidance
Setup
• Signal timeframe. Uses the chart timeframe
• Invert direction. Not applicable
• Session windows. Not applicable
Logic
• Body length. Core smoothing length for the synthetic close. Typical 6 to 14. Higher gives smoother and slower. Lower gives faster flips
• Body method. ZLEMA or Super Smoother or WMA. ZLEMA is fastest. Super Smoother is calmest
• Close weight in base. 0 to 1. Higher gives stronger emphasis on close and less noise
• Open inertia. 0 to 1. Higher makes the open follow the close more tightly
• Lead gain. 0 to 1. Higher adds more phase lead. Keep modest to avoid overshoot
• Clamp body to real range. On keeps synthetic body inside high and low
• Wick smooth length. Typical 4 to 10. Higher reduces jitter
• Overshoot as percent. On stabilizes wicks across regimes
• ATR length. Typical 10 to 20 for the cap
• Max wick equals ATR times. 0 disables. 1.0 to 2.0 contains extreme tails
Filters
• Efficiency or trend filter. Not used
• Micro versus macro range relation. Not used
• Location filter. Not used
Realism and responsible publication
• No performance claims
• Intrabar motion reminder. Shapes can move while a bar forms and settle on close
• Strategies must use standard candles for signals and orders
Honest limitations and failure modes
• High impact releases and thin liquidity can distort wicks and produce gaps that any smoother cannot predict
• Very quiet regimes can reduce contrast. Consider longer body length
• Session time on the chart controls the definition of each bar

Contango/Backwardation Monitor
This is an indicator to display the spread difference between two products. I designed it around VX1! and VX2! but any other two products can be chosen. It is a simple subtraction of VX2-VX1. I will go through the options first and what they do followed by what contango/backwardation is in my own words. You will need the data package for VX futures for the default version to work.
INPUTS
-Apply Smoothing: choose to apply smoothing or not.
-Smoothing Method: choose between SMA,EMA,WMA, etc.
-Line Width: Width of line if line is chosen style(can be changed in style section)
-Threshold 1-5: This is the level at which the line will change colors(defaults are for VX)
-Color 1-5: The color the line will change to when crossing threshold.
Towards Backwardation: Background color change when line is slanted down
Towards Contango: Background color change when line is slanted up
Bars to Confirm Trend: This is my method to cut down on background color changes. It is how many bars consecutive going back needed to change color.
STYLE
-All colors and whatnot can be changed here(threshold colors can be changed here or on the input page).
T1 Line-T5 line: These are simple horizontal lines that can be used to denote threshold areas or whatever you want.
Contango/Backwardation-These terms are used mostly with futures to define the calendar spread between two contracts. Contango is when that spread is is getting longer and backwardation is when that spread is closing. In terms of VIX futures, Contango would imply that volatility is stabilizing and the S and P will likely gain. Backwardation, woudl eb the opposite.
The most simple way to read this indicator with default settings- If the line is up, red, and the background is red, then you can assume S and P prices are going down. And if the opposite is true, then prices are likely going up.
Please feel free to ask any questions and I will do my best to answer them.

EMA Cross + RSI + ADX - Autotrade Strategy V2Overview
A versatile trend-following strategy combining EMA 9/21 crossovers with RSI momentum filtering and optional ADX trend strength confirmation. Designed for both cryptocurrency and traditional futures/options markets with built-in stop loss management and automated position reversals.
Key Features
Multi-Market Compatibility: Works on both crypto futures (Bitcoin, Ethereum) and traditional markets (NIFTY, Bank NIFTY, S&P 500 futures, equity options)
Triple Confirmation System: EMA crossover + RSI filter + ADX strength (optional)
Automated Risk Management: 2% stop loss with wick-touch detection
Position Auto-Reversal: Opposite signals automatically close and reverse positions
Webhook Ready: Six distinct alert messages for automation (Entry Buy/Sell, Close Long/Short, SL Hit Long/Short)
Performance Metrics
NIFTY Futures (15min): 50%+ win rate with ADX filter OFF
Crypto Markets: Requires extensive backtesting before live deployment
Optimal Timeframes: 15-minute to 1-hour charts (patience required for higher timeframes)
Strategy Logic
Entry Signals:
LONG: EMA 9 crosses above EMA 21 + RSI > 55 + ADX > 20 (if enabled)
SHORT: EMA 9 crosses below EMA 21 + RSI < 45 + ADX > 20 (if enabled)
Exit Signals:
Opposite EMA crossover (auto-closes current position)
Stop loss hit at 2% from entry price (tracks candle wicks)
Technical Indicators:
Fast EMA: 9-period (short-term trend)
Slow EMA: 21-period (primary trend)
RSI: 14-period with 55/45 thresholds (momentum confirmation)
ADX: 14-period with 20 threshold (trend strength filter - optional)
Market-Specific Settings
Traditional Markets (NIFTY, Bank NIFTY, S&P Futures, Options)
Recommended Settings:
ADX Filter: Turn OFF (less choppy, cleaner trends)
Timeframe: 15-minute chart
Win Rate: 50%+ on NIFTY Futures
Why No ADX: Traditional markets have more institutional participation and smoother price action, making ADX unnecessary
Cryptocurrency Markets (BTC, ETH, Altcoins)
Recommended Settings:
ADX Filter: Turn ON (ADX > 20)
Timeframe: 15-minute to 1-hour
Extensive backtesting required before live trading
Why ADX: Crypto markets are highly volatile and prone to false breakouts; ADX filters low-quality chop
Best Practices
✅ Backtest thoroughly on your specific instrument and timeframe
✅ Use larger timeframes (1H, 4H) for higher quality signals and better risk/reward
✅ Adjust RSI thresholds based on market volatility (try 52/48 for more signals, 60/40 for fewer but stronger)
✅ Monitor ADX effectiveness - disable for traditional markets, enable for crypto
✅ Proper position sizing - adjust default_qty_value based on your capital and instrument price
✅ Paper trade first - test for 2-4 weeks before risking real capital
Risk Management
Fixed 2% stop loss per trade (adjustable)
Stop loss tracks candle wicks for accurate execution
Positions auto-reverse on opposite signals (no manual intervention needed)
0.075% commission built into backtest (adjust for your broker)
Customization Options
All parameters are adjustable via inputs:
EMA periods (default: 9/21)
RSI length and thresholds (default: 14-period, 55/45 levels)
ADX length and threshold (default: 14-period, 20 threshold)
Stop loss percentage (default: 2%)
Webhook Automation
This strategy includes six distinct alert messages for automated trading:
"Entry Buy" - Long position opened
"Entry Sell" - Short position opened
"Close Long" - Long position closed on opposite crossover
"Close Short" - Short position closed on opposite crossover
"SL Hit Long" - Long stop loss triggered
"SL Hit Short" - Short stop loss triggered
Compatible with Delta Exchange, Binance Futures, 3Commas, Alertatron, and other webhook platforms.
Important Notes
⚠️ Crypto markets require extensive backtesting - volatility patterns differ significantly from traditional markets
⚠️ Higher timeframes = better results - 15min works but 1H/4H provide cleaner signals
⚠️ ADX toggle is critical - OFF for traditional markets, ON for crypto
⚠️ Not financial advice - always conduct your own research and use proper risk management
⚠️ Past performance ≠ future results - backtest results may not reflect live trading conditions
Disclaimer
This strategy is for educational and informational purposes only. Trading futures and options involves substantial risk of loss. Always backtest thoroughly, start with paper trading, and never risk more than you can afford to lose. The author assumes no responsibility for any trading losses incurred using this strategy.

AlgoIndexOS-ES-FuturesAlgoIndexOS — ES Futures Strategy v2.0 (5-Minute RTH)
Scope (read first)
ES on 5-minute only, RTH session. The strategy operates on U.S. Regular Trading Hours (09:30–16:00 ET) using a 5-minute ES chart. It builds an Opening Session Range (OSR) from the RTH open, then runs a breakout engine when internal quality conditions are met. Exits are target-based with an intrabar touch-to-flat safety. Positions are flattened at the RTH session end by default. Alerts can post JSON to your Webhook URL for automation.
What this is
One intraday engine with four curated presets (“Stages”) tuned for distinct segments of the NY session. Stages keep the core logic consistent while applying time-of-day context and conservative governors. Single invite-only listing; not a multi-post suite.
How it trades (high-level)
Range context: Builds and locks the OSR from the opening bell; entries only arm after the range is set.
Quality gating: Trades only when internal trend/volatility/confirmation conditions align (no parameter disclosure).
Breakout execution: Signals at bar close; bracket exits manage take-profit (limit) with an intrabar “TP-touch” safety to avoid phantom fills; optional stop-loss.
Session safety: Positions flat at RTH close by default (time exit).
(No settings or thresholds are disclosed; presets encapsulate research choices.)
Stages (session templates; one engine)
A single Stage selector chooses among four presets optimized for different parts of the RTH session (morning vs mid-day; long/short focus). Internal parameters remain fixed to preserve tested behavior.
Public inputs (kept minimal)
Stage (choose your preset)
TP / SL (points) shown for transparency; effective values are governed by the selected preset to maintain consistency with research.
Optional display overlays (status line/markers) for readability.
Alerts (how to use)
Create an alert on the strategy and choose Strategy → Order fills. Use a webhook if you want automation. The payload includes the exact chart symbol so it works on ES1! or a specific ES contract:
{
"tv_symbol": "{{ticker}}",
"tv_exchange": "{{exchange}}",
"action": "buy|sell|exit",
"price": {{close}},
"time": "{{timenow}}"
}
If your receiver needs a fixed root (e.g., “ES”), map it on your server using tv_symbol for context.
Backtest & assumptions
Backtest assumptions (initial capital, commission, slippage, margin) are user-configurable in TradingView. Results on your chart reflect your settings. This script evaluates ES fills on 5-minute RTH bars; live execution will differ.
Operating notes
Use on ES only, 5-minute timeframe, RTH session.
If you run multiple Stages, use separate charts/tabs and coordinate net exposure in your own tooling if needed.
Publish with a clean chart for clarity.
Disclosures (compliance)
No investment advice. This script is for research/education and tooling only. It does not provide investment, legal, tax, or accounting advice and does not recommend any security, instrument, or strategy. Use at your own risk.
Hypothetical performance (CFTC 4.41). Hypothetical or simulated results have many limitations, and no representation is made that any account will achieve similar outcomes. Past performance is not necessarily indicative of future results.
Futures risk. Trading futures involves substantial risk of loss and is not suitable for all investors. Leverage, gaps, slippage, and connectivity can cause losses exceeding initial investment.
Backtesting limitations. Results depend on data quality, chart resolution, session filters, and user assumptions; live execution will differ.
Intellectual property. © 2025 AlgoIndex. All Rights Reserved. Redistribution, resale, or decompilation prohibited without written consent.
