ATR RopeATR Rope is inspired by DonovanWall's "Range Filter". It implements a similar concept of filtering out smaller market movements and adjusting only for larger moves. In addition, this indicator goes one step deeper by producing actionable zones to determine market state. (Trend vs. Consolidation)
> Background
When reading up on the Range Filter indicator, it reminded me exactly of a Rope stabilization drawing tool in a program I use frequently. Rope stabilization essentially attaches a fixed length "rope" to your cursor and an anchor point (Brush). As you move your cursor, you are pulling the brush behind it. The cursor (of course) will not pull the brush until the rope is fully extended, this behavior filters out jittery movements and is used to produce smoother drawing curves.
If compared visually side-by-side, you will notice that this indicator bears striking resemblance to its inspiration.
> Goal
Other than simply distinguishing price movements between meaningful and noise, this indicator strives to create a rigid structure to frame market movements and lack-there-of, such as when to anticipate trend, and when to suspect consolidation.
Since the indicator works based on an ATR range, the resulting ATR Channel does well to get reactions from price at its extremes. Naturally, when consolidating, price will remain within the channel, neither pushing the channel significantly up or down. Likewise, when trending, price will continue to push the channel in a single direction.
With the goal of keeping it quick and simple, this indicator does not do any smoothing of data feeds, and is simply based on the deviation of price from the central rope. Adjusting the rope when price extends past the threshold created by +/- ATR from the rope.
> Features & Behaviors
- ATR Rope
ATR Rope is displayed as a 3 color single line.
This can be considered the center line, or the directional line, whichever you'd prefer.
The main point of the Rope display is to indicate direction, however it also is factually the center of the current working range.
- ATR Rope Color
When the rope's value moves up, it changes to green (uptrend), when down, red (downtrend).
When the source crosses the rope, it turns blue (flat).
With these simple rules, we've formed a structure to view market movements.
- Consolidation Zones
Consolidation Zones generate from "Flat" areas, and extend into subsequent trend areas. Consolidation is simply areas where price has crossed the Rope and remains inside the range. Over these periods, the upper and lower values are accumulated and averaged together to form the "Consolidation Zone" values. These zones are draw live, so values are averaged as the flat areas progress and don't repaint, so all values seen historically are as they would appear live.
- ATR Channel
ATR Channel displays the upper and lower bounds of the working range.
When the source moves beyond this range, the rope is adjusted based on the distance from the source to the channel. This range can be extremely useful to view, but by default it is hidden.
> Application
This indicator is not created to provide signals, or serve as a "complete" system.
(People who didn't read this far will still comment for signals. :) )
This is created to be used alongside manual interpretation and intuition. This indicator is not meant to constrain any users into a box, and I would actually encourage an open mind and idea generation, as the application of this indicator can take various forms.
> Examples
As you would probably already know, price movement can be fast impulses, and movement can be slow bleeds. In the screenshot below, we are using movements from and to consolidation zones to classify weak trend and strong trend. As you can see, there are also areas of consolidation which get broken out of and confirmed for the larger moves.
Author's Note: In each of these examples, I have outlined the start and end of each session. These examples come from 1 Min Future charts, and have specifically been framed with day trading in mind.
"Breakout Retest" or "Support/Resistance Flips" or "Structure Retests" are all generally the same thing, with different traders referring to them by different names, all of which can be seen throughout these examples.
In the next example, we have a day which started with an early reversal leading into long, slow, trend. Notice how each area throughout the trend essentially moves slightly higher, then consolidates while holding support of the previous zone. This day had a few sharp movements, however there was a large amount of neutrality throughout this day with continuous higher lows.
In contrast to the previous example, next up, we have a very choppy day. Throughout which we see a significant amount of retests before fast directional movements. We also see a few examples of places where previous zones remained relevant into the future. While the zones only display into the resulting trend area, they do not become immediately meaningless once they stop drawing.
> Abstract
In the screenshot below, I have stacked 2 of these indicators, using the high as the source for one and the low as the source for the other. I've hidden lines of the high and low channels to create a 4 lined channel based on the wicks of price.
This is not necessary to use the indicator, but should help provide an idea of creative ways the simple indicator could be used to produce more complicated analysis.
If you've made it this far, I would hope it's clear to you how this indicator could provide value to your trading.
Thank you to DonovonWall for the inspiration.
Enjoy!
Function

Weierstrass Function (Fractal Cycles)THE WEIERSTRASS FUNCTION
f(x) = ∑(n=0)^∞ a^n * cos(b^n * π * x)
The Weierstrass Function is the sum of an infinite series of cosine functions, each with increasing frequency and decreasing amplitude. This creates powerful multi-scale oscillations within the range ⬍(-2;+2), resembling a system of self-repetitive patterns. You can zoom into any part of the output and observe similar proportions, mimicking the hidden order behind the irregularity and unpredictability of financial markets.
IT DOESN’T RELY ON ANY MARKET DATA, AS THE OUTPUT IS BASED PURELY ON A MATHEMATICAL FORMULA!
This script does not provide direct buy or sell signals and should be used as a tool for analyzing the market behavior through fractal geometry. The function is often used to model complex, chaotic systems, including natural phenomena and financial markets.
APPLICATIONS:
Timing Aspect: Identifies the phases of market cycles, helping to keep awareness of frequency of turning points
Price-Modeling features: The Amplitude, frequency, and scaling settings allow the indicator to simulate the trends and oscillations. Its nowhere-differentiable nature aligns with the market's inherent uncertainty. The fractured oscillations resemble sharp jumps, noise, and dips found in volatile markets.
SETTINGS
Amplitude Factor (a): Controls the size of each wave. A higher value makes the waves larger.
Frequency Factor (b): Determines how fast the waves oscillate. A higher value creates more frequent waves.
Ability to Invert the output: Just like any cosine function it starts its journey with a decline, which is not distinctive to the behavior of most assets. The default setting is in "inverted mode".
Scale Factor: Adjusts the speed at which the oscillations grow over time.
Number of Terms (n_terms): Increases the number of waves. More terms add complexity to the pattern.

Vector ScalerVector Scaler is like Stochastic but it uses a different method to scale the input. The method is very similar to vector normalization but instead of keeping the "vector" we just sum the three points and average them. The blue line is the signal line and the orange line is the smoothed signal line. I have added the "J" line from the KDJ indicator to help spot divergences. Differential mode uses the delta of the input for the calculations. Here are some pictures to help illustrate how this works relative to other popular indicators.
Vector Scaler vs Stochastic
Vector Scaler vs Smooth Stochastic RSI
average set to 100
average set to 200

Reverse Ehler Instantaneous Trendline - TraderHalaiThis script uses a reverse function of the famous Ehler Instantaneous Trendline to calculate the source price required in order to change from Bullish to bearish
From my analysis, the reverse price does appear to be rather choppy, though it is 100% accurate. This is because Ehler's Instantaneous Trendline tends to remain trending for longer periods of time with above average hold periods.
The main suitability for this would be higher level timeframes, such as Weekly, 5 daily, 3 daily. From my findings Smoothed Heikin Ashi Trend, tends to provide better risk-adjusted returns across most timeframes (Higher return to drawdown ratio)
As I have spent a bit of time getting the reverse function mathematics to work, I decided to publish this as open source for the benefit, scrutiny and for further development by the TradingView community anyways.
Enjoy!

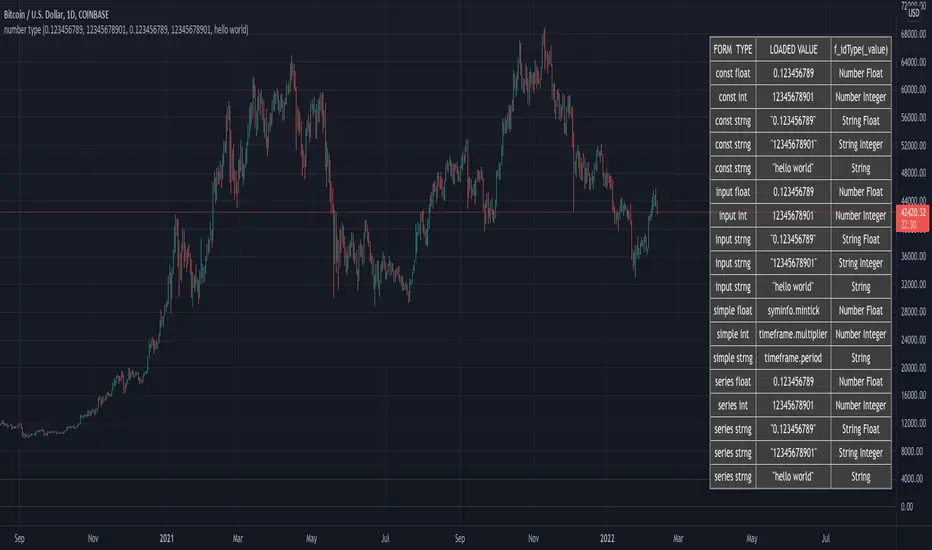
How To Identify Argument Type Of Number Using OverloadsExample overload functions accept loading of _value for types float, int, or string, then positively identifies the actual argument type of that specific loaded _value.

How To Identify Type Of NumberExample function accepts loading of _value for types float, int, or string, then identifies whether the loaded _value is a string number, string, or number.
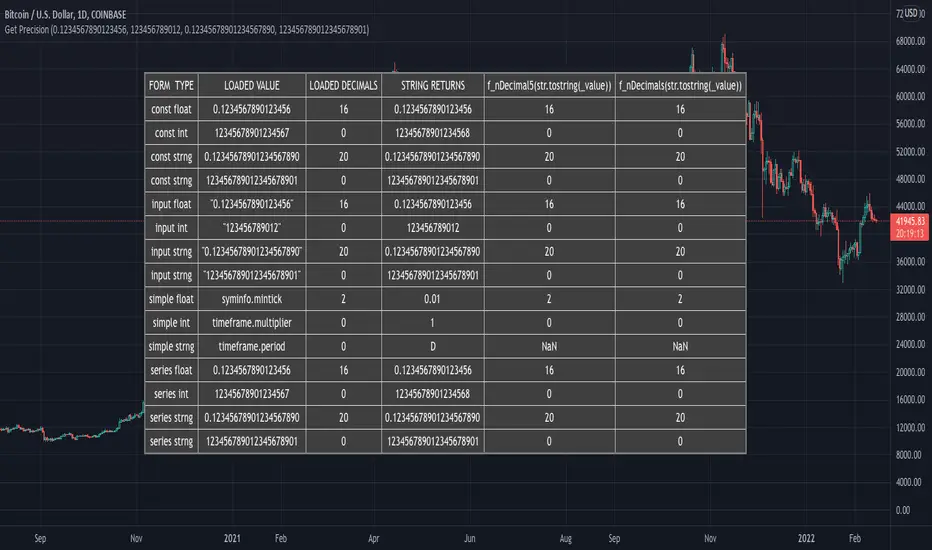
How To Count DecimalsCustom f_nDecimals() function returns precision of decimal numbers of the following forms:
const, input, simple, and series of the following types: float, integer, and string.
Error checking is performed for valid numbers and invalid values return NaN.
NOTICE: This is an example script and not meant to be used as an actual strategy. By using this script or any portion thereof, you acknowledge that you have read and understood that this is for research purposes only and I am not responsible for any financial losses you may incur by using this script!
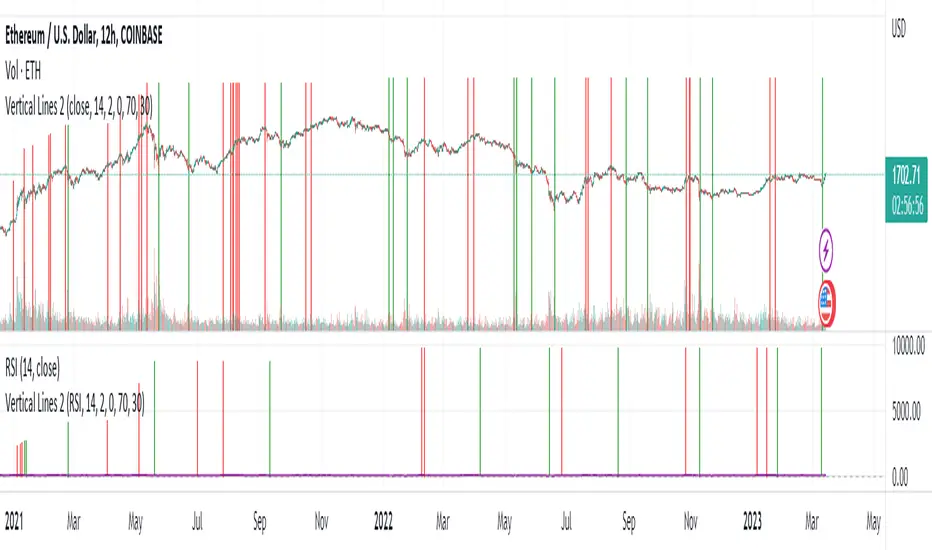
Vertical LinesThis script plots vertical lines on charts or indicators. Unfortunately pinescript is lacking a vertical line plotting function. Vertical lines are useful to mark events, such as crossover of levels, indicators signals or as a time marker.
After searching the internet for a long time and trying different scripts, this script is the simplest and visually the best. You would think that plotting a vertical line would be relatively easy, it is not! I thank the unknow author for sharing this solution and now I will share it on tradingview to make it readily available to anybody that needs it.
RSI crossover signals are used as an example in this script. When the RSI crosses over 70 or below 30, the script plots a red or green vertical line.
The script plots a vertical line as a histogram bar. The histogram bar must have a height.
Setting the height near infinity like 1e20 will cover all the ranges from top to bottom in most charts, but doesn't work all the time. If the chart range is small in values, the line is not plotted or the chart is visually compressed because the top of the bar is also a data point in the chart. Another solution is to find the highest point in the chart and multiply it by a number from 2 to 10 to set the top of the histogram bar. But this solution doesn't work if the line is drawn in the indicator window. additionally if the chart or indicator includes negative values, a histogram bar with a negative height must be concatenated to the histogram bar with a positive height to cover the positive and negative range.
It would seem intuitive to include a vertical plot function since it is very useful and pinescript already has a horizontal line plot function called Hline. But pinescript is becoming less intuitive, and redundant. A case in point is Version 4 variable declaration and naming, it less intuitive and more redundant than previous versions. I beg Tradingview to adopt a more refined scripting language such as Matlab or Python for charting purposes. These languages can be easily ported to other analysis programs for AI or statistical analysis.
[FN] Strategy - Store Level on ConditionThis is a function that you can use in strategies. Not a strategy in and of itself.
Example thumbnail is showing the function applied to a strategy.
Oftentimes, I am asked a question regarding how to hold a variable at a specific, constant level over a conditional period of time. This question is always asked in a very long convoluted way like "I want the strategy to know what the high of the last pivot was while I'm in a long." or some other variation of wanting a script to remember something from prior bars.
This function is designed to store a price or some numeric level on the bar that your conditional (bool) statements determine that it should be stored. In this construct, you would set conditional statement(s) to flip the 'hold condition' to be true on the next bar, then hold that value until either the "hold condition" is no longer true or the initial conditions trigger again, causing an update to the level that you want to capture.
You still have to come up with the logic for the start condition and hold condition on your own, but I've provided an example that should give you an idea of how to accomplish this and customize/deploy the function for your purposes.
The function will return 'na' when neither the start condition nor hold condition are true. There's multiple ways to implement this and variations on how the level is chosen. I've written extensive notes in the script to guide you through the logic behind the function. My hope is that it will be useful to those trying to build strategies or anyone attempting to get their script to remember a level under given conditions.
In the thumbnail example, the take profit level is defined at the beginning of the trade and held until the take profit order executes. The order execution is a separate matter. However, storing the take-profit level at a static value is key to telling the strategy.exit() function what price to execute a limit exit order at.
Example: strategy.exit("Exit Long", from_entry = "long", qty_percent = 100, limit = stored_value)
Let me know how it works out for you and if I can be of any assistance.
Note: Strategy results are mainly derived from the fact that the strategy is long-only, the NQ only goes up, and there is no stop loss in place. So don't ask for the specific strategy, because unless you're trading a single contract with a $500,000 account, you'll probably get liquidated using this strategy as it is presented.

Linear Regression & RSI Multi-Function Screener with Table-LabelHi fellow traders..
Happy to share a Linear Regression & RSI Multi-Function Custom Screener with Table-Labels...
The Screener scans for Linear Regression 2-SD Breakouts and RSI OB/OS levels for the coded tickers and gives Summary alerts
Uses Tables (dynamica resizing) for the scanner output instead of standard labels!
This Screener cum indicator collection has two distinct objectives..
1. Attempt re-entry into trending trades.
2. Attempt Counter trend trades using linear regression , RSI and Zigzag.
Briefly about the Screener functions..
a. It uses TABLES as Labels a FIRST for any Screener on TV.
b. Tables dynamically resize based on criteria..
c. Alerts for breakouts of the UPPER and the LOWER regression channels.(2 SD)
d. In addition to LinReg it also Screens RSI for OB/OS levels so a multifunction Screener.
e. Of course has the standard summary Alerts and programmable format for Custom functions.
f. Uses only the inbuilt Auto Fib and Lin Reg code for the screener.(No proprietary stuff)
g. The auto Zigzag code is derived(Auto fib).
Question what are all these doing in a single screener ??
ZigZag is very useful in determining Trend Up or Down from one Pivot to another.
So Once you have a firm view of the Current Trend for your chosen timeframe and ticker…
We can consider few possible trading scenarios..
a. Re-entry in an Up Trend - Combination of OS Rsi And a Lower Channel breach followed by a re-entry back into the regression channel CAN be used as an effective re-entry.
b. Similarily one can join a Down Trend on OB Rsi and Upper Channel line breach followed by re-entry into the regression channel.
If ZigZag signals a range-bound market, bound within channel lines then the Upper breakout can be used to Sell and vice-versa!
In short many possibilities for using these functions together with Scanner and Alerts.
This facilitates timely PROFITABLE Trending and Counter trend opportunities across multiple tickers.
You must give a thorough READ to the various available tutorials on ZigZag / Regression and Fib retracements before attempting counter trend trades using these tools!!
A small TIP – Markets are sideways or consolidating 70% of the time!!
Acknowledgements: - Thanks a lot DGTRD for the Auto ZigZag code and also for the eagerness to help wherever possible..Respect!!
Disclaimer: The Alerts and Screener are just few tools among many and not any kind of Buy/Sell recommendations. Unless you have sufficient trading experience please consult a Financial advisor before investing real money.
*The alerts are set for crossovers however for viewing tickers trading above or below the channel use code in line 343 and 344 after setting up the Alerts!
** RSI alerts are disabled by default to avoid clutter, but if needed one can activate code lines 441,442,444 and 445
Wish you all, Happy Profitable Trading!


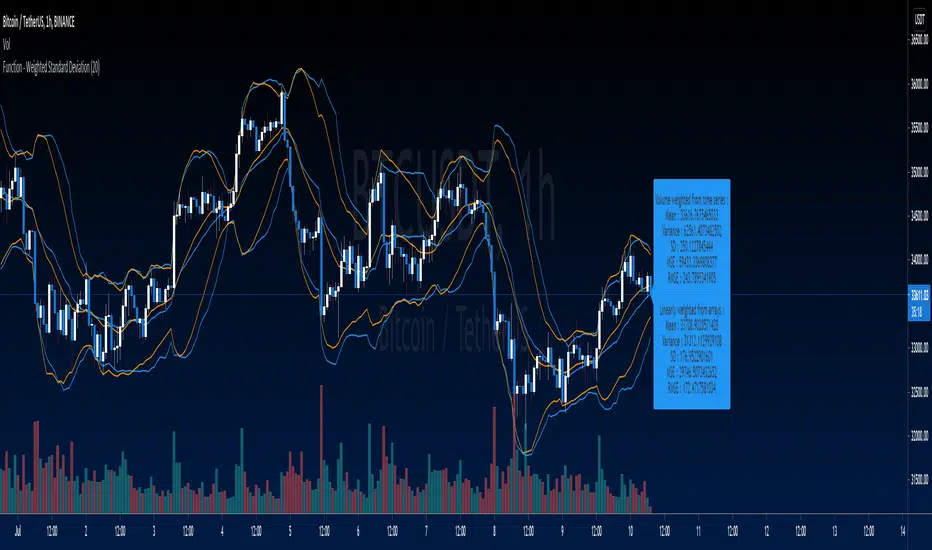
Function - Weighted Standard DeviationCalculates weighted mean, variance, standard deviation, MSE and RMSE from time series variables or arrays.
When calculating from arrays, the function expects index 0 to be the most recent sample and weight values.


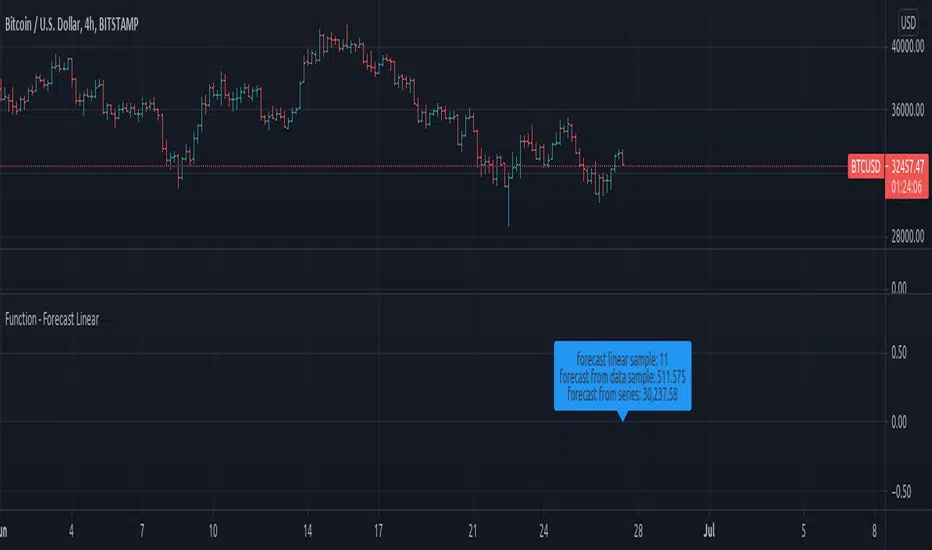
Function - Forecast LinearFunction to calculate a forecast using a linear regression approach, this is the same function used on excel and other data sheet programs.
reference:
- support.microsoft.com
- stackoverflow.com
Function - Sequence From SeriesFunction to create a array from a sample taken from a series (ex:. close, hlc3...).

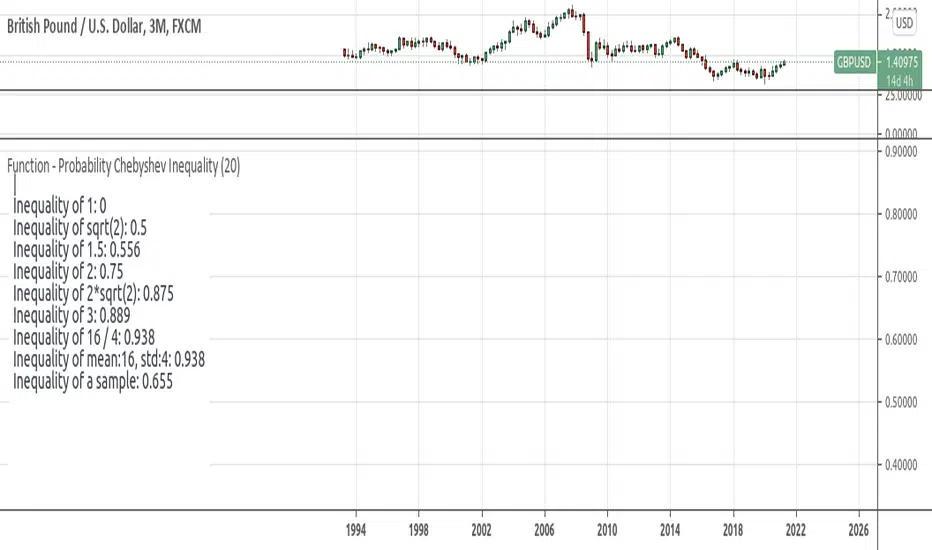
Function - Probability Chebyshev Inequalityfunction to calculate Chebyshev Inequality. wich can be used to compute the probability that we will diverge from what we expect to obtain.
reference:
- www.omnicalculator.com
- github.com
- statisticstopics.wordpress.com
- en.wikipedia.org
Function - Entropy Gini Indexfunction to retrieve Gini Impurity / Gini Index.
reference:
- victorzhou.com
- en.wikipedia.org

Function - Shannon Entropyfunctions for shannon's entropy
reference:
- en.wiktionary.org
- machinelearningmastery.com

test - event distributiondisplays the distribution of the outcome of a event over the last event.
similar to this script:

To Integer FunctionCustom toInteger() function accepts and truncates the following forms: const, input, simple, and series of the following types: float, integer, and string.
Special thanks and credit to BeeHolder for idea on using str.format("{0}", string) as workaround for accepting and handling string types!
NOTICE: This is an example script and not meant to be used as an actual strategy. By using this script or any portion thereof, you acknowledge that you have read and understood that this is for research purposes only and I am not responsible for any financial losses you may incur by using this script!
