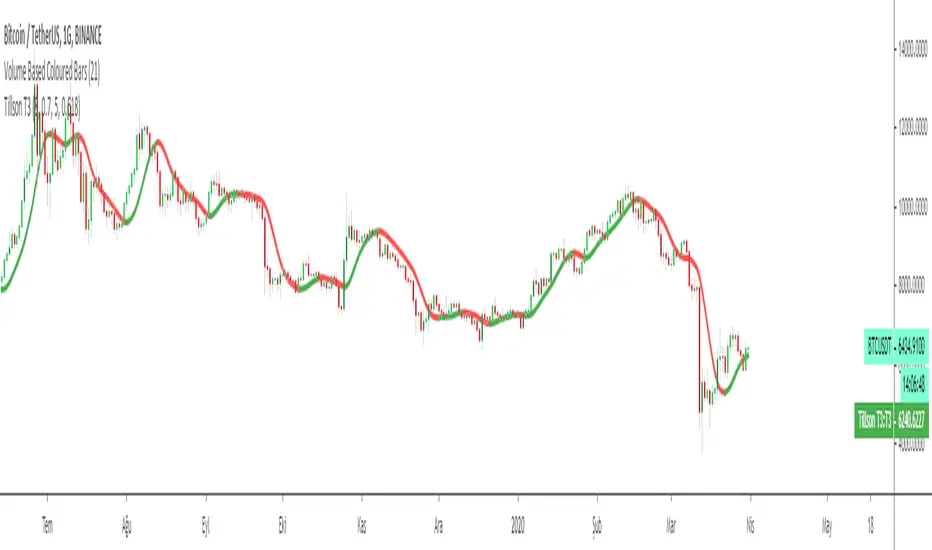
Tillson T3 Moving Average by KIVANÇ fr3762Developed by Tim Tillson, the T3 Moving Average is considered superior to traditional moving averages as it is smoother, more responsive and thus performs better in ranging market conditions as well. However, it bears the disadvantage of overshooting the price as it attempts to realign itself to current market conditions.
It incorporates a smoothing technique which allows it to plot curves more gradual than ordinary moving averages and with a smaller lag. Its smoothness is derived from the fact that it is a weighted sum of a single EMA , double EMA , triple EMA and so on. When a trend is formed, the price action will stay above or below the trend during most of its progression and will hardly be touched by any swings. Thus, a confirmed penetration of the T3 MA and the lack of a following reversal often indicates the end of a trend.
The T3 Moving Average generally produces entry signals similar to other moving averages and thus is traded largely in the same manner. Here are several assumptions:
If the price action is above the T3 Moving Average and the indicator is headed upward, then we have a bullish trend and should only enter long trades (advisable for novice/intermediate traders). If the price is below the T3 Moving Average and it is edging lower, then we have a bearish trend and should limit entries to short. Below you can see it visualized in a trading platform.
Although the T3 MA is considered as one of the best swing following indicators that can be used on all time frames and in any market, it is still not advisable for novice/intermediate traders to increase their risk level and enter the market during trading ranges (especially tight ones). Thus, for the purposes of this article we will limit our entry signals only to such in trending conditions.
Once the market is displaying trending behavior, we can place with-trend entry orders as soon as the price pulls back to the moving average (undershooting or overshooting it will also work). As we know, moving averages are strong resistance/support levels, thus the price is more likely to rebound from them and resume its with-trend direction instead of penetrating it and reversing the trend.
And so, in a bull trend, if the market pulls back to the moving average, we can fairly safely assume that it will bounce off the T3 MA and resume upward momentum, thus we can go long. The same logic is in force during a bearish trend .
And last but not least, the T3 Moving Average can be used to generate entry signals upon crossing with another T3 MA with a longer trackback period (just like any other moving average crossover). When the fast T3 crosses the slower one from below and edges higher, this is called a Golden Cross and produces a bullish entry signal. When the faster T3 crosses the slower one from above and declines further, the scenario is called a Death Cross and signifies bearish conditions.
I Personally added a second T3 line with a volume factor of 0.618 (Fibonacci Ratio) and length of 3 (fibonacci number) which can be added by selecting the box in the input section. traders can combine the two lines to have Buy/Sell signals from the crosses.
Developed by Tim Tillson
FR3762
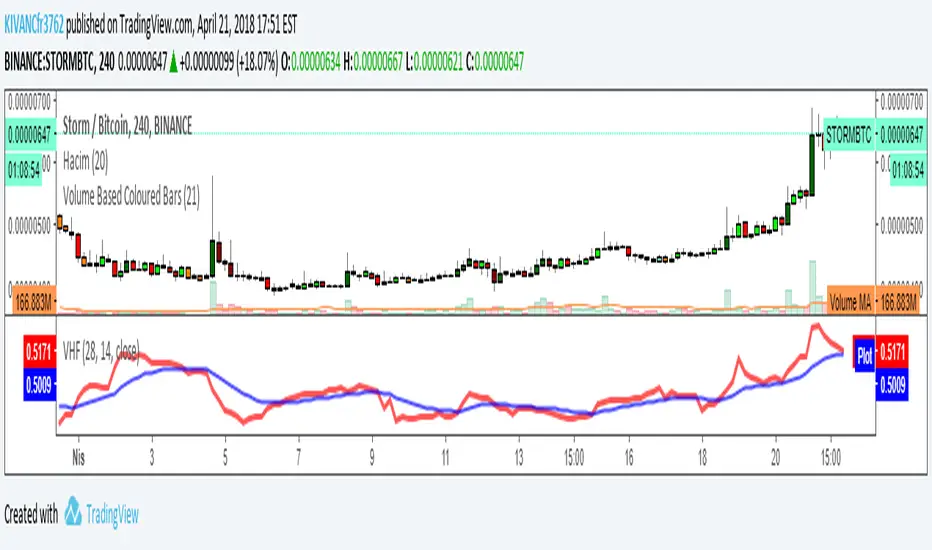
Vertical Horizontal Filter VHF by KIVANÇ fr3762Vertical Horizontal Filter
Vertical Horizontal Filter (VHF) was created by Adam White to identify trending and ranging markets. VHF measures the level of trend activity, similar to ADX in the Directional Movement System. Trend indicators can then be employed in trending markets and momentum indicators in ranging markets.
Vary the number of periods in the Vertical Horizontal Filter to suit different time frames. White originally recommended 28 days but now prefers an 18-day window smoothed with a 6-day moving average.
Trading Signals
Vertical Horizontal Filter does not, itself, generate trading signals, but determines whether signals are taken from trend or momentum indicators.
Rising values indicate a trend.
Falling values indicate a ranging market.
High values precede the end of a trend.
Low values precede a trend start.
I have added an option to plot a deafult value of 14 bar EMA too, to clarify the signals.
Formula
To calculate the Vertical Horizontal Filter:
Select the number of periods (n) to include in the indicator. This should be based on the length of the cycle that you are analyzing. The most popular is 28 days (for intermediate cycles).
Determine the highest closing price ( HCP ) in n periods.
Determine the lowest closing price (LCP) in n periods.
Calculate the range of closing prices in n periods:
HCP - LCP
Next, calculate the movement in closing price for each period:
Closing price - Closing price
Add up all price movements for n periods, disregarding whether they are up or down:
Sum of absolute values of ( Close - Close ) for n periods
Divide Step 4 by Step 6:
VHF = ( HCP - LCP) / (Sum of absolute values for n periods)
created by Adam White
VOLUME WEIGHTED MACD V2 VWMACDV2 BY KIVANÇ fr3762Second version of Buff Dormeier's Volume Weighted MACD indicator....
Here in this version; Exponential Moving Averages used and Weighted by Volume instead of using only vwma ( Volume Weighted Moving Averages).
I personally asked Mr Dormeier, the developer of this indicator, and he confirmed this second version could be used.
I personally think that this one is more effective when comparing with the vwma version...
Volume Weighted MACD
Volume Weighted MACD (VW-MACD) was created by Buff Dormeier and described in his book Investing With Volume Analysis. It represents the convergence and divergence of volume-weighted price trends.
The inclusion of volume allows the VW-MACD to be generally more responsive and reliable than the traditional MACD .
What is MACD (Moving Average Convergence Divergence)?
Moving Average Convergence Divergence was created by Gerald Appel in 1979. Standard MACD plots the difference between a short term exponential average and a long term exponential average. When the difference (the MACD line) is positive and rising, it suggests prices trend is up. When the MACD line is negative, it suggests prices trend is down.
A smooth exponential average of this difference is calculated to form the MACD signal line. When the MACD line is above the MACD signal line, it illustrates that the momentum of MACD is rising. Likewise, when the MACD is below the MACD signal line, the momentum of the MACD falls. This difference between the MACD line and the MACD signal line is frequently plotted as a histogram to highlight the spread between the two lines.
What is the difference between MACD and VW-MACD?
Volume Weighted MACD is substituting the two exponential moving averages to compute the MACD difference with the two corresponding Volume-Weighted Moving Average . Thus, VW-MACD contrasts a volume-weighted short term trend from the volume-weighted longer term trend.
The signal line is left as an exponential moving average because VW-MACD line is already volume weighted.
Developer: Buff Dormeier @BuffDormeierWFA on twitter

INTRADAY INTENSITY INDEX IIIX by KIVANÇ fr3762DEFINITION of 'Intraday Intensity Index'
A volume based indicator that depicts the flow of funds for a security according to where it closes in its high and low range.
This indicator was developed by Dave Bostian. Its goal is to track the activity of institutional block traders.
A technical indicator that approximates the volume of trading for a specified security in a given day. It is designed to help track the activity of institutional block traders and is calculated by subtracting the day's high and low from double the closing price, divided by the volume and multiplied by the difference between the high and the low.
John BOLLINGER advised to use this indicator as a confirmation tool with the BOLLINGER BANDS .
If price tags the lower BBand, look for IIIX has positive values to enter a trade.
Conversely; If price tags the upper BBand, look for IIIX has negative values to exit.
Developer: David Bostian

Moving Average Delta Indicator by KIVANC fr3762Description:
MAD stands for Moving Average Delta, it calculates the difference between moving average and price. The curve shows the difference in Pips.
By calculating the delta between two points we can see more small changes in the direction of the moving average curve which are normally hard to see. You can see the MAD curve as look through the microscope at a simple moving average curve. It may help predicting a trend change before it happens, the sample shows a beginning trend change from long to short.
Interpretation:
If the MAD curve is bigger than 0, the moving average is above the price
conversely;
If the MAD curve is smaller than 0, the moving average is below the price
Before a trend change, the moving average gets flatter, the MAD curve points to towards the zero
We can see what is the maximum rising/falling of the difference and predict an upcomming trend change
Usage:
Drop a simple moving average to a chart and set the period in a way that it best fits the movements. There is no "magic" settings for the moving average period, you may double click the MA line to set it to a different period.
Drop the MAD indicator to the cart and give it the same period as your simple moving average .

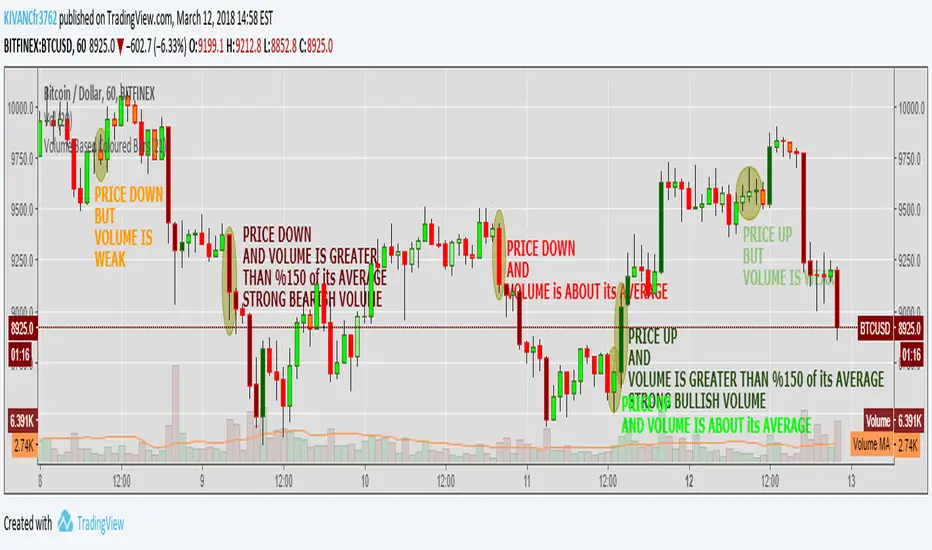
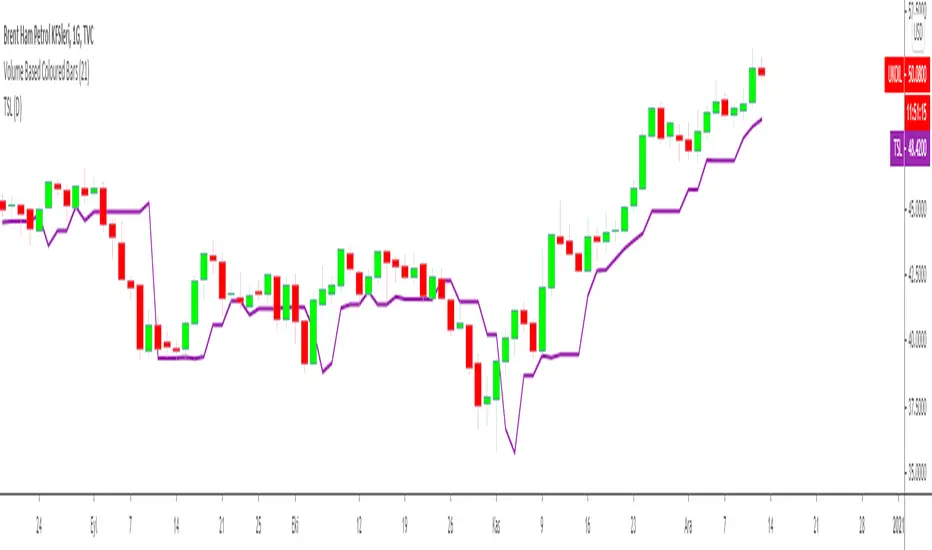
Volume Based Coloured BarsVolume Based Coloured Bars:
Most of the time traders are confused about if the price movements were supported by VOLUME .
This indicator colors the bars into volume weighted signals...
When prices go down bars are red and contraversely when up, bars are green. Additionally we have two more colors for each
situation:
PRICE BARS ARE:
DARK RED when prices go down and VOLUME is bigger than 150% of its (default 21 day) average, that indicates us price action is supported by a strong BEARISH VOLUME
RED when prices go down and VOLUME is BETWEEN 50% AND 150% of its (default 21 day) average, at this situation we can think that volume is neither strong nor weak
ORANGE when prices go down and VOLUME is just less than 50% of its (default 21 day) average, so the volume is weak and doesn't support the price action much
DARK GREEN when prices go UP and VOLUME bigger than 150% of its (default 21 day) average, that indicates us price action is supported by a strong BULLISH VOLUME
GREEN when prices go UP and VOLUME is BETWEEN 50% AND 150% of its (default 21 day) average, at this situation we can think that volume is neither strong nor weak
LIGHT GREEN when prices go UP and VOLUME is just less than 50% of its (default 21 day) average, so the volume is weak and doesn't support the price action much
21 day Simple Moving Average used as default value which can be changed in the settings menu,
21 day is considered as a month for STOCK Markets, it would be more accurate to set the value to 30 for CRYPTO CURRENCIES
Trailing Resistance Indicator by KıvanÇ fr3762TRAILING RESISTANCE INDICATOR is a helpful tool for traders to help one of the common problems that they face: where to buy/sell?
by using trailing resistance you can easily decide and see possible upward movements and understand if you are in a safe zone.
Using Trailing Resistance is just simple:
Go long/ Buy when price crosses above the indicator,
Stay on short position if prices are below the indicator.
The indicator is calculated from previous Lows and doesn't the value won't change until prices makes higher lows.

A2MK Mavilim by KıvanÇ fr3762A2MK is a two lined indicator which gives Short and Long signals...
Go long when GREEN line crosses ABOVE YELLOW
Go short when YELLOW line crosses ABOVE GREEN
(the default version of the indicator has the Yellow line although I personally changed the color to Orange to recognise better)
You can change the length of the two lines but creator (@mavilim0732 on twitter ) explained: there's no need to change the YELLOW line's length. (default value=10)
Green line has the length of a default value of 6, you can set it to lower lengths to provide earlier signals but keep in mind that if you do that you'll have more signals
The main feature of A2MK is the few number of false signals.
signals are very reliable when comparing lots of other indicators
creator: @mavilim0732 on twitter
İndikatörü geliştiren: @mavilim0732 on twitter

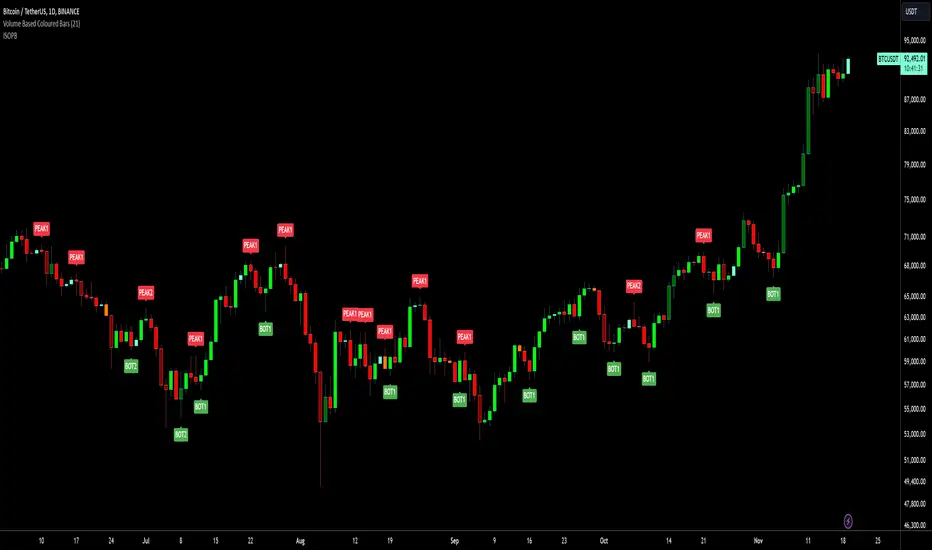
Isolated Peak and Bottom (Tuncer ŞENGÖZ) by KıvanÇ fr3762This Technique is created by Tuncer Şengöz @TuncerSengoz on twitter
An uptrend with higher highs might not make new highs everyday. So how could we define the end of an uptrend? How could we tell the difference between the end of an uptrend and a temporary correction? This isolated high/low technique aims to help us in this kind of situations.
We call the highest point of an uptrend until the particular day “an isolated Peak” and consider the lowest point of the day before as a signal level. If the signal level is broken in 2 days, we assume the uptrend to be over. If it is not broken in 2 days, the uptrend continues. The same technique also applies to a downtrend and the only difference would be the direction.
conversely it has the same logic of finding an end of a downtrend, called "Isolated Bottom" which can be considered the highest point of the day before as a signal level the same way.
The success rate of this technique is quite high (around 85%). There is no required term for this technique and it can be used in yearly, daily or ticker charts, because the market moves in fractals and repeats itself in every scale.
As in every technique, it might also give false signals in some situations like extreme volatility or emotional decisions of masses. However, it will be very helpful for us to indicate the direction of a trend.
Creator: Tuncer ŞENGÖZ @TuncerSengoz on twitter
Trailing Stop Loss Indicator by KıvanÇ fr3762TRAILING STOP LOSS INDICATOR is a helpful tool for traders to help one of the greatest problems that they face: where to sell?
by using trailing stop loss you can easily decide and see possible downward movements and understand if you are in a safe zone.
Using Trailing Stop Loss is just simple:
Go short/ Sell when price crosses down the indicator,
Stay on long position if prices are above the indicator.
The indicator is calculated from previous Lows and doesn't the value won't change until prices makes higher lows.
TURKISH EXPLANATION:
İz Süren Stop Loss İndikatörü
Adım 1- bu günün düşük fiyatından geriye doğru, daha düşük fiyatlı bir günle karşılaşıncaya kadar yatay bir çizgi çizin
bu sizin birinci countback’ iniz olacak.
Adım 2- bu yeni düşük günün düşük fiyatından geriye doğru tekrar bir başka düşük güne gelene kadar yatay bir çizgi
çekin. Bu sizin ikinci countback’ iniz olacak.
Adım 3- bu ikinci düşük günün düşüğünden ileri bu günkü tarihe kadar yatay bir çizgi çekin bu sizin talimat
verdiğinizde stop-loss noktanız oluyor.
Kural 1- asla aşağıya doğru stop koymayın. Eğer yeni stop-loss noktanız öncekinden daha düşükse onu atıyorsunuz.
Bu kural asla bozulmamalı.
Kural 2- countback çizginiz üzerindeki aynı düşük fiyata denk gelen günleri yok sayın. İkinci contback çizginizi çekmek
için ilkinden daha düşük bir nokta bulmalısınız. Eğer aynı düşük fiyata sahip bir çubuğa denk gelirseniz daha düşüğünü
buluncaya kadar devam edin. Gerçekten hepsi bu kadar. Bu kuralları uygulayarak stop-loss noktamızı her yeni günün
datası eklendikçe uzatabiliriz.
drive.google.com
TKE INDICATOR by KıvanÇ fr3762TKE INDICATOR is created by Dr Yasar ERDINC (@yerdinc65 on twitter )
It's exactly the arithmetical mean of 7 most commonly used oscillators which are:
RSI
STOCHASTIC
ULTIMATE OSCILLATOR
MFI
WIILIAMS %R
MOMENTUM
CCI
the calculation is simple:
TKE=(RSI+STOCHASTIC+ULTIMATE OSCILLATOR+MFI+WIILIAMS %R+MOMENTUM+CCI)/7
Buy signal: when TKE crosses above 20 value
Oversold region: under 20 value
Overbought region: over 80 value
Another usage of TKE is with its EMA ,
You can add the EMA line of TKE in the settings menu by clicking the "Show EMA Line" button:
the default value is defined as 5 bars of EMA of the TKE line,
Go long: when TKE crosses above EMALine
Go short: when TKE crosses below EMALine

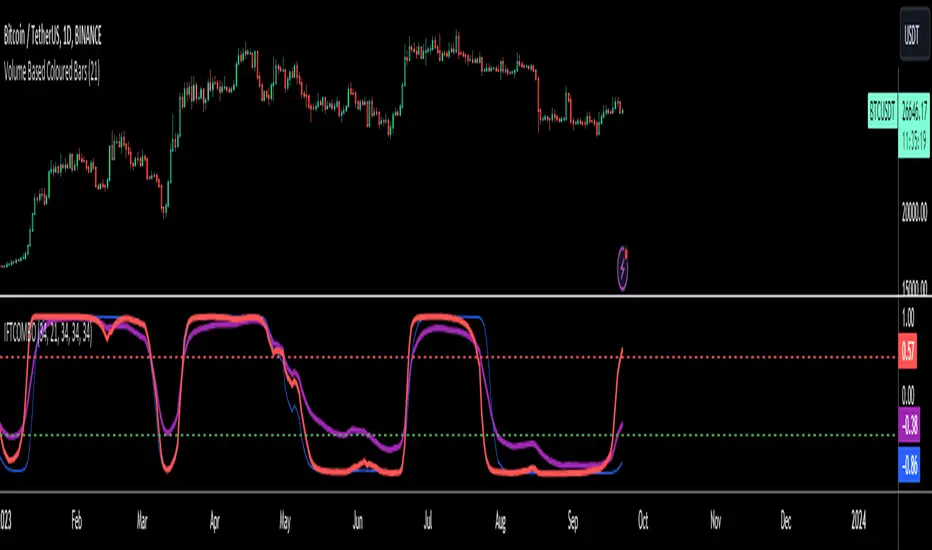
Inverse Fisher Transform COMBO STO+RSI+CCIv2 by KIVANÇ fr3762A combined 3in1 version of pre shared INVERSE FISHER TRANSFORM indicators on RSI , on STOCHASTIC and on CCIv2 to provide space for 2 more indicators for users...
About John EHLERS:
From California, USA, John is a veteran trader. With 35 years trading experience he has seen it all. John has an engineering background that led to his technical approach to trading ignoring fundamental analysis (with one important exception).
John strongly believes in cycles. He’d rather exit a trade when the cycle ends or a new one starts. He uses the MESA principle to make predictions about cycles in the market and trades one hundred percent automatically.
In the show John reveals:
• What is more appropriate than trading individual stocks
• The one thing he relies upon in his approach to the market
• The detail surrounding his unique trading style
• What important thing underpins the market and gives every trader an edge
About INVERSE FISHER TRANSFORM:
The purpose of technical indicators is to help with your timing decisions to buy or
sell. Hopefully, the signals are clear and unequivocal. However, more often than
not your decision to pull the trigger is accompanied by crossing your fingers.
Even if you have placed only a few trades you know the drill.
In this article I will show you a way to make your oscillator-type indicators make
clear black-or-white indication of the time to buy or sell. I will do this by using the
Inverse Fisher Transform to alter the Probability Distribution Function ( PDF ) of
your indicators. In the past12 I have noted that the PDF of price and indicators do
not have a Gaussian, or Normal, probability distribution. A Gaussian PDF is the
familiar bell-shaped curve where the long “tails” mean that wide deviations from
the mean occur with relatively low probability. The Fisher Transform can be
applied to almost any normalized data set to make the resulting PDF nearly
Gaussian, with the result that the turning points are sharply peaked and easy to
identify. The Fisher Transform is defined by the equation
1)
Whereas the Fisher Transform is expansive, the Inverse Fisher Transform is
compressive. The Inverse Fisher Transform is found by solving equation 1 for x
in terms of y. The Inverse Fisher Transform is:
2)
The transfer response of the Inverse Fisher Transform is shown in Figure 1. If
the input falls between –0.5 and +0.5, the output is nearly the same as the input.
For larger absolute values (say, larger than 2), the output is compressed to be no
larger than unity . The result of using the Inverse Fisher Transform is that the
output has a very high probability of being either +1 or –1. This bipolar
probability distribution makes the Inverse Fisher Transform ideal for generating
an indicator that provides clear buy and sell signals.
Creator: John EHLERS
Squeeze Momentum Indicator [LazyBear] Version2 by KıvanÇ fr3762Modified version of Squeeze Momentum Indicator including line graph of the main indicator instead of using a Histogram and a second Signal line (5 bars SMA of the original line) to provide visual BUY/SELL signals
BUY when Blue crosses ABOVE the RED signal line
SELL when Blue crosses BELOW the RED signal line
author: LazyBear
modified by: KıvanÇ @fr3762 on twitter (tweets are only in TURKISH)
TURKISH EXPLANATION:
Orijinal indikatördeki histogram yerine çizgi grafiği alınarak bu grafiğin 5 barlık basit hareketli ortalaması sinyal çizgisi olarak eklendi.
Al Koşulu: Mavi çizginin Kırmızıyı yukarı kesmesi
Sat koşulu: Kırmızı çizginin Maviyi yukarı kesmesi

Zero Lag EMA v2 by KIVANÇ fr3762A different version of ZERO LAG EMA indicator by John Ehlers and Ric Way...
In this cover, Zero Lag EMA is calculated without using the PREV function.
The main purpose is that to provide BUY/SELL signals earlier than classical EMA's.
You can see the difference of conventional and Zero Lag EMA in the chart.
The red line is classical EMA and the blue colored line is ZEMA ( Zero Lag Ema ).
Turkish Explanation:
Ehlers ve Way'in ZERO LAG ,ndikatörünün Prev (previous value) kullanılmadan yorumlanarak hesaplanmış hali.
Amaç klasik Üssel Ortalamaya göre daha hızlı tepki verip, Al/Sat sinyallerini daha erken alabilmek.
Grafikte kırmızı renkle görülen normal Üssel HO ve mavi renkli olan Zero Lag (gecikmesiz) Üssel HO

Super Smoothed MACD for STOCKS by KIVANÇ fr3762THIS INDICATOR IS DESIGNED USING EHLERS' SUPER SMOOTHER FILTER
DESIGNED FOR STOCKS
(another version available for CRYPTO TRADE: Super Smoothed MACD for CRYPTO by KIVANÇ fr3762)
Instead of EXPONENTIAL MOVING AVERAGES in traditional MACD calculation, Super Smoothed prices are used.
The default values of BAND EDGE's (periods) of these Super Smoothed Prices are 13,8, and 3 (Fibonacci numbers) which pretty work well for daily trade
users can change these values 13,8,5 or 21,13,5 or 21,13,8 and so on to have optimum trade productivity

Super Smoothed MACD for CRYPTO by KIVANÇ fr3762THIS INDICATOR IS DESIGNED USING EHLERS' SUPER SMOOTHER FILTER
DESIGNED FOR CRYPTO TRADE
(another version available for stocks also: Super Smoothed MACD for STOCKS by KIVANÇ fr3762)
Instead of EXPONENTIAL MOVING AVERAGES in traditional MACD calculation, Super Smoothed prices are used.
The default values of BAND EDGE's (periods) of these Super Smoothed Prices are 13,8, and 5 (Fibonacci numbers) which pretty work well for daily trade
users can change these values 13,8,3 or 21,13,5 or 21,13,8 and so on to have optimum trade productivity
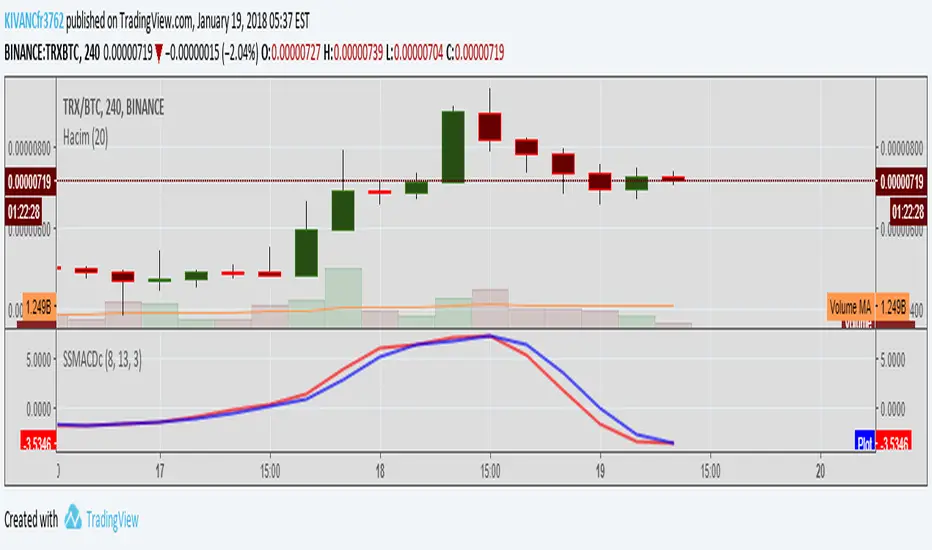
SuperSmootherK by KIVANÇ fr3762Ehlers'ın Super Smoother Filtresinin Fibonacci Sayıları Kullanılarak MACD formülasyonunda kullanılması
Klasik MACD hesabında kullanılan ÜSSEL HAREKETLİ ORTALAMALAR YERİNE SUPER SMOOTHER YÖNTEMİ İLE OLUŞTURULAN ÇİZGİLER KULLANILMIŞTIR
TEST AŞAMASI BİTTİĞİNDE FORMÜLÜ DE PAYLAŞACAĞIM
Sevgiler
Kıvanç

Inverse Fisher Transform on SMI (Stochastic Momentum Index)Inverse Fisher Transform on SMI (Stochastic Momentum Index)
About John EHLERS:
From California, USA, John is a veteran trader. With 35 years trading experience he has seen it all. John has an engineering background that led to his technical approach to trading ignoring fundamental analysis (with one important exception).
John strongly believes in cycles. He’d rather exit a trade when the cycle ends or a new one starts. He uses the MESA principle to make predictions about cycles in the market and trades one hundred percent automatically.
In the show John reveals:
• What is more appropriate than trading individual stocks
• The one thing he relies upon in his approach to the market
• The detail surrounding his unique trading style
• What important thing underpins the market and gives every trader an edge
About INVERSE FISHER TRANSFORM:
The purpose of technical indicators is to help with your timing decisions to buy or
sell. Hopefully, the signals are clear and unequivocal. However, more often than
not your decision to pull the trigger is accompanied by crossing your fingers.
Even if you have placed only a few trades you know the drill.
In this article I will show you a way to make your oscillator-type indicators make
clear black-or-white indication of the time to buy or sell. I will do this by using the
Inverse Fisher Transform to alter the Probability Distribution Function (PDF) of
your indicators. In the past12 I have noted that the PDF of price and indicators do
not have a Gaussian, or Normal, probability distribution. A Gaussian PDF is the
familiar bell-shaped curve where the long “tails” mean that wide deviations from
the mean occur with relatively low probability. The Fisher Transform can be
applied to almost any normalized data set to make the resulting PDF nearly
Gaussian, with the result that the turning points are sharply peaked and easy to
identify. The Fisher Transform is defined by the equation
1)
Whereas the Fisher Transform is expansive, the Inverse Fisher Transform is
compressive. The Inverse Fisher Transform is found by solving equation 1 for x
in terms of y. The Inverse Fisher Transform is:
2)
The transfer response of the Inverse Fisher Transform is shown in Figure 1. If
the input falls between –0.5 and +0.5, the output is nearly the same as the input.
For larger absolute values (say, larger than 2), the output is compressed to be no
larger than unity. The result of using the Inverse Fisher Transform is that the
output has a very high probability of being either +1 or –1. This bipolar
probability distribution makes the Inverse Fisher Transform ideal for generating
an indicator that provides clear buy and sell signals.

MACDeA different style of MACD indicator with different period values of WEIGHTED and EXPONENTIAL MOVING AVERAGES INSTEAD OF only EXPONENTIAL.
Default MOVING AVERAGES ARE
faster period: 8bars EMA
slower period: 13 bars EMA
signal period: 5 bars WMA
TURKISH EXPLANATION:
MACD indikatörünün sadece üssel yerine AĞIRLIKLI ve ÜSSEL hareketli ortalamalar kullanılarak daha erken sinyaller alabilmek için daha kısa periyotlarla yorumlanması
fikir @kenyaborsa on twitter
yazar: KIVANÇ @fr3762 on twitter

Double HULL Moving AverageTHIS IS A COMBINATION OF TWO HULL MOVING AVERAGE LINES
-ONE WITH LONGER PERIOD
-OTHER WITH SHORTER PERIOD TO INDICATE BUY/SELL SIGNALS
AS THE KNOWN GENERAL RULE;
IT WOULD BE A BUY SIGNAL WHEN SHORTER(BLUE LINE) HULL CROSSES ABOVE LONGER (RED LINE) ONE
AND CONVERSELY A SELL SIGNAL WHEN LONGER HULL CROSSES ABOVE SHORTER ONE
THIS STUFF IS USEFUL FOR USERS COMPLAINING ABOUTREACHING THE MAXIMUM NUMBER OF INDICATORS :)
KıvanÇ
@fr3762 on twitter (only tweeting in TURKISH)
fr3762 on youtube for indicator explanations in TURKISH)
TURKISH EXPLANATION:
2 HULL hareketli ortalaması aynı grafikte:
Kısa periyotlu (mavi) olan uzunu yukarı kestiğinde AL
Uzun periyotlu (kırmızı) olan kısayı yukarı kestiğinde SAT sinyalleri üretir
Varsayılan periyotlar, birer Fibonacci sayıları olan 8 ve 21 olarak belirlenmiştir, değiştirilebilir.
İndikatör sayısı sınırlamasının önüne geçmek amacıyla geliştirilmiştir.

Inverse Fisher Transform on MFIAbout John EHLERS:
From California, USA, John is a veteran trader. With 35 years trading experience he has seen it all. John has an engineering background that led to his technical approach to trading ignoring fundamental analysis (with one important exception).
John strongly believes in cycles. He’d rather exit a trade when the cycle ends or a new one starts. He uses the MESA principle to make predictions about cycles in the market and trades one hundred percent automatically.
In the show John reveals:
• What is more appropriate than trading individual stocks
• The one thing he relies upon in his approach to the market
• The detail surrounding his unique trading style
• What important thing underpins the market and gives every trader an edge
About INVERSE FISHER TRANSFORM:
The purpose of technical indicators is to help with your timing decisions to buy or
sell. Hopefully, the signals are clear and unequivocal. However, more often than
not your decision to pull the trigger is accompanied by crossing your fingers.
Even if you have placed only a few trades you know the drill.
In this article I will show you a way to make your oscillator-type indicators make
clear black-or-white indication of the time to buy or sell. I will do this by using the
Inverse Fisher Transform to alter the Probability Distribution Function (PDF) of
your indicators. In the past12 I have noted that the PDF of price and indicators do
not have a Gaussian, or Normal, probability distribution. A Gaussian PDF is the
familiar bell-shaped curve where the long “tails” mean that wide deviations from
the mean occur with relatively low probability. The Fisher Transform can be
applied to almost any normalized data set to make the resulting PDF nearly
Gaussian, with the result that the turning points are sharply peaked and easy to
identify. The Fisher Transform is defined by the equation
1)
Whereas the Fisher Transform is expansive, the Inverse Fisher Transform is
compressive. The Inverse Fisher Transform is found by solving equation 1 for x
in terms of y. The Inverse Fisher Transform is:
2)
The transfer response of the Inverse Fisher Transform is shown in Figure 1. If
the input falls between –0.5 and +0.5, the output is nearly the same as the input.
For larger absolute values (say, larger than 2), the output is compressed to be no
larger than unity. The result of using the Inverse Fisher Transform is that the
output has a very high probability of being either +1 or –1. This bipolar
probability distribution makes the Inverse Fisher Transform ideal for generating
an indicator that provides clear buy and sell signals.

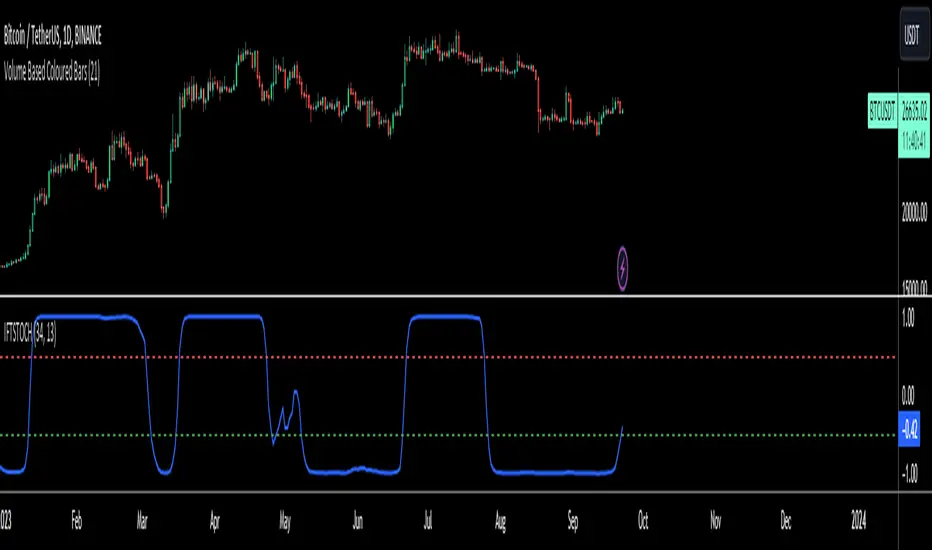
Inverse Fisher Transform on STOCHASTICAbout John EHLERS:
From California, USA, John is a veteran trader. With 35 years trading experience he has seen it all. John has an engineering background that led to his technical approach to trading ignoring fundamental analysis (with one important exception).
John strongly believes in cycles. He’d rather exit a trade when the cycle ends or a new one starts. He uses the MESA principle to make predictions about cycles in the market and trades one hundred percent automatically.
In the show John reveals:
• What is more appropriate than trading individual stocks
• The one thing he relies upon in his approach to the market
• The detail surrounding his unique trading style
• What important thing underpins the market and gives every trader an edge
About INVERSE FISHER TRANSFORM:
The purpose of technical indicators is to help with your timing decisions to buy or
sell. Hopefully, the signals are clear and unequivocal. However, more often than
not your decision to pull the trigger is accompanied by crossing your fingers.
Even if you have placed only a few trades you know the drill.
In this article I will show you a way to make your oscillator-type indicators make
clear black-or-white indication of the time to buy or sell. I will do this by using the
Inverse Fisher Transform to alter the Probability Distribution Function (PDF) of
your indicators. In the past12 I have noted that the PDF of price and indicators do
not have a Gaussian, or Normal, probability distribution. A Gaussian PDF is the
familiar bell-shaped curve where the long “tails” mean that wide deviations from
the mean occur with relatively low probability. The Fisher Transform can be
applied to almost any normalized data set to make the resulting PDF nearly
Gaussian, with the result that the turning points are sharply peaked and easy to
identify. The Fisher Transform is defined by the equation
1)
Whereas the Fisher Transform is expansive, the Inverse Fisher Transform is
compressive. The Inverse Fisher Transform is found by solving equation 1 for x
in terms of y. The Inverse Fisher Transform is:
2)
The transfer response of the Inverse Fisher Transform is shown in Figure 1. If
the input falls between –0.5 and +0.5, the output is nearly the same as the input.
For larger absolute values (say, larger than 2), the output is compressed to be no
larger than unity. The result of using the Inverse Fisher Transform is that the
output has a very high probability of being either +1 or –1. This bipolar
probability distribution makes the Inverse Fisher Transform ideal for generating
an indicator that provides clear buy and sell signals.
Inverse Fisher Transform on CCIAbout John EHLERS:
From California, USA, John is a veteran trader. With 35 years trading experience he has seen it all. John has an engineering background that led to his technical approach to trading ignoring fundamental analysis (with one important exception).
John strongly believes in cycles. He’d rather exit a trade when the cycle ends or a new one starts. He uses the MESA principle to make predictions about cycles in the market and trades one hundred percent automatically.
In the show John reveals:
• What is more appropriate than trading individual stocks
• The one thing he relies upon in his approach to the market
• The detail surrounding his unique trading style
• What important thing underpins the market and gives every trader an edge
About INVERSE FISHER TRANSFORM:
The purpose of technical indicators is to help with your timing decisions to buy or
sell. Hopefully, the signals are clear and unequivocal. However, more often than
not your decision to pull the trigger is accompanied by crossing your fingers.
Even if you have placed only a few trades you know the drill.
In this article I will show you a way to make your oscillator-type indicators make
clear black-or-white indication of the time to buy or sell. I will do this by using the
Inverse Fisher Transform to alter the Probability Distribution Function (PDF) of
your indicators. In the past12 I have noted that the PDF of price and indicators do
not have a Gaussian, or Normal, probability distribution. A Gaussian PDF is the
familiar bell-shaped curve where the long “tails” mean that wide deviations from
the mean occur with relatively low probability. The Fisher Transform can be
applied to almost any normalized data set to make the resulting PDF nearly
Gaussian, with the result that the turning points are sharply peaked and easy to
identify. The Fisher Transform is defined by the equation
1)
Whereas the Fisher Transform is expansive, the Inverse Fisher Transform is
compressive. The Inverse Fisher Transform is found by solving equation 1 for x
in terms of y. The Inverse Fisher Transform is:
2)
The transfer response of the Inverse Fisher Transform is shown in Figure 1. If
the input falls between –0.5 and +0.5, the output is nearly the same as the input.
For larger absolute values (say, larger than 2), the output is compressed to be no
larger than unity. The result of using the Inverse Fisher Transform is that the
output has a very high probability of being either +1 or –1. This bipolar
probability distribution makes the Inverse Fisher Transform ideal for generating
an indicator that provides clear buy and sell signals.
