White NoiseThe "White Noise" indicator is designed to visualize the dispersion of price movements around a moving average, providing insights into market noise and potential trend changes. It highlights periods of increased volatility or noise compared to the underlying trend.
Code Explanation:
Inputs:
mlen: Input for the length of the noise calculation.
hlen: Input for the length of the Hull moving average.
col_up: Input for the color of the up movement.
col_dn: Input for the color of the down movement.
Calculations:
ma: Calculate the simple moving average of the high, low, and close prices (hlc3) over the specified mlen period.
dist: Calculate the percentage distance between the hlc3 and the moving average ma, then scale it by 850. This quantifies the deviation from the moving average as a value.
sm: Smooth the calculated dist values using a weighted moving average (WMA) twice, with different weights, and subtract one from the other. This provides a smoothed representation of the dispersion.
Coloring:
col_wn: Determine the color of the bars based on whether dist is positive or negative and whether it's greater or less than the smoothed sm value. This creates color-coded columns indicating upward or downward movements with varying opacity.
col_switch: Define the color for the current trend state. It switches color when the smoothed sm crosses above or below its previous value, indicating potential trend changes.
col_switch2: Define the color for the horizontal line that separates the two trend states. It switches color based on the same crossover and crossunder conditions as col_switch.
Plots:
plot(dist): Plot the dispersion values as columns with color defined by col_wn.
plot(sm): Plot the smoothed dispersion line with a white color and thicker linewidth.
plot(sm ): Plot the previous smoothed dispersion value with a lighter white color to create a visual distinction.
Usage:
This indicator can help traders identify periods of increased market noise, visualize potential trend reversals, and assess the strength of price movements around the moving average. The colored columns and smoothed line offer insights into the ebb and flow of market sentiment, aiding in decision-making.
ps. This can be used as a long-term TPI component if you dabble in Modern Portfolio Theory (MPT)
Recommended for timeframes on the 1D or above:
Filter

Sublime Trading | Trend Strength FilterWhat kind of traders/investors are we?
We are trend followers. Our scripts are designed to be used on the higher timeframes (weekly/daily) to catch the large moves/trends in the market.
Most have heard of long-term trend following. Few know how to execute the strategy.
Our scripts are designed specifically to identify and invest in long-term market trends.
What does this script do?
Identifying trends is at the heart of sound investing.
This script is colour coded to help identify long-term trends and environments where you will want to consider taking positions.
It is also designed to identify sideways/consolidating markets, environments where you will want to consider standing aside.
How is the trailing stoploss produced?
The script uses two sets of Bollinger Bands, one with setting Standard Deviation 1 and the other with Standard Deviation 2.
These settings help to create 3 zones - Buy, Sell and Stand Aside.
The bars will change colour according to which zone they are in.
The Buy zone is colour-coded green, and when a bull market or the start of a bull trend is in play. The green switches from light green to dark green as the asset’s price moves above the Buy zone.
This switch in colour serves as a warning that a reversal/pullback may occur next from bullish to bearish.
The Sell zone is colour-coded red and when a bear market or the start of a bear trend is in play. The red switches from light red to dark red as the asset’s price moves below the Sell zone.
This switch in colour serves as a warning that a reversal/pullback may occur next from bearish to bullish.
The Stand Aside is confirmed when the colour-code changes to grey. This may not necessarily mean a trend reversal but simply a time to apply patience before a trend continuation.
A sustained mixture of red, green and grey bars confirms a consolidation or sideways market and when investors/traders will want to stand aside and consider another asset.
What is the best timeframe to use the script?
Long-term trends are identified on the daily and weekly timeframes where traders and investors take fewer positions but hold for longer time periods.
We recommend using the script in unison on the weekly and daily timeframes.
When both timeframes fall into the Buy zone and colour-coded green, it signifies a strong bull market.
When both timeframes fall into the Sell zone and colour-coded red, it signifies a strong bear market.
When there is a mixture of green, red and grey bars across the two timeframes, it signifies a sideways market and when investors stand aside and protect their capital.
The weekly timeframe will also help mask the noise on the daily timeframe, allowing you to hold positions longer.
The Trailing Strength Filter script is for investors who want to identify and invest in long-term trends whilst simultaneously eliminating intraday swings.
What makes this script unique?
Identifying the start of long-term trends and then riding out established trends are among the main struggles budding investors face. This script has been coded specifically for the daily and weekly timeframe to:
Seamlessly identify the start, middle and end of trends
Align with the market and remove social media noise calling market tops and bottoms
Allow for discretion when entering but particularly exiting of positions if a market trend has not ended
This trend filter script ensures alignment with long-term market trends.

Pro ScalperOverview
The Pro Scalper indicator is a powerful day trading tool designed specifically for the 30-minute timeframe, catering to stock and cryptocurrency markets. It provides traders with buy and sell signals, dynamic overbought/oversold zones, and reversal signal indicators. By combining a Kalman-adapted Supertrend calculation for buy and sell signals, and VWMA bands to determine overbought/oversold zones, this indicator aims to assist traders in identifying potential trading opportunities for scalping and day trading strategies using trend-following and mean-reverting methods. This combination of Kalman Filtering with an adapted Supertrend seeks to mitigate false signals, filter out market noise, and aims to provide traders with more reliable buy and sell indications.
Features
Buy and Sell Signals: Pro Scalper generates buy and sell signals based on a Kalman-adapted Supertrend calculation. These signals help traders identify potential entry and exit points in the market.
Dynamic Overbought/Oversold Zones: The indicator dynamically calculates overbought and oversold zones using VWMA bands. These zones provide valuable insights into potential price exhaustion levels, aiding traders in managing risk and identifying potential reversals.
Reversal Signals (R Labels): The indicator includes "R" labels that indicate potential reversal signals. These signals are based on the overbought/oversold zones calculated with VWMA bands. The appearance of an "R" label suggests a possible price reversal, offering traders an additional tool for decision-making.
Calculations
This indicator stands out as a unique tool due to unique Kalman filtering and altered Supertrend calculation, as well as its combination of specific features. This indicator combines the following calculations to provide its features:
Kalman Filter: The indicator employs a Kalman Filter to adapt the Supertrend calculation. This calculation was based on mathematical equations derived from Rudolf E. Kalman. This Kalman Filter helps smooth out price data, reducing noise and removing outliers from data.
Supertrend Calculation: This particular supertrend possesses alterations to price series data and ATR calculations in an aim to improve signal accuracy. Additionally, the calculation uses Kalman-filtering within the calculation to provide a powerful framework to handle uncertainties, noise, and changing conditions.
VWMA Bands: VWMA (Volume-Weighted Moving Average) bands are calculated using the highest high and lowest low values with specified multipliers. These bands are used to determine the dynamic overbought and oversold zones, giving traders insights into potential price exhaustion levels. These are included with the aim to adapt to changing market conditions and price data. This adaptability allows the zones to accurately reflect the current price volatility and trend.
Utility
This tool provides traders with valuable information for scalping and day trading strategies in the 30-minute timeframe. It helps traders by:
Generating buy and sell signals, indicating potential entry and exit points.
Calculating dynamic overbought/oversold zones, enabling traders to identify potential price exhaustion levels.
Displaying "R" labels to highlight potential reversal signals.
Offering optional alerts for reversal signals, buy/sell signals, allowing traders to stay updated even when they're not actively monitoring the charts.
Remember, past performance does not guarantee future performance. Traders should utilize this indicator as part of a comprehensive trading strategy and exercise their own judgment when making trading decisions.

Savitzky-Golay Filtered Chande Momentum OscillatorThe Savitzky-Golay Filtered Chande Momentum Oscillator (SGCMO) is a modified version of the Chande Momentum Oscillator that functions as a powerful analytical tool, capable of detecting trends and mean reversals. By applying a Savitzky-Golay filter to the price data, the oscillator provides enhanced visualization and smoother readings. (credit to © anieri for the Savitzky-Golay filter code: www.tradingview.com)
Chande Momentum Oscillator
The Chande Momentum Oscillator (CMO) is a technical indicator developed by Tushar Chande. It measures the momentum of an asset's price movement and provides insights into the overbought or oversold conditions of the market. The CMO calculates the difference between the sum of positive price changes and the sum of negative price changes over a specified period, and then normalizes it to a scale between -100 and +100. Traders and investors use the CMO to identify potential trend reversals, confirm the strength of a current trend, and generate buy or sell signals.
Smoothing
The Savitzky-Golay filter is a digital filter commonly employed for smoothing and noise reduction in time-series data. In the context of the SGCMO, the aim is to effectively smooth the CMO values, reducing the impact of short-term fluctuations and providing clearer insights into underlying trends. Additionally, an exponential moving average (EMA) filter is applied to further reduce noise and enhance trend visibility. This filtered CMO indicator may provide traders and investors with a clearer and more refined representation of momentum changes in the underlying asset, helping them make more informed trading decisions.
Application
The SGCMO serves as both a trend-following and mean-reversion tool. Traders can track the current trend using bullish white lines or bearish orange lines in trending markets. Alternatively, they can utilize green and red vertical lines, which indicate price retracement and help capture pullbacks and reversals. Green vertical lines appear when the trend reverses upwards in an oversold zone (-50 to -80), while red vertical lines indicate negative trend reversals in an overbought zone (50 to 80). Opening long positions when green and white lines appear, or short positions when red and orange lines are visible, can be considered. However, it is advisable to combine this indicator with other complementary technical analysis tools and incorporate it into a comprehensive trading strategy to maximize its effectiveness.

Kalman Filtered ROC & Stochastic with MA SmoothingThe "Smooth ROC & Stochastic with Kalman Filter" indicator is a trend following tool designed to identify trends in the price movement. It combines the Rate of Change (ROC) and Stochastic indicators into a single oscillator, the combination of ROC and Stochastic indicators aims to offer complementary information: ROC measures the speed of price change, while Stochastic identifies overbought and oversold conditions, allowing for a more robust assessment of market trends and potential reversals. The indicator plots green "B" labels to indicate buy signals and blue "S" labels to represent sell signals. Additionally, it displays a white line that reflects the overall trend for buy signals and a blue line for sell signals. The aim of the indicator is to incorporate Kalman and Moving Average (MA) smoothing techniques to reduce noise and enhance the clarity of the signals.
Rationale for using Kalman Filter:
The Kalman Filter is chosen as a smoothing tool in the indicator because it effectively reduces noise and fluctuations. The Kalman Filter is a mathematical algorithm used for estimating and predicting the state of a system based on noisy and incomplete measurements. It combines information from previous states and current measurements to generate an optimal estimate of the true state, while simultaneously minimizing the effects of noise and uncertainty. In the context of the indicator, the Kalman Filter is applied to smooth the input data, which is the source for the Rate of Change (ROC) calculation. By considering the previous smoothed state and the difference between the current measurement and the predicted value, the Kalman Filter dynamically adjusts its estimation to reduce the impact of outliers.
Calculation:
The indicator utilizes a combination of the ROC and the Stochastic indicator. The ROC is smoothed using a Kalman Filter (credit to © Loxx: ), which helps eliminate unwanted fluctuations and improve the signal quality. The Stochastic indicator is calculated with customizable parameters for %K length, %K smoothing, and %D smoothing. The smoothed ROC and Stochastic values are then averaged using the formula ((roc + d) / 2) to create the blended oscillator. MA smoothing is applied to the combined oscillator aiming to further reduce fluctuations and enhance trend visibility. Traders are free to choose their own preferred MA type from 'EMA', 'DEMA', 'TEMA', 'WMA', 'VWMA', 'SMA', 'SMMA', 'HMA', 'LSMA', and 'PEMA' (credit to: © traderharikrishna for this code: ).
Application:
The indicator's buy signals (represented by green "B" labels) indicate potential entry points for buying assets, suggesting a bullish trend. The white line visually represents the trend, helping traders identify and follow the upward momentum. Conversely, the sell signals (blue "S" labels) highlight possible exit points or opportunities for short selling, indicating a bearish trend. The blue line illustrates the bearish movement, aiding in the identification of downward momentum.
The "Smoothed ROC & Stochastic" indicator offers traders a comprehensive view of market trends by combining two powerful oscillators. By incorporating the ROC and Stochastic indicators into a single oscillator, it provides a more holistic perspective on the market's momentum. The use of a Kalman Filter for smoothing helps reduce noise and enhance the accuracy of the signals. Additionally, the indicator allows customization of the smoothing technique through various moving average types. Traders can also utilize the overbought and oversold zones for additional analysis, providing insights into potential market reversals or extreme price conditions. Please note that future performance of any trading strategy is fundamentally unknowable, and past results do not guarantee future performance.

Discrete Fourier Transformed Money Flow IndexThe Discrete Fourier Transform Money Flow Index indicator integrates the Money Flow Index (MFI) with Discrete Fourier Transform (credit to author wbburgin - May 26 2023 ) smoothing to offer a refined and smoothed depiction of the MFI's underlying trend. The MFI is calculated using the formula: MFI = 100 - (100 / (1 + MR)), where a high MFI value indicates robust buying pressure (signaling an overbought condition), and a low MFI value indicates substantial selling pressure (signaling an oversold condition).
Why is the DFT and MFI combined?
The aim of this combination between DFT and MFI is to effectively filter out short-term fluctuations and noise, enabling a clearer assessment of the overall trend. This smoothing process enhances the reliability of the MFI by emphasizing dominant and sustained buying or selling pressures. This script executes a full DFT but only uses filtering from one frequency component. The choice to focus on the magnitude at index 0 is significant as it captures the dominant or fundamental frequency in the data. By analyzing this primary cyclic behavior, we can identify recurring patterns and potential turning points more easily. This streamlined approach simplifies interpretation and enhances efficiency by reducing complexity associated with multiple frequency components. Overall, focusing on the dominant frequency and applying it to the MFI provides a concise and actionable assessment of the underlying data.
Note: The FMFI indicator provides both smoothed and non-smoothed versions of the MFI, with the option to toggle the original non-smoothed MFI on or off in the settings.
Application
FMFI functions as a trend-following indicator. Bullish trends are denoted by the color white, while bearish trends are represented by the color purple. Circles plotted on the FMFI indicate regular bull and bear signals. Additionally, red arrows indicate a strong negative trend, while green arrows indicate a strong positive trend. These arrows are calculated based on the presence of regular bull and bear signals within overbought and oversold zones. To enhance its effectiveness, it is recommended to combine this indicator with other complementary technical analysis tools and integrate it into a comprehensive trading strategy. Traders are encouraged to explore a wide range of settings and timeframes to align the indicator with their unique trading preferences and adapt it to the current market conditions. By doing so, traders can optimize the indicator's performance and increase their potential for successful trading outcomes.
Utility
Traders and investors can employ this indicator to enhance their trend-following strategies. The white-colored components of the FMFI can help identify potential buying zones, while the purple-colored components can assist in identifying potential selling points. The red and green arrows can be used to pinpoint moments of strong bull or bear momentum, allowing traders to position themselves advantageously in their trading activities. Please note that future performance of any trading strategy is fundamentally unknowable, and past results do not guarantee future performance.

ALMA Smoothed Gaussian Moving AverageThis indicator is an altered version of the Gaussian Moving Average (GMA) (Credit to author: © LeafAlgo ). The GMA applies weights to the prices, giving more importance to the values closer to the current period and gradually diminishing the significance of older prices. The ALMA Smoothed Gaussian Moving Average (ASGMA) applies an ALMA smoothing to its price data to minimize lag and provide a more accurate representation of the underlying trend by dynamically adapting to changing market conditions. The Arnaud Legoux Moving Average (ALMA) is a specialized smoothing technique that adjusts the weights of the moving average based on market volatility. Its calculation uses Wavelet Transform techniques which enables this type of smoothing to capture both high-frequency and low-frequency components of a signal or data. The rationale for this mashup between ALMA and Gaussian filtering is to smooth the moving average line over the smoothed price data and produce stronger trend signals.
ASGMA serves as a trend-following indicator, identifying both bullish and bearish trends. It provides buy and sell signals indicated by "B" and "S" labels plotted alongside the price data. Additionally, the ASGMA's Exponential Moving Average (EMA) line alternates between green and red, indicating bullish and bearish momentum, respectively.
The ASGMA also incorporates two popular momentum indicators, the Relative Strength Index (RSI) and the Chande Momentum Oscillator (CMO). The inclusion of these indicators aims to enhance trend identification and reversal signals. For a strong buy signal, all three indicators (RSI, CMO, and ASGMA) must indicate bullish conditions, resulting in a vertical green line. Conversely, a vertical red line is plotted when all indicators indicate bearish conditions, representing a strong sell signal.
The ASGMA, with its unique combination of smoothing techniques and indicator amalgamation, provides traders and investors with powerful analytical tools. It can be applied in trend-following strategies using the regular buy and sell signals generated by labels and the EMA line. Alternatively, the vertical lines offer stronger buy and sell signals. These features aid in identifying potential entry and exit points, thereby enhancing trading decisions and market analysis. However, it is important to remember that the future performance of any trading strategy is fundamentally unknowable, and past results do not guarantee future performance.

Moving Average-TREND POWER v2.0-(AS)HELLO:
-This indicator is a waaaay simpler version of my other script - Moving Average-TREND POWER v1.1-(AS).
HOW DOES IT WORK:
-Script counts number of bars below or above selected Moving Average (u can se them by turning PLOT BARS on). Then multiplies number of bars by 0.01 and adds previous value. So in the uptrend indicator will be growing faster with every bar when price is above MA. When MA crosess price Value goes to zero so it shows when the market is ranging.
If Cross happens when number of bars is higher than Upper threshold or below Lower threshold indicator will go back to zero only if MA crosses with high in UPtrend and low in DNtrend. If cross happens inside THSs Value will be zero when MA crosses with any type of price source like for example (close,high,low,ohlc4,hl etc.....).This helps to get more crosess in side trend and less resets during a visible trend
HOW TO SET:
Just select what type of MA you want to use and Length. Then based on your preference set values of THSs'
OTHER INFORMATIONS:
-Script was created and tested on EURUSD 5M.
-For bigger trends choose slowerMAs and bigger periods and the other way around for short trends (FasterMAs/shorter periods)
-Below script code you can find not used formulas for calculating indicator value(thanks chat GPT), If you know some pinescript I encourage you to try try them or maybe bulid better ones. Script uses most basic one.
-Pls give me some feedback/ideas to improve and check out first version. Its way more complicated for no real reason but still worth to take a look'
-Also let me know if you find some logical errors in the code.
Enjoy and till we meet again.

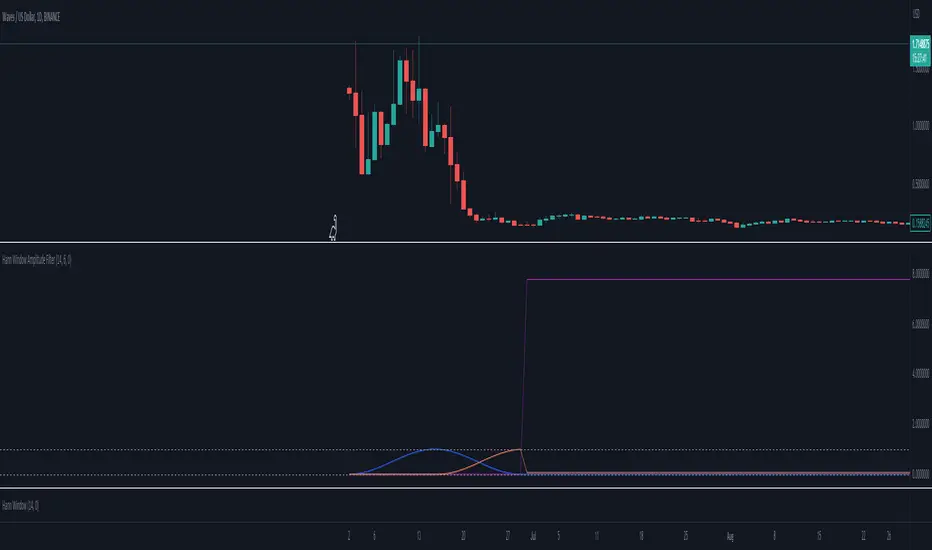
Hann Window Amplitude FilterThis script is designed to implement a multi-signal Hann filter, which is essentially a movable Hann window filter. The purpose of this filter is to allow users to select the periods or frequencies that best align with their trading strategy or market analysis.
The Hann window filter operates by enabling the selection of either lower or higher frequencies. The period of the window is twice the number of signals you wish to filter. As you shift the window by the number of your signals, the signal on one side will have an amplitude of 0, while the other side will have an amplitude of 1.
Continuing to shift the window will result in new values of 0. This feature is particularly useful for further filtering the frequencies or periods that you want to focus on for your trading decisions.
In summary, this script provides a flexible and customizable tool for filtering signals based on their frequency or period, which can be a valuable addition to any trader's technical analysis toolkit.
custom Bollinger bands with filters - indicator (AS)-----------Description-------------
This indicator is basically Bollinger bands with many ways to customize. It uses highest and lowest values of upper and lower band for exits. I think something is wrong with the script but cant find any mistakes – most probably smoothing. The ATR filter is implemented but is working incorrectly. In code you can also turn it into strategy but I do not recommend it for now as it is not ready yet.
So this is my first script and I am looking for any advice, ideas to improve this script, sets of parameters, markets to apply, logical mistakes in code or any ideas that you may have. Indicator was initially designed for EURUSD 5MIN but I would be interested in other ideas.
-----------SETTINGS--------------
---START - In starting settings we can choose
Line 1: what parts to use BB/DC/ATR
Line 2: what parts to plot on chart
Line 3 Whether or not apply smoothing to BB or ATR filter
Line 4 Calculate deviation for BB from price or Moving average
Line 5 Fill colors and plot other parts for debug (overlay=false)
Line 6:( for strategy) – enable Long/Short Trades
---BB and DC – here we modify Bollinger bands and Donchian
Line 1: Length and type of BB middle line and also length of DC from BB
Line 2: Length and type of BB standard deviation and multiplier
Line 3: Length and type of BB smoothing and %width for BB filter
---ATR filter – (not ready fully yet)
Line 1: type and length of ATR
Line 2: threshold and smoothing value of ATR
---DATE and SESSION
Line 1: apply custom date or session?
Line 2: session hours settings
Line 3:Custom starting date
Line 4: Custom Ending date
-----------HOW TO USE--------------
We open Long if BB width is bigger than threshold and close when upper band is no longer highest in the period set. Exact opposite with Short

Range Filter x Hull SuiteRange Filter x Hull Suite
This indicator is a hybrid of two popular indicators, with a twist; namely the Range Filter (Guikroth version) and the Hull Suite (by Insilico) .
Originally developed as a 1 minute trend following strategy and traded during the New York Session for it's typically high volume / likely trending nature, it provides entry signals based on the following logic:
For bullish entry signals:
The first bullish* candle (*defined by the Range Filter bar color logic, blue by default - which is not necessarily technically a bullish candle as defined by the OHLC values) which appears after the consolidation candles (also defined by the Range Filter bar color logic, orange by default), and where the Hull Suite moving average is also bullish.
For bearish entry signals:
The first bearish* candle (*defined by the Range Filter bar color logic, red by default - which is not necessarily technically a bearish candle as defined by the OHLC values) which appears after the consolidation candles (also defined by the Range Filter bar color logic, orange by default), and where the Hull Suite moving average is also bearish.
The indicator aims to filter out signals where possible consolidation is occurring and comes with styling options and alternative filter options such as a triple moving average trend detection method. Signals can also be filtered by a specific trading session. Standard options for the Range Filter and Hull Suite settings are also able to be customised within the settings menu.
Alerts
Various alerts are built-in, including the custom entry signals unique to this strategy.
Note : The above features listed above are accurate at the time of publishing, but may be altered in future.
Many thanks to guikroth & Insilico for sharing their open source indicators, and also to the original developer of the strategy itself for sharing it.

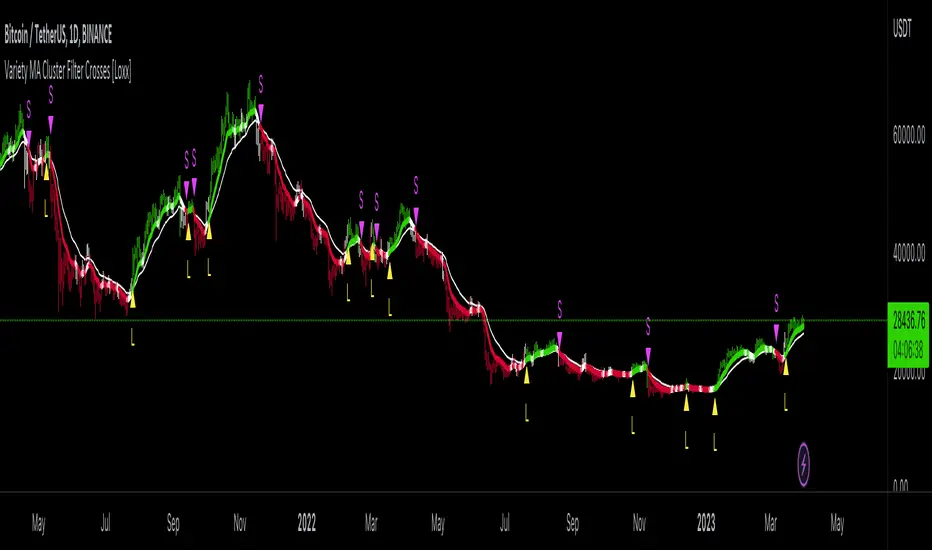
Variety MA Cluster Filter Crosses [Loxx]What is a Cluster Filter?
One of the approaches to determining a useful signal (trend) in stream data. Small filtering (smoothing) tests applied to market quotes demonstrate the potential for creating non-lagging digital filters (indicators) that are not redrawn on the last bars.
Standard Approach
This approach is based on classical time series smoothing methods. There are lots of articles devoted to this subject both on this and other websites. The results are also classical:
1. The changes in trends are displayed with latency;
2. Better indicator (digital filter) response achieved at the expense of smoothing quality decrease;
3. Attempts to implement non-lagging indicators lead to redrawing on the last samples (bars).
And whereas traders have learned to cope with these things using persistence of economic processes and other tricks, this would be unacceptable in evaluating real-time experimental data, e.g. when testing aerostructures.
The Main Problem
It is a known fact that the majority of trading systems stop performing with the course of time, and that the indicators are only indicative over certain intervals. This can easily be explained: market quotes are not stationary. The definition of a stationary process is available in Wikipedia:
A stationary process is a stochastic process whose joint probability distribution does not change when shifted in time.
Judging by this definition, methods of analysis of stationary time series are not applicable in technical analysis. And this is understandable. A skillful market-maker entering the market will mess up all the calculations we may have made prior to that with regard to parameters of a known series of market quotes.
Even though this seems obvious, a lot of indicators are based on the theory of stationary time series analysis. Examples of such indicators are moving averages and their modifications. However, there are some attempts to create adaptive indicators. They are supposed to take into account non-stationarity of market quotes to some extent, yet they do not seem to work wonders. The attempts to "punish" the market-maker using the currently known methods of analysis of non-stationary series (wavelets, empirical modes and others) are not successful either. It looks like a certain key factor is constantly being ignored or unidentified.
The main reason for this is that the methods used are not designed for working with stream data. All (or almost all) of them were developed for analysis of the already known or, speaking in terms of technical analysis, historical data. These methods are convenient, e.g., in geophysics: you feel the earthquake, get a seismogram and then analyze it for few months. In other words, these methods are appropriate where uncertainties arising at the ends of a time series in the course of filtering affect the end result.
When analyzing experimental stream data or market quotes, we are focused on the most recent data received, rather than history. These are data that cannot be dealt with using classical algorithms.
Cluster Filter
Cluster filter is a set of digital filters approximating the initial sequence. Cluster filters should not be confused with cluster indicators.
Cluster filters are convenient when analyzing non-stationary time series in real time, in other words, stream data. It means that these filters are of principal interest not for smoothing the already known time series values, but for getting the most probable smoothed values of the new data received in real time.
Unlike various decomposition methods or simply filters of desired frequency, cluster filters create a composition or a fan of probable values of initial series which are further analyzed for approximation of the initial sequence. The input sequence acts more as a reference than the target of the analysis. The main analysis concerns values calculated by a set of filters after processing the data received.
In the general case, every filter included in the cluster has its own individual characteristics and is not related to others in any way. These filters are sometimes customized for the analysis of a stationary time series of their own which describes individual properties of the initial non-stationary time series. In the simplest case, if the initial non-stationary series changes its parameters, the filters "switch" over. Thus, a cluster filter tracks real time changes in characteristics.
Cluster Filter Design Procedure
Any cluster filter can be designed in three steps:
1. The first step is usually the most difficult one but this is where probabilistic models of stream data received are formed. The number of these models can be arbitrary large. They are not always related to physical processes that affect the approximable data. The more precisely models describe the approximable sequence, the higher the probability to get a non-lagging cluster filter.
2. At the second step, one or more digital filters are created for each model. The most general condition for joining filters together in a cluster is that they belong to the models describing the approximable sequence.
3. So, we can have one or more filters in a cluster. Consequently, with each new sample we have the sample value and one or more filter values. Thus, with each sample we have a vector or artificial noise made up of several (minimum two) values. All we need to do now is to select the most appropriate value.
An Example of a Simple Cluster Filter
For illustration, we will implement a simple cluster filter corresponding to the above diagram, using market quotes as input sequence. You can simply use closing prices of any time frame.
1. Model description. We will proceed on the assumption that:
The aproximate sequence is non-stationary, i.e. its characteristics tend to change with the course of time.
The closing price of a bar is not the actual bar price. In other words, the registered closing price of a bar is one of the noise movements, like other price movements on that bar.
The actual price or the actual value of the approximable sequence is between the closing price of the current bar and the closing price of the previous bar.
The approximable sequence tends to maintain its direction. That is, if it was growing on the previous bar, it will tend to keep on growing on the current bar.
2. Selecting digital filters. For the sake of simplicity, we take two filters:
The first filter will be a variety filter calculated based on the last closing prices using the slow period. I believe this fits well in the third assumption we specified for our model.
Since we have a non-stationary filter, we will try to also use an additional filter that will hopefully facilitate to identify changes in characteristics of the time series. I've chosen a variety filter using the fast period.
3. Selecting the appropriate value for the cluster filter.
So, with each new sample we will have the sample value (closing price), as well as the value of MA and fast filter. The closing price will be ignored according to the second assumption specified for our model. Further, we select the МА or ЕМА value based on the last assumption, i.e. maintaining trend direction:
For an uptrend, i.e. CF(i-1)>CF(i-2), we select one of the following four variants:
if CF(i-1)fastfilter(i), then CF(i)=slowfilter(i);
if CF(i-1)>slowfilter(i) and CF(i-1)slowfilter(i) and CF(i-1)>fastfilter(i), then CF(i)=MAX(slowfilter(i),fastfilter(i)).
For a downtrend, i.e. CF(i-1)slowfilter(i) and CF(i-1)>fastfilter(i), then CF(i)=MAX(slowfilter(i),fastfilter(i));
if CF(i-1)>slowfilter(i) and CF(i-1)fastfilter(i), then CF(i)=fastfilter(i);
if CF(i-1)
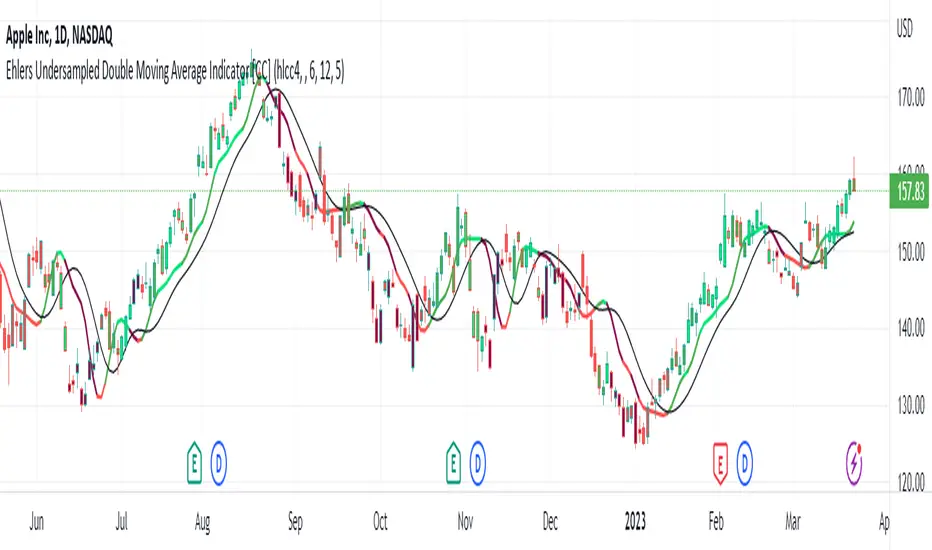
Ehlers Undersampled Double Moving Average Indicator [CC]The Undersampled Double Moving Average was created by John Ehlers (Stocks and Commodities April 2023), and this is a double moving average system which is pretty rare for John Ehlers. For those of you who would like my other take on an Ehlers double moving average, be sure to check out my previous Ehlers double moving average script . He came up with a unique idea for this indicator to create a moving average using a sample of the price data. For example, we use his suggested length of 5 only to use the price data every 5 bars. Feel free to change this, and please let me know if you find a length that works better. He then smooths the indicator using the Hann Windowed Moving Average . I color-coded the lines to show stronger signals in darker colors or standard signals in lighter colors. Buy when the line turns green and sell when it turns red.
Let me know if there is an indicator or script you would like to see me publish!
How To Limit Repeating SignalsAn example of how to limit the input number of allowed signals using a function containing a condition counter with a reset.

Generalized Smooth StepHello, folks. Sorry for not posting anything for a long time, just busy with my university studies for the moment.
Quick script for today — Smooth Step.
You can search for it in Wikipedia, but saying shortly and informatively, this is just an advanced type of oscillator, used as momentum indicator.
In the codes across the Internet everybody uses the 3rd order equation, BUT I found it kinda boring to use indicator this simple, so I made an option to choose the order of the equation in the settings — parameter "Order of the equation". This why it is called generalized smooth step, as it makes possible to use equation of virtually any order.
It is limited to 18 because very strange behaviour that you get after passing 18th order (it jsut becomes not tradeable any longer).
As I've mentioned above, it is an advanced version of classical oscillator, used as momentum indicator .
How to use it?
If smooth step is above 50, then the price momentum is bullish;
If smooth step is below 50, then the price momentum is bearish.
As simple as it is, it becomes useful enough on the higher timeframes (>=1H), so feel free to play with it and find optimal settings for yourself.
Hints
Try perform different smoothing and leading methods (developed by Ehler) to get better results;
You can use smooth step as confirmation/filter for trend-following trades.
Hope you will find it valueable.
Take your profits!
- Tarasenko Fyodor
RU:
Привет, ребята. Извините, что долго ничего не выкладывал, просто сейчас занят учебой в университете.
Быстрый скрипт на сегодня — Smooth Step.
Вы можете поискать его теоретическое обоснование в Википедии, но если говорить кратко и информативно, то это совершенствованный тип классического осциллятора, используемый в качестве моментум-индикатора .
В кодах в интернете все используют уравнение 3-го порядка, НО Мне было скучно пользоваться таким простым индикатором, поэтому я сделал возможность выбирать порядок уравнения в настройках — параметр " Порядок уравнения». Поэтому он называется обобщеннымsmooth step, так как позволяет использовать уравнение практически любого порядка.
Я ограничил порядок уравнения 18 , потому что индикатор показывает начинается очень странное поведение, когда вы делаете порядок больше 18 (индикатор просто начинается вести семя хаотично, что ли).
Как я уже упоминал выше, это усовершенствованная версия классического осциллятора, используемого в качестве моментум-индикатора .
Как им пользоваться?
Если smooth step выше 50, то импульс цены бычий;
Если smooth steз\p ниже 50, то импульс цены медвежий.
Хоть это и очень простой индикатор, он может оказаться достаточно полезным на старших таймфреймах (>=1H), так что не стесняйтесь играть с ним и находить оптимальные настройки для себя.
Советы
Попробуйте использовать различные методы сглаживания и лидирования (разработан Джоном Элером (John Ehler)), чтобы получить лучшие результаты;
Вы можете использовать smooth step в качестве подтверждения/фильтра для сделок, следующих за трендом.
Надеюсь, этот скрипт будет вам полезен.
Получите прибыль!
- Тарасенко Фёдор

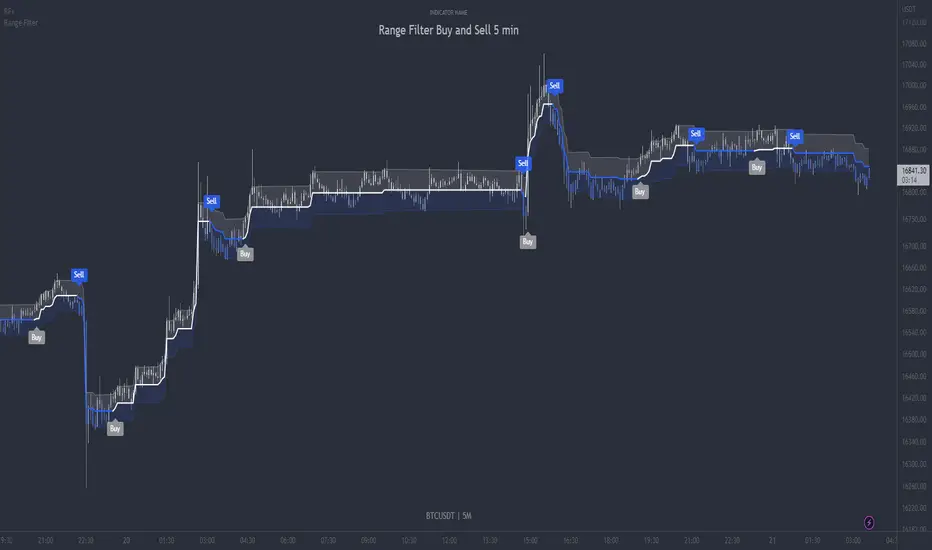
Range Filter Buy and Sell 5min - guikroth versionRange Filter Buy and Sell 5min - the @guikroth version, republished.
Since this popular version of the Range Filter is no longer available via the original author, I republish it here under the same name.
This version remains true to the guikroth version from the calculations to the default settings and comments in the code, with the exception of an update to the latest version of PineScript, minor styling adjustments and the addition of an all-in-one 'buy or sell' alert option.
The guikroth version was a simplified modification of the original Range Filter by @DonovanWall .
Including having just 3 bar colours based on the filtered price trend, different source input options to the original, and the addition of buy and sell signals and alerts based upon the Range Filter colour change. It consisted of just three inputs; source, sampling period, and range multipler. With the update to version 5, external indicators can also be used as inputs, for example using a VWAP or EMA loaded on your chart as the input on the Range Filter is now also possible.
What is the Range Filter?
As the author of the original Range Filter describes it:
"This is an experimental study designed to filter out minor price action for a clearer view of trends. Inspired by the QQE's volatility filter, this filter applies the process directly to price rather than to a smoothed RSI .
First, a smooth average price range is calculated for the basis of the filter and multiplied by a specified amount.
Next, the filter is calculated by gating price movements that do not exceed the specified range.
Lastly the target ranges are plotted to display the prices that will trigger filter movement.
Custom bar colors are included. The color scheme is based on the filtered price trend."
Popularity of the Range Filter
The Range Filter is a very popular and effective indicator in its own right, with adjustments to the few simple settings it is possible to use the Range Filter for helping filter price movement, whether helping to determine trend direction or ranges, to timing breakout or even reversal entries. Its practical versatility makes it ideal for integrating it's signals into a variety of trading strategies or even other indicators.
With many thanks to the authors of the previous and original versions; @guikroth and @DonovanWall .
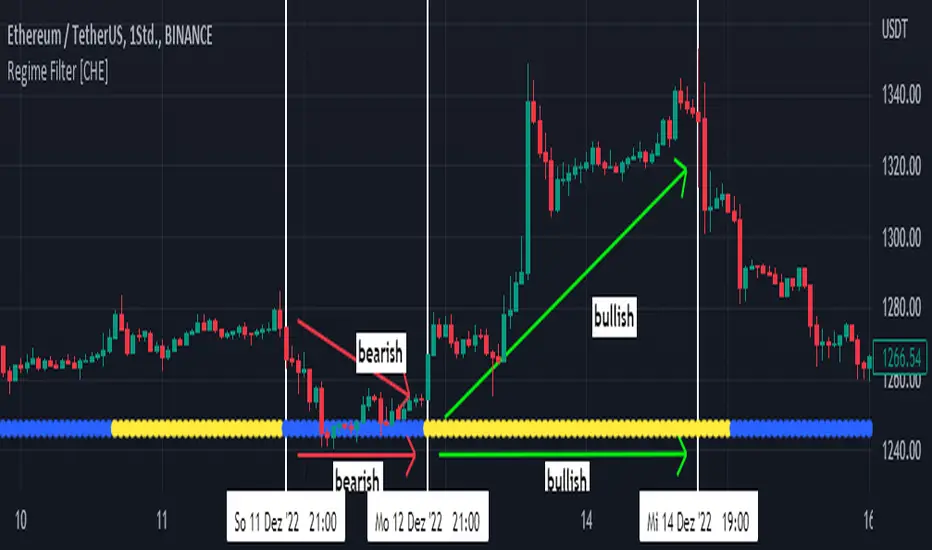
Regime Filter [CHE]About:
A market regime filter is a tool used by traders and investors to identify the current state or "regime" of the market and adjust their investment strategies accordingly. This can involve identifying trends in market behavior, such as bullish or bearish trends, and using that information to make decisions about which assets to buy or sell.
Market regime filters can be based on a variety of factors, including economic indicators, market sentiment, and technical analysis. They are often used in conjunction with other trading strategies and can help traders and investors manage risk and optimize their returns.
It's important to note that market regime filters are not always accurate and can change over time, so it's important for traders and investors to regularly review and update their filters to ensure that they are relevant and effective.
Understanding the use of a regime filter in trading:
The importance of a trading filter cannot be overemphasized. As a matter of fact, the chances of any trading system making consistent returns over the long term depends on it trading in the right market environment — buying when the market is bullish and selling when the market is bearish. Some traders may want to stay out of the market when the conditions are unfavorable.
The heard of this Regime Filter is the well kown Andean Oscillator. The proposed indicator aims to measure the degree of variations of individual up-trends and down-trends in the price, thus allowing to highlight the direction and amplitude of a current trend.
Settings
Length : Determines the significance of the trends degree of variations measured by the indicator.
Signal Length : Moving average period of the signal line.
The regime filter uses the color yellow and blue, yellow stands for bullish and blue for bearish.
In daily use I have found that it makes sense to use it in different timeframes to identify meaningful trends.
best regards and I hope you enjoy this new indicator
Chervolino
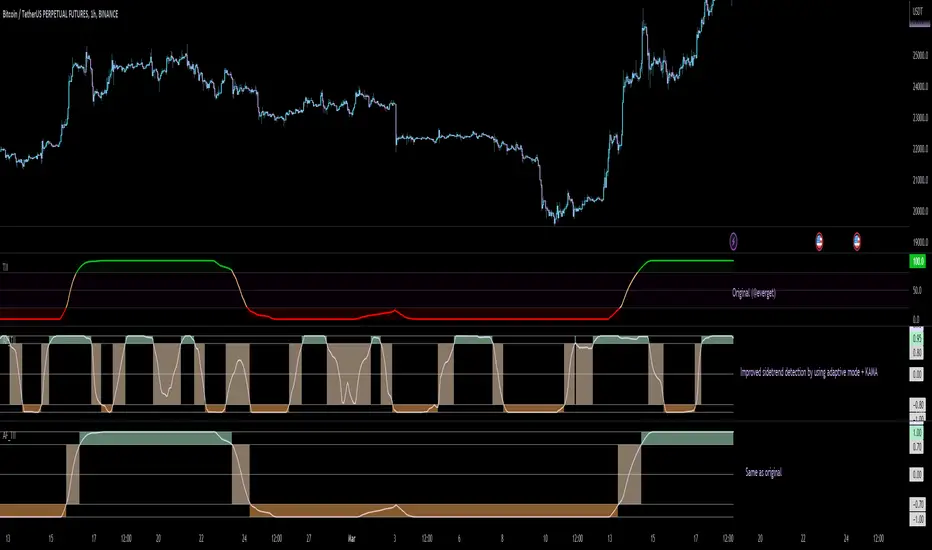
Adaptive Fisherized Trend Intensity Index Introduction
Here, I modified the script "Trend Intensity Index" (TII) of @everyget.
TTI was developed by M.H. Pee, who also published other trend analysis indicators like the Trend Trigger/Continuation Factor
It helps to determine how strong the current trend is.
The stronger the trend, the higher the chance the price may continue moving in the current direction.
Features
Adaptive mode (based on Ehlers dominant cycle determination) => automatically determines the length
Inverse Fisher Transform => gives sharper signals
Customizable MA Types => discover the impact of different ma bases
Hann Window and NET smoothing => state-of-the-art smoothing
Trend Visualization => shows you the up/down/side trend
Usage
This indicator here offers a perfect trend filtering system. It is capable of up/down/side trend detection.
There are a lot of trend indicators which don't respect sidetrends, which makes this indicator pretty useful.
A lot of traders use trend-following trading systems.
A trader will usually make his/her entry in the market during a strong trend and ride it, until the TII provides an indication of a reversal.
For mean-revertive trading systems, you could use TII to just trade in side trend.
A lot of mean-revertive signal emitters like Bollinger Bands or RSI work most of the times better in side trend.
Furthermore, every timeframe could be used, but higher timeframes have more impact because trends are stronger there.
Signals
Green zone (Top) => Etablished bullish trend
"Peachy" Zone (Middle) => Sidetrend/flat market
Red Zone (Bottom) => Etablished bearish trend
Enjoy guys!
(Let me know your opinions!)
--
Credits to:
@blackcat1402
@DasanC
@cheatcountry
@everget
Heiken Ashi Swing Range FilterIt uses heiken-ashi candles to find swing highs and lows, then check if candles are inside the range of them. This way you can filter out ranging market.
It may be better to use it in higher timeframe than current.
Change of VolatilityOVERVIEW
The Change of Volatility indicator is a technical indicator that gauges the amount of volatility currently present in the market. The purpose of this indicator is to filter out with-trend signals during ranging/non-trending/consolidating conditions.
CONCEPTS
This indicator assists traders in capitalizing on the assumption that trends are more likely to start during periods of high volatility compared to periods of low volatility . This is because high volatility indicates that there are bigger players currently in the market, which is necessary to begin a sustained trending move.
So, to determine whether the current volatility in the market is low, the indicator will grey out all the areas on the chart whose short term standard deviation of volatility is lower than the long term standard deviation of volatility.
If the short term standard deviation of volatility is above the long term standard deviation of volatility, the current volatility in the market is considered high. This would the ideal time to enter a trending trade due to the assumption that trends are more likely to start during these high-volatility periods.
HOW DO I READ THIS INDICATOR
When the histogram is grey, don't take any trend trades since the current volatility is less than the usual volatility experienced in the market.
When the histogram is green, take all valid with-trend trades since the current volatility is greater than the usual volatility experienced in the market.

Q-TrendQ-Trend is an multipurpose indicatorm that can be used for swing- and trend-trading equally on any timeframe (non-volatile markets are better for this thing).
Settings:
Trend period - used to calculate trend line in the special moments(will explain below);
ATR Multiplier - changes sensitivity. The higher the multiplier = the more sensitive it is.
Also option to smooth source data (helps get cleaner signals, as always).
How to use?
Signals are given on the chart. Also ou can use trend line as S/R line.
The idea behind:
Terms:
SRС = Source
TL = trend line;
MP = ATR multiplier;
ATR = ATR :)
TL = (highest of source P-bars back + lowest of source P-bars back) / 2
Epsilon = MP * ATR
I was thinking for a week about combining volatility and relation between highest and lowest price point. That why I called indicator Q-Trend = Quantitative Trend , as I was trying to think about price in a mathematical way.
Okay, time to go philosophical:
1) TL is shows good price trend, but as it is slow enough and not enough informative, we need add additional conditions to produce signals.
2) Okay, so what can we add as conditions? We need to take volatility into account, as it is crucial in the moments of market uncertainty. So let's use ATR (Average True Range) somehow. My idea is that if SRC breaks TL + ATR , then it means that there will be upmove and we update our TL . Analogically for SRC breaking TL - ATR (breaks are crosses of TL +- ATR lines) .
Conclusion:
- if SRC breaks TL + ATR , it is a BUY signal and update of trend line;
- if SRC breaks TL - ATR , it is a SELL signal and update of trend line;
I think that such indicator already exisits on TradingView, as I've already saw something similar, but long ago, so please don't report, if such thing already exists.
But if not, then I hope, that you will gain some profits with Q-Trend :)
I will continue my work on this thing, so stay tuned.
Trade with your own risks and have your profits!
Wish you all the best!
- Tarasenko Fyodor

RF+ Replay for Heikin AshiRF+ Replay for Heikin Ashi
RF+ Replay for Heikin Ashi generates fully customisable Heikin Ashi candlesticks presented on a standard chart, enabling traders to utilise the Tradingview Replay feature with Heikin Ashi candlesticks when analysing and backtesting HA style strategies.
The features of this indicator include:
- Fully customisable Heikin Ashi Candles, including custom colour options for candle bodies, borders and wicks.
- Optional real-time, real-price close dots painted onto each candlestick.
- A optional set of 2 x Range Filters designed to indicate short term trend identification upon color change, ideal for low timeframe scalping.
- A optional set of 3 x fully customisable Moving Averages.
- An option to enable Heikin Ashi calculated data for the Range Filters and Moving Averages, so they present as they would on a Heikin Ashi non-standard chart type, without having to use an actual Heikin Ashi chart. Enabled by default.
- An optional sessions indicator, to highlight your prefered trading session for the purpose of backtesting.
- An optional watermark featuring customisable text and well as symbol and timeframe information, as seen in the screenshot of this indicator.
Instructions for use:
1) Because this indicator generates candlesticks and presents them onto your chart, you will need to hide the existing candlesticks so you do not see two sets of candles. You can do this by going into your Tradingview chart settings and making the candle bodies, borders and wicks fully transparent. You can then save this as a layout template. You can access your Chart Settings by clicking on the cog icon, or by right clicking on the chart itself and selecting 'Chart Settings' from the list.
2) Ensure you have the standard chart type selected - you do not need to select a Heikin Ashi type chart.
3) You will now be able to analyise and even backtest your Heikin Ashi style strategies including the use of the Tradingview Replay feature found at the top of the chart.
Heikin Ashi means 'average bar' in Japanese, which speaks to the fact that Heikin Ashi candles are calculated differently to standard Japanese candlesticks. The general idea of Heikin Ashi candles is to 'smooth' the appearance of price movement, by the use of averages within their calculation. It is important to understand that the Open and Close values of a Heikin Ashi candlestick do not reflect real Open and Close prices. You can use the real price dots feature to clearly see the real time and real price Close of each candle.
The formula for calculating a Heikin Ashi candlestick is as follows:
High = Maximum of High, Open, or Close (whichever is highest)
Low = Minimum of Low, Open, or Close (whichever is lowest)
Open = Open (previous bar) + Close (previous bar) /2
Close = (Open + High + Low + Close) / 4
If you found this useful, be sure to leave a like, comment and subscribe to show your support.
Until next time.

Keltner Channel Volatility FilterOVERVIEW
The Keltner Channel Volatility Filter indicator is a technical indicator that gauges the amount of volatility currently present in the market. The purpose of this indicator is to filter out with-trend signals during ranging/non-trending/consolidating conditions.
CONCEPTS
This indicator assists traders in capitalizing on the assumption that trends are more likely to start during periods of high volatility compared to periods of low volatility . This is because high volatility indicates that there are bigger players currently in the market, which is necessary to begin a sustained trending move.
So, to determine whether the current volatility in the market is low, the KCVF will grey out all bars whose average price is within the Keltner Channels.
If the average price breaks out of the Keltner Channels , it is reasonable to assume we are in a high-volatility period. Thus, this is the ideal time to enter a trending trade due to the assumption that trends are more likely to start during these high-volatility periods.
HOW DO I READ THIS INDICATOR
When the candles are greyed out, don't take any trend trades since the current volatility is less than the usual volatility experienced in the market.
When the candles aren't greyed out, take all valid with-trend trades since the current volatility is greater than the usual volatility experienced in the market.
