Miela Labs | John Dee's Watchtower [257-463]Bridging the gap between 16th-century esoteric mathematics and modern algorithmic trading.
The Enochian Watchtower is not merely a trend indicator; it is a computational artifact developed by Miela Labs LLC. This script translates Dr. John Dee’s "Great Table of the Watchtowers" and the "Sigil Dei Aemeth" into actionable financial data points.
Using our proprietary Occultator V2.0 Engine, we have derived specific mathematical constants that resonate with the current market structure.
🏛️ The Algorithmic Logic
This indicator utilizes three sacred numbers to construct a "Future Vision" of the market:
1. The Axis Mundi (Vector 257): derived from Fermat Primes and John Dee’s Grid coordinates. This Weighted Moving Average (WMA) acts as the spinal cord of the trend.
2. The Gates (Cipher 463): A prime number derived from the "Galethog" cipher stride. These bands define the absolute volatility limits (Heaven & Earth Gates).
3. Future Vision (Offset 21): Utilizing Fibonacci time sequences, the indicator projects Support and Resistance levels 21 bars into the future, allowing traders to anticipate market movements before they occur.
⚡ How to Use
• The Trend: If price is above the Purple Axis (257), the market is in a bullish phase.
• The Entry: Look for "L" (Long) and "S" (Short) signals. These are confirmed when the signal path crosses the Axis.
• The Future: Watch the projected lines on the right side of the chart to identify upcoming resistance zones.
About Miela Labs
Miela Labs is a Technomancy Research Institute based in McKinney, Texas. We specialize in building open-source esoteric trading tools and the Magic Programming Language (MPL).
🌐 Official Hub: Visit Miela Labs
💻 Source Code & Research: GitHub Repository
Disclaimer: This tool is for educational and research purposes only. It demonstrates the application of esoteric mathematics in financial analysis. Trade responsibly.
Fibonaccianalysis

Multi-Entry Fibonacci CalculatorMulti-Entry Fibonacci Calculator
This tool is a comprehensive trade calculator designed for discretionary traders who plan to scale into positions. It automates the complex task of position sizing across up to three separate entries while ensuring your total risk exposure remains fixed. By inputting your desired entry, stop loss, and initial profit target levels, the script calculates the precise quantity for each entry and provides a dynamic, real-time view of your trade's vitals.
The primary goal of this script is to allow for disciplined risk management in multi-entry trade plans. Whether you are averaging into a position or adding on pullbacks, this tool ensures your total predefined risk is never exceeded, even if all entries are filled.
Key Features
Multi-Entry Position Sizing: Automatically calculates the share/contract size for up to three entries based on their distance from the stop loss and user-defined weights.
Fixed Risk Management: Define your total risk as a percentage of your account. The script ensures that a full stop-out across all filled entries will result in a loss equal to this predefined amount.
Dynamic Take Profit: The take-profit level automatically adjusts based on your current average entry price to preserve the original target profit amount in dollars.
Real-Time Info Panel: A customizable on-chart panel displays all critical trade data, including current quantity, average price, projected P&L, and trade status.
Visual Trade Plan: Plots all your defined price levels (entries, stop loss, take profit) directly on the chart with informative labels.
Trade State Tracking & Alerts: The script monitors the price and will trigger alerts when entries are hit, or when the stop loss or take profit levels are reached.
How to Use
Configure Account & Risk: In the settings, enter your "Account Size" and the "Risk per Trade (%)" you are willing to take on the entire position.
Set Trade Direction: Choose either "LONG" or "SHORT".
Input Price Levels: Manually enter the prices for your entries (Entry 1, 2, 3), your "Stop Loss Price," and an "Initial TP Reference." The initial TP is used to calculate the target profit in dollars.
Distribute Position Weight: Assign weights to each entry (e.g., 50% for Entry 1, 30% for Entry 2, 20% for Entry 3). The total should sum to 100.
Monitor the Trade: Use the info panel and on-chart visuals to track the trade's progress. The script will show your average price as entries are filled and update the dynamic take-profit level accordingly.
Understanding the Calculations
Weighted Position Sizing: The script calculates sizes for each entry so that if all entries are filled and the stop loss is hit, your total loss will equal your predefined risk amount. It intelligently allocates size based on the distance of each entry from the stop loss and the weight you assign to it.
Dynamic Take Profit: The "Initial TP Reference" is used only to calculate a target profit in dollars based on your first entry's size. The script then calculates a dynamic TP line on your chart. This line adjusts based on your average entry price as positions are filled, ensuring that if price reaches this level, you will realize your original target dollar profit, regardless of how many entries were filled.
On-Chart Elements
Price Lines: Blue lines for entries, a red line for the stop loss, and a green line for the dynamic take profit.
Labels: Display the calculated quantity for each entry, the total risk amount at the stop loss, and the target profit amount at the take profit.
Average Price: Yellow circles plot your live average entry price as the position is built.
Info Panel: A comprehensive table showing live trade status, current quantity, average price, and projected profit/loss. The panel changes color to green on a TP hit and red on an SL hit.

Fibonacci Momentum CascadeThe Foundation: FMC Indicator:
The Fibonacci Momentum Cascade (FMC) is an AI-enhanced technical indicator that automates Fibonacci analysis, removing the guesswork and doubt that plagues manual drawing. Instead of relying on subjective human input, the FMC uses a proprietary Momentum Cascade Engine™ that constantly analyzes market strength to detect significant shifts in buying and selling pressure. When confirmed, it automatically identifies the most relevant market trend, cascades fresh Fibonacci levels, and grades potential technical setups. It features 100% automated swings, adaptive real-time analysis, and professional setup grading with Primary Setups (▲P / ▼P) for A+ formations and Secondary Setups (▲S / ▼S) for supplementary patterns.
The Adaptive Edge: AI Co-Pilot:
Our AI analyzes multiple data sources including market sentiment, technical patterns, fundamental factors, and news events to generate comprehensive market insights. It also fine-tunes the FMC indicator inputs for today's market, outputting personalized settings optimized for multiple timeframes (1d, 4h, 1h, 15m, 5m) — removing guesswork and maximizing precision for your asset.
The Force Multiplier: The Hub:
The Hub is our community intelligence platform where users share market analyses and insights. When you or others request AI analyses, they become available in The Hub for everyone to access without using credits. This creates a growing library of market insights across all asset classes. You can browse community analyses, discover trending assets, and benefit from the collective wisdom of experienced traders—essentially getting free analyses beyond your monthly credits.

Fibonacci Sequence Circles [BigBeluga]🔵 Overview
The Fibonacci Sequence Circles is a unique and visually intuitive indicator designed for the TradingView platform. It combines the principles of the Fibonacci sequence with geometric circles to help traders identify potential support and resistance levels, as well as price expansion zones. The indicator dynamically anchors to key price points, such as pivot highs, pivot lows, or timeframe changes (daily, weekly, monthly), and generates Fibonacci-based circles around these anchor points.
⚠️For proper indicators visualization use simple not logarithmic chart
🔵 Key Features
Customizable Anchor Points : The indicator can be anchored to Pivot Highs , Pivot Lows , or timeframe changes ( Daily, Weekly, Monthly ), making it adaptable to various trading strategies.
Fibonacci Sequence Logic : The circles are generated using the Fibonacci sequence, where the diameter of each circle is the sum of the diameters of the two preceding circles.
first = start_val
secon = start_val + int(start_val/2)
three = first + secon
four = secon + three
five = three + four
six = four + five
seven = five + six
eight = six + seven
nine = seven + eight
ten = eight + nine
Adjustable Start Value : Traders can modify the starting value of the sequence to scale the circles larger or smaller, ensuring they fit the current price action.
Color Customization : Each circle can be individually enabled or disabled, and its color can be customized for better visual clarity.
Visual Labels : The diameter of each circle (in bars) is displayed next to the circle, providing additional context for analysis.
🔵 Usage
Step 1: Set the Anchor Point - Choose the anchor type ( Pivot High, Pivot Low, Daily, Weekly, Monthly ) to define the center of the Fibonacci circles.
Step 2: Adjust the Start Value - Modify the starting value of the Fibonacci sequence to scale the circles according to the price action.
Step 3: Customize Circle Colors - Enable or disable specific circles and adjust their colors for better visualization.
Step 4: Analyze Price Action - Use the circles to identify potential support/resistance levels, price expansion zones, or trend continuation areas.
Step 5: Combine with Other Tools - Enhance your analysis by combining the indicator with other technical tools like trendlines, moving averages, or volume indicators.
The Fibonacci Sequence Circles is a powerful and flexible tool for traders who rely on Fibonacci principles and geometric patterns. Its ability to anchor to key price points and dynamically scale based on market conditions makes it suitable for various trading styles and timeframes. Whether you're a day trader or a long-term investor, this indicator can help you visualize and anticipate price movements with greater precision.

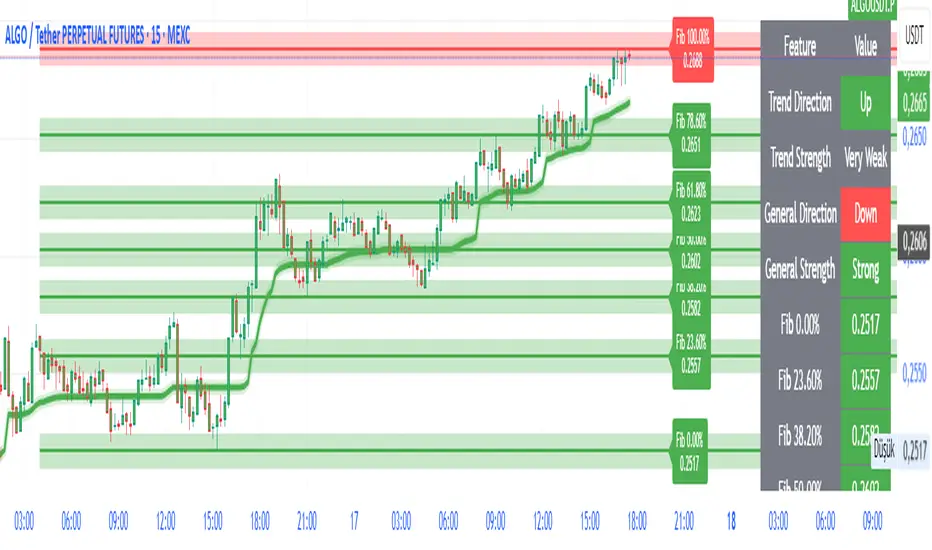
FibroTrend Matrix Premium [By TraderMan]📊 FibroTrend Matrix Premium
FibroTrend Matrix Premium is a powerful multi-timeframe trend and Fibonacci analysis tool. It combines trend direction, trend strength, and key Fibonacci levels into a single, clean interface with a dynamic table. Perfect for traders who want to see the market structure at a glance.
🧠 How It Works
Trend Detection 📈📉
Uses EMA-based dynamic bands to determine current trend direction.
Computes trend strength using slope of the trend line vs. price deviation.
Works on multiple timeframes (5m, 15m, 30m, 1h, 4h, 1D) for overall market context.
Fibonacci Levels & Zones 🔢
Automatically draws key Fibonacci retracement levels (0, 0.236, 0.382, 0.5, 0.618, 0.786, 1.0).
Adds zones around levels for potential support/resistance areas.
Labels are small and clear, lines slightly thicker for better visibility.
Trend Table Summary 📊
Shows current trend direction, strength, and general trend across multiple timeframes.
Fibonacci levels are included in the table with color-coded cells (green = bullish, red = bearish).
⚡ How to Use / Trading Logic
Identify Trend Direction
Uptrend (Green/“Up”) → look for buying opportunities.
Downtrend (Red/“Down”) → look for selling/shorting opportunities.
Neutral → wait or stay out.
Check Trend Strength
Very Strong / Strong (Green) → trend likely to continue.
Weak / Very Weak (Red) → trend may reverse or be choppy.
Use Fibonacci Levels for Entry & Exit
Enter near support zones in an uptrend.
Enter near resistance zones in a downtrend.
Use zone width & tolerance to set stop-loss or take-profit.
Multi-Timeframe Confirmation ✅
Ensure majority of timeframes confirm trend direction for stronger signal.
Example: if 5 out of 6 timeframes show Uptrend, trend is strong.
💡 Tips
Combine with volume, momentum, or RSI for extra confirmation.
Avoid trading solely on Fibonacci levels; use trend + strength table as main guide.
Works well for swing trading, intraday, and crypto markets.
🎯 Entry Example
Price is in an uptrend (green bars, line up).
Fibonacci retracement 0.382 aligns with support zone.
Trend strength = Strong or Very Strong.
Enter Long near zone, set stop-loss slightly below zone, take-profit near next Fibonacci level.
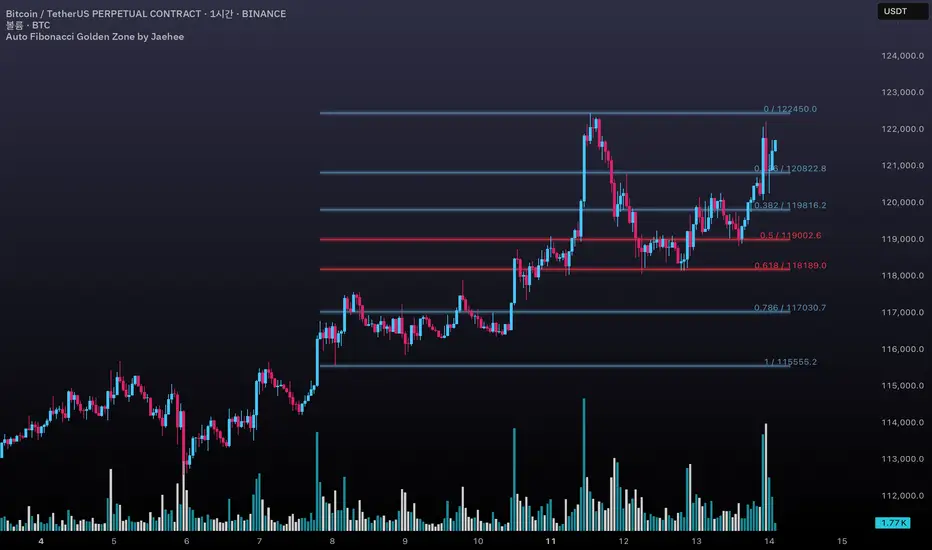
Auto Fibonacci Golden Zone by Jaehee📌 AUTO FIBONACCI GOLDEN ZONE — Auto Swing Detection with Key Level Highlights
WHAT THIS DOES
• Automatically detects the latest swing high and swing low within your chosen lookback range.
• Plots Fibonacci retracement levels: 1.000, 0.786, 0.618, 0.500, 0.382, 0.236, 0.000.
• Highlights 0.618 (“golden pocket”) and 0.500 as high-interest zones.
• Displays ratio + price labels to the right for quick reference without moving the cursor.
HOW IT WORKS
• Scans the last N bars (default 150) to locate the highest high and lowest low.
• Determines swing direction automatically: if the low forms first → up-leg, if the high forms first → down-leg.
• Calculates retracement prices and plots each level with a thin core line plus two glow layers (opacity adjustable).
• Clears and redraws lines and labels whenever a new swing is found — keeping the chart clean.
WHY THIS SETUP
• Saves time compared to manually anchoring Fib tools for each new swing.
• Highlights the golden pocket (0.618) and midpoint (0.500) — zones many traders watch for pullbacks or reactions.
• Positions labels to the right so they never overlap active candles.
HOW IT’S DIFFERENT FROM THE STANDARD FIB TOOL
• Automatic swing detection — no manual point selection.
• Built-in highlight logic for key levels.
• Clean redraw to prevent leftover lines or labels.
• Right-side label offset for readability in volatile price zones.
HOW TO READ IT (CONTEXT ONLY)
• In an up-leg, the 0.382–0.618 zone is often monitored for pullback reactions; 0.500 can act as a midpoint marker.
• In a down-leg, retracements into the 0.382–0.618 zone can be watched for selling pressure.
• Always confirm with structure, volume, and momentum tools — this indicator is not a standalone trade signal.
INPUTS
• Lookback Bars — swing detection range.
• Fib Line Color / Highlight Line Color — control standard vs. key level colors.
• Label Offset Bars — shift labels away from current price.
• Glow 1 & Glow 2 Opacity — adjust background glow visibility.
DESIGN NOTES
• Thin lines for precision, glow layers for visibility without overpowering candles.
• Overlay display — no extra panel needed.
• All elements clear and redraw automatically to avoid clutter.
LIMITATIONS & BEST PRACTICES
• Levels update whenever a new swing forms within the lookback range — historical lines are not fixed.
• Fib retracements are reference zones only, not guarantees of reversal.
• Best used with confluence factors like S/R flips, market structure, and volume analysis.
• No alerts, no performance claims — purely a market context tool.
DEFAULTS & SCOPE
• Works on all OHLCV instruments and timeframes.
• No repainting after swing confirmation.
AUTHOR’S NOTE FOR REVIEW
This is not a repackaged Fib tool. It combines automatic swing detection, golden pocket highlighting, and a clean redraw process to make retracement analysis faster and clearer. It provides context only, with no predictive or performance claims.
Dynamic Fib Zones [By TraderMan]📊 Dynamic Fib Zones — Indicator Overview
This indicator automatically plots dynamic Fibonacci levels and zones on your chart based on recent price action, volume, and trend direction. It helps you identify key support and resistance areas where price may react strongly.
🔍 What Does It Do?
Draws Fibonacci retracement levels dynamically over a specified lookback period.
Highlights zones around these Fibonacci levels to give you a price “buffer area” instead of just a line.
Colors the zones green or red based on volume strength and trend direction to signal potential buying or selling pressure.
Uses EMA (Exponential Moving Average) to detect if the trend is up or down.
Shows labels with Fibonacci % levels and exact price for quick reference.
⚙️ How to Use It?
Set your inputs:
Fibonacci Period: How many bars back the Fibonacci levels are calculated.
EMA Period: For trend detection.
Volume Multiplier: How much volume should exceed average to consider the signal strong.
Level Tolerance and Zone Width: Adjust the sensitivity and size of the price zones.
Interpret zones:
Green zones with high volume and price near Fibonacci level in an uptrend = potential buying area.
Red zones with high volume and price near Fibonacci level in a downtrend = potential selling area.
Gray zones = neutral, no strong signal.
Make your trading decisions:
Consider entering long positions near green zones with confirmation from other indicators or price action.
Consider entering short positions near red zones similarly.
Use zone boundaries as dynamic support/resistance for stop loss or take profit placement.
🚀 Tips for Position Opening
Combine with other confirmation tools (candlestick patterns, RSI, MACD, etc.) to avoid false signals.
Watch volume spikes carefully; strong volume near a Fibonacci zone increases the reliability.
Use the EMA trend filter to avoid trading against the main trend.
🎯 Summary
Dynamic Fib Zones give you a powerful, visual edge by combining Fibonacci, volume, and trend signals — making your entries and exits smarter and more precise!
Happy Trading! 📈✨

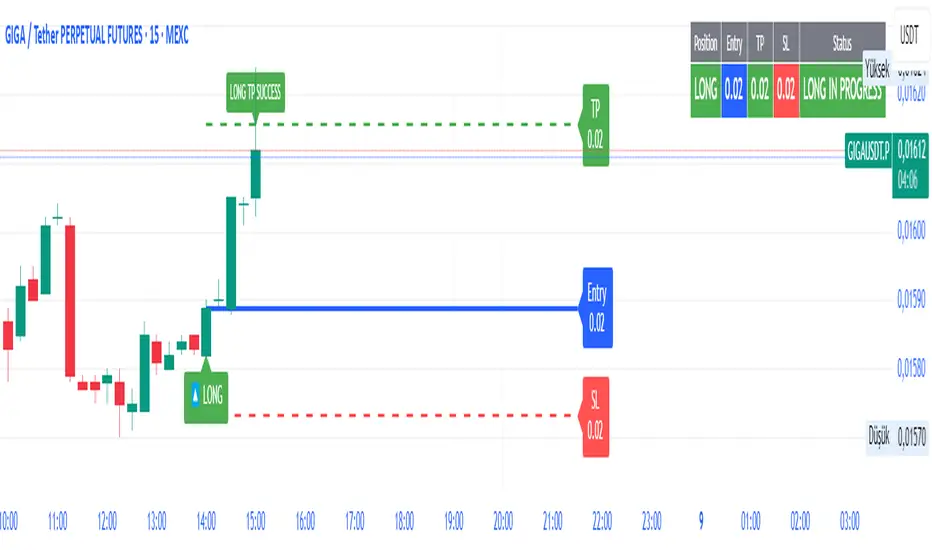
SmartFib Pro [By TraderMan]📊 SmartFib Pro — Smart Fibonacci Support & Resistance + TP/SL + Live Position Tracking
🚀 With SmartFib Pro , automatically track Fibonacci support and resistance levels on your chart!
This indicator dynamically shows long/short entry points, TP (Take Profit), and SL (Stop Loss) levels based on price movements, with easy-to-read lines. You can also monitor your position status live via a table at the top-right of your screen.
⚙️ How It Works?
📈 When price breaks key Fibonacci levels (especially 78.6% and 23.6%), the indicator automatically generates long or short signals.
Entry lines are drawn in blue, TP lines in green, and SL lines in red.
Entry, TP, and SL levels are displayed as labels next to the lines.
Active position lines and labels remain on the chart while the position is open, and past position lines are cleared automatically.
When TP or SL is hit, the indicator instantly notifies on the chart and in the table with “TP SUCCESSFUL” or “STOP HIT.”
🛠️ How to Use?
Add the indicator to your chart.
Adjust Fibonacci high and low lengths (default 50 bars) and line length (default 50 bars) from the inputs.
Long signals are generated when price breaks above the 78.6% level; short signals occur when price breaks below the 23.6% level.
TP is automatically set 3.5% away from the entry line, SL is set 1.5% away.
Follow the blue (entry), green (TP), and red (SL) lines and their labels on the chart.
Monitor your position info live in the top-right table.
When TP or SL triggers, position closes, and lines/labels are cleared for the next signal.
💡 Why SmartFib Pro?
✅ Automated position entry and exit strategy based on Fibonacci levels
✅ Live position tracking and status updates to help your trading decisions
✅ Clear, colorful, and minimalistic chart visuals eliminate clutter
✅ Ideal for both beginners and pros, providing fast and reliable signals
📣 Important Notes:
This indicator generates signals but always use proper risk management according to market conditions!
You can adjust TP/SL percentages to fit your own risk tolerance.
Always support signals with your own analysis.
💬 Catch the trend, manage your risk, and grow your profits with SmartFib Pro!
📈🔵🟢🔴
52SIGNAL RECIPE VWAP Quantum Matrix Pro═══52SIGNAL RECIPE VWAP Quantum Matrix Pro ═══
◆ Overview
52SIGNAL RECIPE VWAP Quantum Matrix Pro is an advanced technical indicator based on Volume Weighted Average Price (VWAP), integrating volatility-adjusted bands and Fibonacci levels to provide multi-dimensional analysis of price movements.
It automatically applies optimized lookback periods for different timeframes, providing customized analysis for various trading styles, and helps traders effectively identify critical support/resistance zones through precise price level identification.
─────────────────────────────────────
◆ Key Features
• **Adaptive VWAP Bands**: Automatically adjusting upper and lower bands based on market volatility
• **Fibonacci Integration**: Fibonacci levels (23.6%, 38.2%, 50%, 61.8%, 78.6%) extended around VWAP center
• **Timeframe Optimization**: Automatic lookback period adjustment for each chart cycle
• **Pivot Point Analysis**: Core support/resistance levels based on volume-weighted highs and lows
• **Precision Labeling**: Accurate numerical display for all major price levels
• **Visual Gradation**: Intuitive visualization through color gradation for each Fibonacci level
─────────────────────────────────────
◆ Technical Foundation
■ VWAP Calculation Principles
• **Volume Weighting**: Calculation of real equilibrium price considering volume rather than simple price averaging
• **Standard Deviation Bands**: Statistical fluctuation range setting around VWAP center
• **Volatility Adjustment Mechanism**: Dynamic band width adjustment using current ATR to historical ATR ratio
• **Precise Price Range**: Identification of highest/lowest price range within specified lookback period
■ Fibonacci Band Implementation
• **VWAP-Centered Extension**: Division of distance from centerline (VWAP) to standard deviation bands by Fibonacci ratios
• **Symmetrical Upper/Lower Structure**: Application of identical Fibonacci ratios in both upward and downward directions
• **Color Gradation**: Progressive color changes for each Fibonacci level providing visual depth
─────────────────────────────────────
◆ Practical Applications
■ Price Movement Interpretation
• **Central Reference Point**:
▶ VWAP serves as intraday/period equilibrium price providing balance point of buying/selling pressure
▶ Movement above/below VWAP can be interpreted as short-term bullish/bearish signals
• **Band Reaction Patterns**:
▶ Reaching outer bands (100%) signals overbought/oversold conditions
▶ Reaction patterns between Fibonacci levels provide basis for trend strength and persistence judgment
■ Trading Strategy Utilization
• **Range-bound Trading**:
▶ Short-term trading utilizing bounce patterns between Fibonacci levels
▶ Oscillation trading between centerline (VWAP) and Fibonacci levels
• **Trend Following Strategy**:
▶ Breakout of Fibonacci levels aligned above/below VWAP signals trend strengthening
▶ Strong momentum confirmation when re-entering after outer band breakout
─────────────────────────────────────
◆ Advanced Configuration Options
■ Input Parameter Guide
• **Base Standard Deviation** (Default: 2.0)
▶ 1.0-1.5: Narrow bands, suitable for short-term trading
▶ 1.8-2.2: Balanced bands, optimal for general market conditions
▶ 2.5-3.0: Wide bands, suitable for long-term positions
• **Maximum/Minimum Standard Deviation** (Default: 3.0/1.0)
▶ Maximum: Cryptocurrency (4.0), Stocks/Forex (3.0), Low volatility (2.5)
▶ Minimum: Intraday trading (0.8), General (1.0), Long-term (1.5)
• **Volatility Measurement Period** (Default: 20)
▶ Short-term (10-14): Fast response, intraday trading
▶ Medium-term (15-25): Balanced response, swing trading
▶ Long-term (30-50): Noise filtering, long-term investment
• **Use Volatility Adjustment** (Default: On)
▶ On: Automatic band width adjustment based on current market volatility (recommended)
▶ Off: Fixed standard deviation bands usage
■ Timeframe-Specific Optimal Settings
• **Intraday Trading** (15min-1hr): Base standard deviation 1.8, volatility period 14
• **Swing Trading** (4hr-daily): Base standard deviation 2.0, volatility period 20
• **Position Trading** (daily-weekly): Base standard deviation 2.5, volatility period 30
■ Market-Specific Optimal Settings
• **Stock Market**: Base standard deviation 2.0, volatility period 20
• **Forex Market**: Base standard deviation 1.8, volatility period 25
• **Cryptocurrency Market**: Base standard deviation 2.5, volatility period 14, maximum standard deviation 4.0
─────────────────────────────────────
◆ Synergy with Other Indicators
• **Moving Averages**: VWAP and major moving average crossovers strengthen trend reversal signals
• **RSI/Stochastic**: Combination of VWAP band reactions in overbought/oversold zones improves reversal signal accuracy
• **Bollinger Bands**: VWAP Quantum Matrix and Bollinger Band convergence/divergence patterns are useful for volatility change prediction
• **Fibonacci Retracement**: Strong support/resistance formation when trend-direction Fibonacci retracement matches VWAP Fibonacci levels
• **Horizontal Support/Resistance**: Reaction probability significantly increases when past important price levels match VWAP Fibonacci levels
─────────────────────────────────────
◆ Conclusion
VWAP Quantum Matrix Pro provides deep insights into price action by integrating volatility-adjusted bands and Fibonacci theory into traditional VWAP analysis.
It dynamically responds to market environment changes through volume weighting and volatility adaptation mechanisms, and can be flexibly applied to various trading styles through timeframe-optimized lookback period settings.
Through appropriate input parameter configuration, the indicator can be optimized to match each trader's style and objectives, and through combination with other technical indicators, it strengthens confidence in trading decisions, ultimately enabling more precise and systematic market approaches.
─────────────────────────────────────
※ Disclaimer: Past performance does not guarantee future results. Always use appropriate risk management strategies.
═══52SIGNAL RECIPE VWAP Quantum Matrix Pro ═══
◆ 개요
52SIGNAL RECIPE VWAP Quantum Matrix Pro는 거래량 가중 평균 가격(VWAP)을 기반으로 하는 고급 기술적 지표로, 변동성 조정 밴드와 피보나치 레벨을 통합하여 가격 움직임을 다차원적으로 분석합니다.
타임프레임별로 최적화된 룩백 기간을 자동 적용하여 다양한 거래 스타일에 맞춤화된 분석을 제공하며, 정밀한 가격 레벨 식별을 통해 트레이더가 중요한 지지/저항 구간을 효과적으로 파악할 수 있도록 돕습니다.
─────────────────────────────────────
◆ 주요 특징
• **적응형 VWAP 밴드**: 시장 변동성에 따라 자동으로 조정되는 상하단 밴드 제공
• **피보나치 통합**: VWAP 중심으로 피보나치 레벨(23.6%, 38.2%, 50%, 61.8%, 78.6%) 확장
• **타임프레임 최적화**: 각 차트 주기에 맞춰 자동으로 룩백 기간 조정
• **피봇 포인트 분석**: 거래량 가중 고저가 기반의 핵심 지지/저항 레벨 표시
• **정밀 레이블링**: 모든 주요 가격 레벨에 정확한 수치 표시
• **시각적 그라데이션**: 피보나치 레벨별 컬러 그라데이션으로 직관적인 시각화
─────────────────────────────────────
◆ 기술적 기반
■ VWAP 계산 원리
• **거래량 가중치**: 단순 가격 평균이 아닌 거래량을 고려한 실질적 균형 가격 계산
• **표준편차 밴드**: VWAP 중심으로 통계적 변동 범위 설정
• **변동성 조정 메커니즘**: 현재 ATR과 과거 ATR 비율을 활용한 동적 밴드폭 조정
• **정밀 가격 범위**: 지정된 룩백 기간 내 최고/최저 가격 범위 식별
■ 피보나치 밴드 구현
• **VWAP 중심 확장**: 중심선(VWAP)에서 표준편차 밴드까지의 거리를 피보나치 비율로 분할
• **상하단 대칭 구조**: 상승과 하락 방향으로 동일한 피보나치 비율 적용
• **색상 그라데이션**: 피보나치 레벨별 점진적 색상 변화로 시각적 깊이감 제공
─────────────────────────────────────
◆ 실용적 응용
■ 가격 움직임 해석
• **중심 기준점**:
▶ VWAP은 일중/기간 내 균형가격으로 매수/매도 압력의 균형점 제공
▶ VWAP 위/아래 움직임은 단기 강세/약세 신호로 해석 가능
• **밴드 반응 패턴**:
▶ 외부 밴드(100%)에 도달 시 과매수/과매도 상태 시그널
▶ 피보나치 레벨 간 반응 패턴은 추세 강도와 지속성 판단 근거
■ 트레이딩 전략 활용
• **범위 내 거래**:
▶ 피보나치 레벨 간 바운스 패턴 활용한 단기 매매
▶ 중심선(VWAP)과 피보나치 레벨 간 오실레이션 거래
• **추세 추종 전략**:
▶ VWAP 위/아래 정렬된 피보나치 레벨 돌파는 추세 강화 신호
▶ 외부 밴드 돌파 후 다시 진입 시 강한 모멘텀 확인
─────────────────────────────────────
◆ 고급 설정 옵션
■ 인풋 파라미터 가이드
• **기본 표준 편차 (Base Standard Deviation)** (기본값: 2.0)
▶ 1.0-1.5: 좁은 밴드, 단기 거래에 적합
▶ 1.8-2.2: 균형 잡힌 밴드, 일반적 시장 환경에 최적
▶ 2.5-3.0: 넓은 밴드, 장기 포지션에 적합
• **최대/최소 표준 편차 (Maximum/Minimum Standard Deviation)** (기본값: 3.0/1.0)
▶ 최대: 암호화폐(4.0), 주식/외환(3.0), 저변동성(2.5)
▶ 최소: 일중 거래(0.8), 일반(1.0), 장기(1.5)
• **변동성 측정 기간 (Volatility Measurement Period)** (기본값: 20)
▶ 단기(10-14): 빠른 반응, 일중 거래
▶ 중기(15-25): 균형 잡힌 반응, 스윙 트레이딩
▶ 장기(30-50): 노이즈 필터링, 장기 투자
• **변동성 조정 사용 (Use Volatility Adjustment)** (기본값: 켜짐)
▶ 켜짐: 현재 시장 변동성에 따라 밴드 폭 자동 조정 (권장)
▶ 꺼짐: 고정된 표준편차 밴드 사용
■ 타임프레임별 최적 설정
• **일중 거래** (15분-1시간): 기본 표준편차 1.8, 변동성 기간 14
• **스윙 트레이딩** (4시간-일봉): 기본 표준편차 2.0, 변동성 기간 20
• **포지션 트레이딩** (일봉-주봉): 기본 표준편차 2.5, 변동성 기간 30
■ 시장별 최적 설정
• **주식 시장**: 기본 표준편차 2.0, 변동성 기간 20
• **외환 시장**: 기본 표준편차 1.8, 변동성 기간 25
• **암호화폐 시장**: 기본 표준편차 2.5, 변동성 기간 14, 최대 표준편차 4.0
─────────────────────────────────────
◆ 다른 지표와의 시너지
• **이동평균선**: VWAP과 주요 이동평균선 교차는 추세 전환 신호 강화
• **RSI/스토캐스틱**: 과매수/과매도 구간에서 VWAP 밴드 반응과 결합 시 반전 신호 정확도 향상
• **볼린저 밴드**: VWAP Quantum Matrix와 볼린저 밴드 수렴/발산 패턴은 변동성 변화 예측에 유용
• **피보나치 리트레이스먼트**: 추세 방향 피보나치 리트레이스먼트와 VWAP 피보나치 레벨 일치 시 강력한 지지/저항 형성
• **수평 지지/저항**: 과거 중요 가격대와 VWAP 피보나치 레벨 일치 시 반응 확률 대폭 증가
─────────────────────────────────────
◆ 결론
VWAP Quantum Matrix Pro는 전통적인 VWAP 분석에 변동성 조정 밴드와 피보나치 이론을 통합하여 가격 행동에 대한 깊이 있는 통찰력을 제공합니다.
거래량 가중치와 변동성 적응 메커니즘을 통해 시장 환경 변화에 동적으로 대응하며, 타임프레임별 최적화된 룩백 기간 설정으로 다양한 거래 스타일에 유연하게 적용할 수 있습니다.
적절한 인풋 파라미터 설정을 통해 각 트레이더의 스타일과 목표에 맞게 지표를 최적화할 수 있으며, 다른 기술적 지표들과의 조합을 통해 트레이딩 결정에 대한 확신을 강화하고, 궁극적으로 더 정밀하고 체계적인 시장 접근을 가능하게 합니다.
─────────────────────────────────────
※ 면책 조항: 과거 성과가 미래 결과를 보장하지 않습니다. 항상 적절한 리스크 관리 전략을 사용하세요.

ATR Stop-Loss with Fibonacci Take-Profit [jpkxyz]ATR Stop-Loss with Fibonacci Take-Profit Indicator
This comprehensive indicator combines Average True Range (ATR) volatility analysis with Fibonacci extensions to create dynamic stop-loss and take-profit levels. It's designed to help traders set precise risk management levels and profit targets based on market volatility and mathematical ratios.
Two Operating Modes
Default Mode (Rolling Levels)
In default mode, the indicator continuously plots evolving stop-loss and take-profit levels based on real-time price action. These levels update dynamically as new bars form, creating rolling horizontal lines across the chart. I use this mode primarily to plot the rolling ATR-Level which I use to trail my Stop-Loss into profit.
Characteristics:
Levels recalculate with each new bar
All selected Fibonacci levels display simultaneously
Uses plot() functions with trackprice=true for price tracking
Custom Anchor Mode (Fixed Levels)
This is the primary mode for precision trading. You select a specific timestamp (typically your entry bar), and the indicator locks all calculations to that exact moment, creating fixed horizontal lines that represent your actual trade levels.
Characteristics:
Entry line (blue) marks your anchor point
Stop-loss calculated using ATR from the anchor bar
Fibonacci levels projected from entry-to-stop distance
Lines terminate when price breaks through them
Includes comprehensive alert system
Core Calculation Logic
ATR Stop-Loss Calculation:
Stop Loss = Entry Price ± (ATR × Multiplier)
Long positions: SL = Entry - (ATR × Multiplier)
Short positions: SL = Entry + (ATR × Multiplier)
ATR uses your chosen smoothing method (RMA, SMA, EMA, or WMA)
Default multiplier is 1.5, adjustable to your risk tolerance
Fibonacci Take-Profit Projection:
The distance from entry to stop-loss becomes the base unit (1.0) for Fibonacci extensions:
TP Level = Entry + (Entry-to-SL Distance × Fibonacci Ratio)
Available Fibonacci Levels:
Conservative: 0.618, 1.0, 1.618
Extended: 2.618, 3.618, 4.618
Complete range: 0.0 to 4.764 (23 levels total)
Multi-Timeframe Functionality
One of the indicator's most powerful features is timeframe flexibility. You can analyze on one timeframe while using stop-loss and take-profit calculations from another.
Best Practices:
Identify your entry point on execution timeframe
Enable "Custom Anchor" mode
Set anchor timestamp to your entry bar
Select appropriate analysis timeframe
Choose relevant Fibonacci levels
Enable alerts for automated notifications
Example Scenario:
Analyse trend on 4-hour chart
Execute entry on 5-minute chart for precision
Set custom anchor to your 5-minute entry bar
Configure timeframe setting to "4h" for swing-level targets
Select appropriate Fibonacci Extension levels
Result: Precise entry with larger timeframe risk management
Visual Intelligence System
Line Behaviour in Custom Anchor Mode:
Active levels: Lines extend to the right edge
Hit levels: Lines terminate at the breaking bar
Entry line: Always visible in blue
Stop-loss: Red line, terminates when hit
Take-profits: Green lines (1.618 level in gold for emphasis)
Customisation Options:
Line width (1-4 pixels)
Show/hide individual Fibonacci levels
ATR length and smoothing method
ATR multiplier for stop-loss distance

Adaptive Fibonacci Pullback System -FibonacciFluxAdaptive Fibonacci Pullback System (AFPS) - FibonacciFlux
This work is licensed under a Attribution-NonCommercial-ShareAlike 4.0 International (CC BY-NC-SA 4.0). Original concepts by FibonacciFlux.
Abstract
The Adaptive Fibonacci Pullback System (AFPS) presents a sophisticated, institutional-grade algorithmic strategy engineered for high-probability trend pullback entries. Developed by FibonacciFlux, AFPS uniquely integrates a proprietary Multi-Fibonacci Supertrend engine (0.618, 1.618, 2.618 ratios) for harmonic volatility assessment, an Adaptive Moving Average (AMA) Channel providing dynamic market context, and a synergistic Multi-Timeframe (MTF) filter suite (RSI, MACD, Volume). This strategy transcends simple indicator combinations through its strict, multi-stage confluence validation logic. Historical simulations suggest that specific MTF filter configurations can yield exceptional performance metrics, potentially achieving Profit Factors exceeding 2.6 , indicative of institutional-level potential, while maintaining controlled risk under realistic trading parameters (managed equity risk, commission, slippage).
4 hourly MTF filtering
1. Introduction: Elevating Pullback Trading with Adaptive Confluence
Traditional pullback strategies often struggle with noise, false signals, and adapting to changing market dynamics. AFPS addresses these challenges by introducing a novel framework grounded in Fibonacci principles and adaptive logic. Instead of relying on static levels or single confirmations, AFPS seeks high-probability pullback entries within established trends by validating signals through a rigorous confluence of:
Harmonic Volatility Context: Understanding the trend's stability and potential turning points using the unique Multi-Fibonacci Supertrend.
Adaptive Market Structure: Assessing the prevailing trend regime via the AMA Channel.
Multi-Dimensional Confirmation: Filtering signals with lower-timeframe Momentum (RSI), Trend Alignment (MACD), and Market Conviction (Volume) using the MTF suite.
The objective is to achieve superior signal quality and adaptability, moving beyond conventional pullback methodologies.
2. Core Methodology: Synergistic Integration
AFPS's effectiveness stems from the engineered synergy between its core components:
2.1. Multi-Fibonacci Supertrend Engine: Utilizes specific Fibonacci ratios (0.618, 1.618, 2.618) applied to ATR, creating a multi-layered volatility envelope potentially resonant with market harmonics. The averaged and EMA-smoothed result (`smoothed_supertrend`) provides a robust, dynamic trend baseline and context filter.
// Key Components: Multi-Fibonacci Supertrend & Smoothing
average_supertrend = (supertrend1 + supertrend2 + supertrend3) / 3
smoothed_supertrend = ta.ema(average_supertrend, st_smooth_length)
2.2. Adaptive Moving Average (AMA) Channel: Provides dynamic market context. The `ama_midline` serves as a key filter in the entry logic, confirming the broader trend bias relative to adaptive price action. Extended Fibonacci levels derived from the channel width offer potential dynamic S/R zones.
// Key Component: AMA Midline
ama_midline = (ama_high_band + ama_low_band) / 2
2.3. Multi-Timeframe (MTF) Filter Suite: An optional but powerful validation layer (RSI, MACD, Volume) assessed on a lower timeframe. Acts as a **validation cascade** – signals must pass all enabled filters simultaneously.
2.4. High-Confluence Entry Logic: The core innovation. A pullback entry requires a specific sequence and validation:
Price interaction with `average_supertrend` and recovery above/below `smoothed_supertrend`.
Price confirmation relative to the `ama_midline`.
Simultaneous validation by all enabled MTF filters.
// Simplified Long Entry Logic Example (incorporates key elements)
long_entry_condition = enable_long_positions and
(low < average_supertrend and close > smoothed_supertrend) and // Pullback & Recovery
(close > ama_midline and close > ama_midline) and // AMA Confirmation
(rsi_filter_long_ok and macd_filter_long_ok and volume_filter_ok) // MTF Validation
This strict, multi-stage confluence significantly elevates signal quality compared to simpler pullback approaches.
1hourly filtering
3. Realistic Implementation and Performance Potential
AFPS is designed for practical application, incorporating realistic defaults and highlighting performance potential with crucial context:
3.1. Realistic Default Strategy Settings:
The script includes responsible default parameters:
strategy('Adaptive Fibonacci Pullback System - FibonacciFlux', shorttitle = "AFPS", ...,
initial_capital = 10000, // Accessible capital
default_qty_type = strategy.percent_of_equity, // Equity-based risk
default_qty_value = 4, // Default 4% equity risk per initial trade
commission_type = strategy.commission.percent,
commission_value = 0.03, // Realistic commission
slippage = 2, // Realistic slippage
pyramiding = 2 // Limited pyramiding allowed
)
Note: The default 4% risk (`default_qty_value = 4`) requires careful user assessment and adjustment based on individual risk tolerance.
3.2. Historical Performance Insights & Institutional Potential:
Backtesting provides insights into historical behavior under specific conditions (always specify Asset/Timeframe/Dates when sharing results):
Default Performance Example: With defaults, historical tests might show characteristics like Overall PF ~1.38, Max DD ~1.16%, with potential Long/Short performance variance (e.g., Long PF 1.6+, Short PF < 1).
Optimized MTF Filter Performance: Crucially, historical simulations demonstrate that meticulous configuration of the MTF filters (particularly RSI and potentially others depending on market) can significantly enhance performance. Under specific, optimized MTF filter settings combined with appropriate risk management (e.g., 7.5% risk), historical tests have indicated the potential to achieve **Profit Factors exceeding 2.6**, alongside controlled drawdowns (e.g., ~1.32%). This level of performance, if consistently achievable (which requires ongoing adaptation), aligns with metrics often sought in institutional trading environments.
Disclaimer Reminder: These results are strictly historical simulations. Past performance does not guarantee future results. Achieving high performance requires careful parameter tuning, adaptation to changing markets, and robust risk management.
3.3. Emphasizing Risk Management:
Effective use of AFPS mandates active risk management. Utilize the built-in Stop Loss, Take Profit, and Trailing Stop features. The `pyramiding = 2` setting requires particularly diligent oversight. Do not rely solely on default settings.
4. Conclusion: Advancing Trend Pullback Strategies
The Adaptive Fibonacci Pullback System (AFPS) offers a sophisticated, theoretically grounded, and highly adaptable framework for identifying and executing high-probability trend pullback trades. Its unique blend of Fibonacci resonance, adaptive context, and multi-dimensional MTF filtering represents a significant advancement over conventional methods. While requiring thoughtful implementation and risk management, AFPS provides discerning traders with a powerful tool potentially capable of achieving institutional-level performance characteristics under optimized conditions.
Acknowledgments
Developed by FibonacciFlux. Inspired by principles of Fibonacci analysis, adaptive averaging, and multi-timeframe confirmation techniques explored within the trading community.
Disclaimer
Trading involves substantial risk. AFPS is an analytical tool, not a guarantee of profit. Past performance is not indicative of future results. Market conditions change. Users are solely responsible for their decisions and risk management. Thorough testing is essential. Deploy at your own considered risk.

Fibonacci Sequence NumbersThe "Fibonacci Sequence Numbers" indicator overlays horizontal lines on a trading chart based on Fibonacci sequence values (0, 34, 55, 89, 144, 233, 377, 610) relative to a user-defined reference price and time. Users can specify the direction ("Above," "Below," or "Both") to plot these levels above and/or below the reference price, with customizable line length, width, and colors for each level (e.g., red for Level 0, blue for 34). A vertical dashed line marks the reference time, while horizontal lines extend rightward, accompanied by labeled annotations shifted slightly left for clear view.

VSA Volume + Fibonacci (Volunacci)Overview
This indicator combines Volume Spread Analysis (VSA) with Fibonacci levels to identify key price zones based on volume behavior. It helps traders determine potential support and resistance levels influenced by volume strength.
How It Works
Volume Calculation
The indicator calculates volume levels based on the selected timeframe.
It identifies high volume spikes and low volume dips, which are critical for detecting supply and demand shifts.
It uses a simple moving average (SMA) of volume to smooth fluctuations.
Fibonacci Levels Integration
When a high-volume event is detected, the indicator records the highest high and lowest low of that candle.
It then plots Fibonacci retracement and extension levels to highlight potential price reaction zones.
Negative Fibonacci levels are included to identify possible deep retracements.
Visual Features
The indicator adapts to both light and dark themes for better visibility.
Fibonacci lines are color-coded based on key retracement and extension levels.
A table displaying key Fibonacci levels and their corresponding prices is provided for quick reference.
Why Is This Indicator Useful?
It helps traders spot accumulation and distribution phases by analyzing volume at key price points.
The combination of VSA and Fibonacci allows traders to confirm trend strength and identify potential reversal points.
Works well for trend-following strategies, scalping, and breakout trading.
How to Use This Indicator?
Use it to confirm breakouts or reversals at Fibonacci levels when volume supports the move.
Watch for high-volume spikes near key Fibonacci zones—these can signal strong trend continuation or reversal.
Use the displayed Fibonacci table to quickly assess price reaction levels.
Credits
This script was inspired by the Hidden Gap’s VSA Volume indicator by HPotter and has been enhanced by integrating Fibonacci-based analysis.
Fibonacci Extension Strt StrategyCore Logic and Steps:
Weekly Trend Identification:
Find the last significant Higher High (HH) and Lower Low (LL) or vice-versa on the Weekly timeframe.
Determine if it's an uptrend (HH followed by LL) or a downtrend (LL followed by HH).
Plot a Fibonacci Extension (or Retracement in reverse order) from the swing point determined to the other significant swing point.
Weekly Retracement Levels:
Display horizontal lines at the 0.236, 0.382, and 0.5 Fibonacci levels from the weekly extension.
Monitor price action on these levels.
Daily Confirmation:
When price hits the Fib levels, examine the Daily chart.
Look for a rejection wick (indicating the pull back is ending) on the identified weekly retracement levels.
Confirm that the price is indeed starting to continue in the direction of the original weekly trend.
Four-Hour Entry:
On the 4H timeframe, plot a new Fib Extension in the opposite direction of the weekly.
If it's an uptrend, the Fib is plotted from last swing low to its swing high. If the weekly trend was bearish the Fib will be plotted from last swing high to the swing low.
Generate an entry when price breaks the high of that candle.
Trade Management:
Entry is on the breakout of the current candle.
Stop Loss: Place the stop loss below the wick of the breakout candle.
Take Profit 1: Close 50% of the position at the 0.5 Fibonacci level. Move the stop loss to breakeven on this position.
Take Profit 2: Close another 25% of the position at the 0.236 Fib level.
Trailing Take Profit: Keep the last 25% open, using a trailing stop loss. (You'll need to define the logic for the trailing stop, e.g., trailing stop using the last high/low)
How to Use in TradingView:
Open a TradingView Chart.
Click on "Pine Editor" at the bottom.
Copy and paste the corrected Pine Script code.
Click "Add to Chart".
The indicator should now be displayed on your chart.

Fibonacci Time-Price Zones🟩 Fibonacci Time-Price Zones is a chart visualization tool that combines Fibonacci ratios with time-based and price-based geometry to analyze market behavior. Unlike typical Fibonacci indicators that focus solely on horizontal price levels, this indicator incorporates time into the analysis, providing a more dynamic perspective on price action.
The indicator offers multiple ways to visualize Fibonacci relationships. Drawing segmented circles creates a unique perspective on price action by incorporating time into the analysis. These segmented circles, similar to TradingView's built-in Fibonacci Circles, are derived from Fibonacci time and price levels, allowing traders to identify potential turning points based on the dynamic interaction between price and time.
As another distinct visualization method, the indicator incorporates orthogonal patterns, created by the intersection of horizontal and vertical Fibonacci levels. These intersections form L-shaped connections on the chart, derived from key Fibonacci price and time intervals, highlighting potential areas of support or resistance at specific points in time.
In addition to these geometric approaches, another option is sloped lines, which project Fibonacci levels that account for both time and price along the trendline. These projections derive their angles from the interplay between Fibonacci price levels and Fibonacci time intervals, creating dynamic zones on the chart. The slope of these lines reflects the direction and angle of the trend, providing a visual representation of price alignment with market direction, while maintaining the time-price relationship unique to this indicator
The indicator also includes horizontal Fibonacci levels similar to traditional retracement and extension tools. However, unlike standard tools, traders can display retracement levels, extension levels, or both simultaneously from a single instance of the indicator. These horizontal levels maintain consistency with the chosen visualization method, automatically scaling and adapting whether used with circles, orthogonal patterns, or slope-based analysis.
By combining these distinct methods—circles, orthogonal patterns, sloped projections, and horizontal levels—the indicator provides a comprehensive approach to Fibonacci analysis based on both time and price relationships. Each visualization method offers a unique perspective on market structure while maintaining the core principle of time-price interaction.
⭕ THEORY AND CONCEPT ⭕
While traditional Fibonacci tools excel at identifying potential support and resistance levels through price-based ratios (0.236, 0.382, 0.618), they do not incorporate the dimension of time in market analysis. Extensions and retracements effectively measure price relationships within trends, yet markets move through both price and time dimensions simultaneously.
Fibonacci circles represent an evolution in technical analysis by incorporating time intervals alongside price levels. Based on the mathematical principle that markets often move in circular patterns proportional to Fibonacci ratios, these circles project potential support and resistance zones as partial circles radiating from significant price points. However, traditional circle-based tools can create visual complexity that obscures key market relationships. The integration of time into Fibonacci analysis reveals how price movements often respect both temporal and price-based ratios, suggesting a deeper geometric structure to market behavior.
The Fibonacci Time-Price Zones indicator advances these concepts by providing multiple geometric approaches to visualize time-price relationships. Each shape option—circles, orthogonal patterns, slopes, and horizontal levels—represents a different mathematical perspective on how Fibonacci ratios manifest across both dimensions. This multi-faceted approach allows traders to observe how price responds to Fibonacci-based zones that account for both time and price movements, potentially revealing market structure that purely price-based tools might miss.
Shape Options
The indicator employs four distinct geometric approaches to analyze Fibonacci relationships across time and price dimensions:
Circular : Represents the cyclical nature of market movements through partial circles, where each radius is scaled by Fibonacci ratios incorporating both time and price components. This geometry suggests market movements may follow proportional circular paths from significant pivot points, reflecting the harmonic relationship between time and price.
Orthogonal : Constructs L-shaped patterns that separate the time and price components of Fibonacci relationships. The horizontal component represents price levels, while the vertical component measures time intervals, allowing analysis of how these dimensions interact independently at key market points.
Sloped : Projects Fibonacci levels along the prevailing trend, incorporating both time and price in the angle of projection. This approach suggests that support and resistance levels may maintain their relationship to price while adjusting to the temporal flow of the market.
Horizontal : Provides traditional static Fibonacci levels that serve as a reference point for comparing price-only analysis with the dynamic time-price relationships shown in the other three shapes. This baseline approach allows traders to evaluate how the incorporation of time dimension enhances or modifies traditional Fibonacci analysis.
By combining these geometric approaches, the Fibonacci Time-Price Zones indicator creates a comprehensive analytical framework that bridges traditional and advanced Fibonacci analysis. The horizontal levels serve as familiar reference points, while the dynamic elements—circular, orthogonal, and sloped projections—reveal how price action responds to temporal relationships. This multi-dimensional approach enables traders to study market structure through various geometric lenses, providing deeper insights into time-price symmetry within technical analysis. Whether applied to retracements, extensions, or trend analysis, the indicator offers a structured methodology for understanding how markets move through both price and time dimensions.
🛠️ CONFIGURATION AND SETTINGS 🛠️
The Fibonacci Time-Price Zones indicator offers a range of configurable settings to tailor its functionality and visual representation to your specific analysis needs. These options allow you to customize zone visibility, structures, horizontal lines, and other features.
Important Note: The indicator's calculations are anchored to user-defined start and end points on the chart. When switching between charts with significantly different price scales (e.g., from Bitcoin at $100,000 to Silver at $30), adjustment of these anchor points is required to ensure correct positioning of the Fibonacci elements.
Fibonacci Levels
The indicator allows users to customize Fibonacci levels for both retracement and extension analysis. Each level can be individually configured with the following options:
Visibility : Toggle the visibility of each level to focus on specific areas of interest.
Level Value : Set the Fibonacci ratio for the level, such as 0.618 or 1.000, to align with your analysis needs.
Color : Customize the color of each level for better visual clarity.
Line Thickness : Adjust the line thickness to emphasize critical levels or maintain a cleaner chart.
Setup
Zone Type : Select which Fibonacci zones to display:
- Retracement : Shows potential pull back levels within the trend
- Extension : Projects levels beyond the trend for potential continuation targets
- Both : Displays both retracement and extension zones simultaneously
Shape : Choose from four visualization methods:
- Circular : Time-price based semicircles centered on point B
- Orthogonal : L-shaped patterns combining time and price levels
- Sloped : Trend-aligned projections of Fibonacci levels
- Horizontal : Traditional horizontal Fibonacci levels
Visual Settings
Fill % : Adjusts the fill intensity of zones:
0% : No fill between levels
100% : Maximum fill between levels
Lines :
Trendline : The base A-B trend with customizable color
Extension : B-C projection line
Retracement : B-D pullback line
Labels :
Points : Show/hide A, B, C, D markers
Levels : Show/hide Fibonacci percentages
Time-Price Points
Set the time and price for the points that define the Fibonacci zones and horizontal levels. These points are defined upon loading the chart. These points can be configured directly in the settings or adjusted interactively on the live chart.
A and B Points : These user-defined time and price points determine the basis for calculating the semicircles and Fibonacci levels. While the settings panel displays their exact values for fine-tuning, the easiest way to modify these points is by dragging them directly on the chart for quick adjustments.
Interactive Adjustments : Any changes made to the points on the chart will automatically synchronize with the settings panel, ensuring consistency and precision.
🖼️ CHART EXAMPLES 🖼️
Fibonacci Time-Price Zones using the 'Circular' Shape option. Note the price interaction at the 0.786 level, which acts as a support zone. Additional points of interest include resistance near the 0.618 level and consolidation around the 0.5 level, highlighting the utility of both horizontal and semicircular Fibonacci projections in identifying key price areas.
Fibonacci Time-Price Zones using the 'Sloped' Shape option. The chart displays price retracing along the sloped Fibonacci levels, with blue arrows highlighting potential support zones at 0.618 and 0.786, and a red arrow indicating potential resistance at the 1.0 level. This visual representation aligns with the prevailing downtrend, suggesting potential selling pressure at the 1.0 Fibonacci level.
Fibonacci Time-Price Zones using the 'Orthogonal' Shape option. The chart demonstrates price action interacting with vertical zones created by the orthogonal lines at the 0.618, 0.786, and 1.0 Fibonacci levels. Blue arrows highlight potential support areas, while red arrows indicate potential resistance areas, revealing how the orthogonal lines can identify distinct points of price interaction.
Fibonacci Time-Price Zones using the 'Circular' Shape option. The chart displays price action in relation to segmented circles emanating from the starting point (point A). The circles represent different Fibonacci ratios (0.382, 0.5, 0.618, 0.786) and their intersections with the price axis create potential zones of support and resistance. This approach offers a visually distinct way to analyze potential turning points based on both price and time.
Fibonacci Time-Price Zones using the 'Sloped' Shape option. The sloped Fibonacci levels (0.786, 0.618, 0.5) create zones of potential support and resistance, with price finding clear interaction within these areas. The ellipses highlight this price action, particularly the support between 0.786 and 0.618, which aligns closely with the trend.
Fibonacci Time-Price Zones using the 'Circular' Shape option. The price action appears to be ‘hugging’ the 0.5 Fibonacci level, suggesting potential resistance. This demonstrates how the circular zones can identify potential turning points and areas of consolidation which might not be seen with linear analysis.
Fibonacci Time-Price Zones using the 'Sloped' Shape option with Point D marker enabled. The chart demonstrates clear price action closely following along the sloped Retracement line until the orthogonal intersection at the 0.618 levels where the trend is broken and price dips throughout the 0.618 to 0.786 horizontal zone. Price jumps back to the retracement slope at the start of the 0.786 horizontal zone and continues to the 1.0 horizontal zone. The aqua-colored retracement line is enabled to further emphasize this retracement slope .
Geometric validation using TradingView's built-in Fibonacci Circle tool (overlaid). The alignment at the 0.5 and 1.0 levels demonstrates the indicator's consistent approximation of Fibonacci Circles.
Comparison of Fibonacci Time-Price Zones (Shape: Horizontal) with TradingView's Built-in Retracement and Extension Tools (overlaid): This example demonstrates how the Horizontal structure aligns with TradingView’s retracement and extension levels, allowing users to integrate multiple tools seamlessly. The Fibonacci circle connects retracement and extension zones, highlighting the potential relationship between past retracements and future extensions.
📐 GEOMETRIC FOUNDATIONS 📐
This indicator integrates circular and straight representations of Fibonacci levels, specifically the Circular , Orthogonal , Sloped , and Horizontal shape options. The geometric principles behind these shapes differ significantly, requiring distinct scaling methods for accurate representation. The Circular shape employs logarithmic scaling with radial expansion, where the distance from a central point determines the level's position, creating partial circles that align with TradingView's built-in Fibonacci Circle tool. The other three shapes utilize geometric progression scaling for linear extension from a starting point, resulting in straight lines that align with TradingView's built-in Fibonacci retracement and extension tools. Due to these distinct geometric foundations and scaling methods, perfectly aligning both the partial circles and straight lines simultaneously is mathematically constrained, though any differences are typically visually imperceptible.
The Circular shape's partial circles are calculated and scaled to align with TradingView's built-in Fibonacci Circles. These circles are plotted from the second swing point onward. This approach ensures consistent and accurate visualization across all market types, including those with gaps or closed sessions, which unlike 24/7 markets, do not have a direct one-to-one correspondence between bar indices and time. To maintain accurate geometric proportions across varying chart scales, the indicator calculates an aspect ratio by normalizing the proportional difference between vertical (price) and horizontal (time) distances of the swing points. This normalization factor ensures geometric shapes maintain their mathematical properties regardless of price scale magnitude or time period span, while maintaining the correct proportions of the geometric constructions at any chart zoom level.
The indicator automatically applies the appropriate scaling factor based on the selected shape option, optimizing either circular proportions and proper radius calculations for each Fibonacci level, or straight-line relationships between Fibonacci levels. These distinct scaling approaches maintain mathematical integrity while preserving the essential characteristics of each geometric representation, ensuring optimal visualization accuracy whether using circular or linear shapes.
⚠️ DISCLAIMER ⚠️
The Fibonacci Time-Price Zones indicator is a visual analysis tool designed to illustrate Fibonacci relationships through geometric constructions incorporating both curved and straight lines, providing a structured framework for identifying potential areas of price interaction. It is not intended as a predictive or standalone trading signal indicator.
The indicator calculates levels and projections using user-defined anchor points and Fibonacci ratios. While it aims to align with TradingView’s Fibonacci extension, retracement, and circle tools by employing mathematical and geometric formulas, no guarantee is made that its calculations are identical to TradingView's proprietary methods.
Like all technical and visual indicators, these visual representations may visually align with key price zones in hindsight, reflecting observed price dynamics. However, these visualizations are not standalone signals for trading decisions and should be interpreted as part of a broader analytical approach.
This indicator is intended for educational and analytical purposes, complementing other tools and methods of market analysis. Users are encouraged to integrate it into a comprehensive trading strategy, customizing its settings to suit their specific needs and market conditions.
🧠 BEYOND THE CODE 🧠
The Fibonacci Time-Price Zones indicator is designed to encourage both education and community engagement. By integrating time-sensitive geometry with Fibonacci-based frameworks, it bridges traditional grid-based analysis with dynamic time-price relationships. The inclusion of semicircles, horizontal levels, orthogonal structures, and sloped trends provides users with versatile tools to explore the interaction between price movements and temporal intervals while maintaining clarity and adaptability.
As an open-source tool, the indicator invites exploration, experimentation, and customization. Whether used as a standalone resource or alongside other technical strategies, it serves as a practical and educational framework for understanding market structure and Fibonacci relationships in greater depth.
Your feedback and contributions are essential to refining and enhancing the Fibonacci Time-Price Zones indicator. We look forward to the creative applications, adaptations, and insights this tool inspires within the trading community.

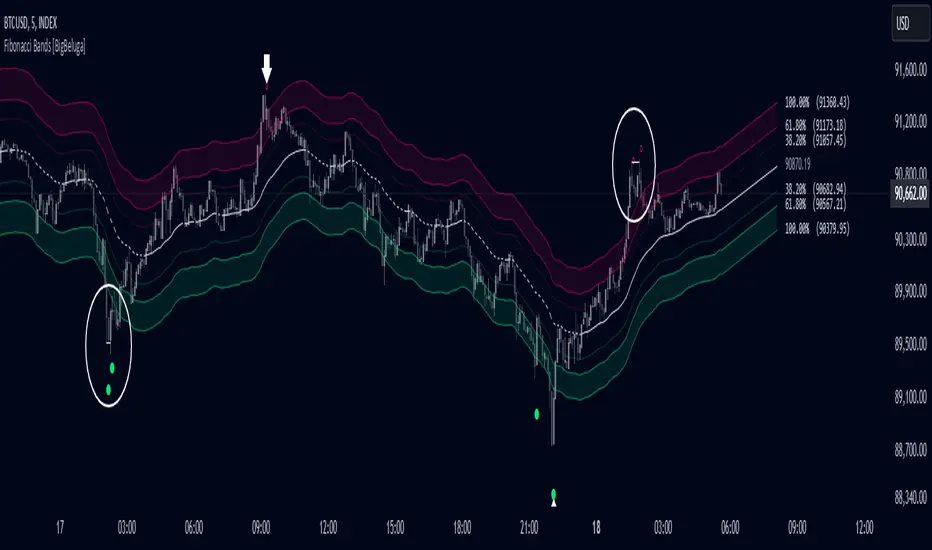
Fibonacci Bands [BigBeluga]The Fibonacci Band indicator is a powerful tool for identifying potential support, resistance, and mean reversion zones based on Fibonacci ratios. It overlays three sets of Fibonacci ratio bands (38.2%, 61.8%, and 100%) around a central trend line, dynamically adapting to price movements. This structure enables traders to track trends, visualize potential liquidity sweep areas, and spot reversal points for strategic entries and exits.
🔵 KEY FEATURES & USAGE
Fibonacci Bands for Support & Resistance:
The Fibonacci Band indicator applies three key Fibonacci ratios (38.2%, 61.8%, and 100%) to construct dynamic bands around a smoothed price. These levels often act as critical support and resistance areas, marked with labels displaying the percentage and corresponding price. The 100% band level is especially crucial, signaling potential liquidity sweep zones and reversal points.
Mean Reversion Signals at 100% Bands:
When price moves above or below the 100% band, the indicator generates mean reversion signals.
Trend Detection with Midline:
The central line acts as a trend-following tool: when solid, it indicates an uptrend, while a dashed line signals a downtrend. This adaptive midline helps traders assess the prevailing market direction while keeping the chart clean and intuitive.
Extended Price Projections:
All Fibonacci bands extend to future bars (default 30) to project potential price levels, providing a forward-looking perspective on where price may encounter support or resistance. This feature helps traders anticipate market structure in advance and set targets accordingly.
Liquidity Sweep:
--
-Liquidity Sweep at Previous Lows:
The price action moves below a previous low, capturing sell-side liquidity (stop-losses from long positions or entries for breakout traders).
The wick suggests that the price quickly reversed, leaving a failed breakout below support.
This is a classic liquidity grab, often indicating a bullish reversal .
-Liquidity Sweep at Previous Highs:
The price spikes above a prior high, sweeping buy-side liquidity (stop-losses from short positions or breakout entries).
The wick signifies rejection, suggesting a failed breakout above resistance.
This is a bearish liquidity sweep , often followed by a mean reversion or a downward move.
Display Customization:
To declutter the chart, traders can choose to hide Fibonacci levels and only display overbought/oversold zones along with the trend-following midline and mean reversion signals. This option enables a clearer focus on key reversal areas without additional distractions.
🔵 CUSTOMIZATION
Period Length: Adjust the length of the smoothed moving average for more reactive or smoother bands.
Channel Width: Customize the width of the Fibonacci channel.
Fibonacci Ratios: Customize the Fibonacci ratios to reflect personal preference or unique market behaviors.
Future Projection Extension: Set the number of bars to extend Fibonacci bands, allowing flexibility in projecting price levels.
Hide Fibonacci Levels: Toggle the visibility of Fibonacci levels for a cleaner chart focused on overbought/oversold regions and midline trend signals.
Liquidity Sweep: Toggle the visibility of Liquidity Sweep points
The Fibonacci Band indicator provides traders with an advanced framework for analyzing market structure, liquidity sweeps, and trend reversals. By integrating Fibonacci-based levels with trend detection and mean reversion signals, this tool offers a robust approach to navigating dynamic price action and finding high-probability trading opportunities.
Fibonacci Moving Average PlusFibonacci Moving Average Plus is a sophisticated technical indicator that employs the first 15 numbers of the Fibonacci sequence to create dynamic moving average channels. This indicator aims to capture both immediate and long-term price movements by calculating Exponential Moving Averages (EMAs) based on these Fibonacci values. By using Fibonacci-based moving averages for both high and low price points, the indicator generates a visual channel that reflects the ebb and flow of market trends, acting as potential zones of support and resistance. Additionally, the indicator provides midline, retracement, and extension levels rooted in Fibonacci ratios, which are frequently observed as key levels for reversals or trend continuation.
Ideology Behind Using Fibonacci Sequence-Based Moving Averages
The Fibonacci sequence, known for its mathematical harmony and prevalence in natural patterns, is widely utilized in technical analysis to identify potential turning points in markets. In this indicator, the first 15 Fibonacci numbers (5, 8, 13, 21, etc.) are used as the lookback periods for EMAs to capture different layers of market sentiment. These moving averages represent timeframes that are theoretically in alignment with the natural rhythms of market cycles, where key levels—often coinciding with Fibonacci numbers—can act as magnetic points for price.
The Fibonacci high and low channels aim to encapsulate price action, giving traders a sense of whether the market is trending, consolidating, or experiencing reversal pressure. These levels, grounded in both mathematics and market psychology, help traders spot areas where price might face resistance or find support.
Key Features
Fibonacci Moving Average High and Low: This indicator calculates the high and low EMAs based on Fibonacci sequence numbers (e.g., 5, 8, 13, etc.) for enhanced trend analysis.
Golden Pocket Retracement (GPR) and Extension (GPE) Bands: Displays common Fibonacci retracement and extension levels (0.618, 0.65 for retracement, and 1.618, 1.65 for extension).
Midline: Plots the average of the Fibonacci high and low to act as an additional reference level.
Stop-Loss Levels: Provides suggested stop-loss levels based on Fibonacci levels for both long and short positions.
Basic User Guide
Adjust Input Settings:
Input Timeframe: Set a specific timeframe for the Fibonacci moving average calculation, separate from the chart's primary timeframe.
Show Fibonacci MA High/Low: Toggle the visibility of the high and low Fibonacci moving averages.
Show Mid Line: Display a midline for added trend reference.
Show Golden Pocket Bands: Choose to display retracement or extension bands for potential support or resistance zones.
Show Stop-Loss Levels: Enable to visualize potential stop-loss levels for both long and short trades.
Interpretation:
Fibonacci MA High and Low: Use these lines to gauge the general trend. When the price is above both, it may indicate an uptrend; below both, a downtrend.
Golden Pocket Retracement: This zone (between 0.618 and 0.65) is often a key level for potential reversals or support/resistance.
Golden Pocket Extension: The 1.618 and 1.65 levels can indicate potential profit-taking or trend exhaustion points.
Stop-Loss Levels: The calculated stop-loss levels (long SL below and short SL above) can aid in risk management.
Customization:
You can customize the appearance and visibility of each component through the input settings to fit your specific strategy and visual preferences.
This indicator should be used alongside other technical analysis tools to provide a more comprehensive trading approach.
This Indicator would not exist without the original contributions and blessing from Sofien Kaabar

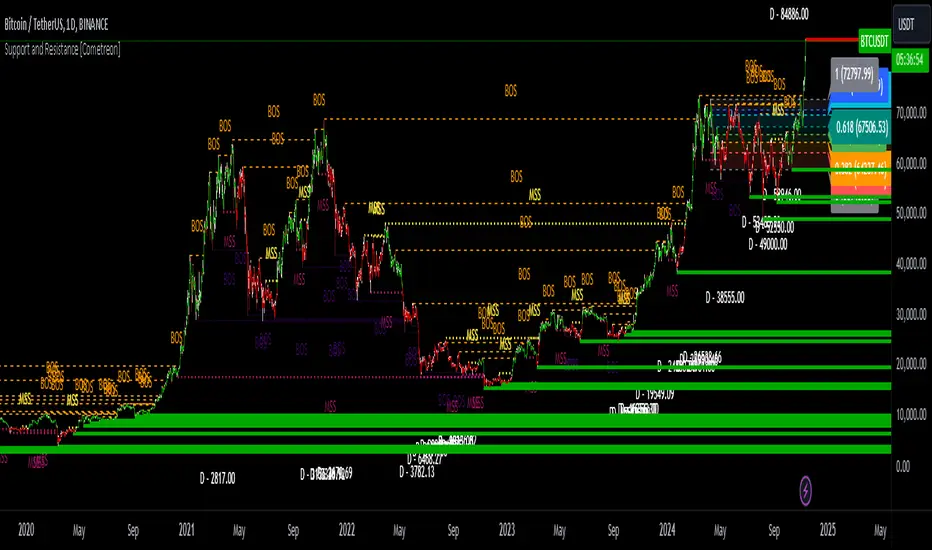
Support and Resistance MTF [Cometreon]The Support and Resistance MTF elevates your technical analysis by automatically identifying and plotting critical support and resistance levels across any symbol and timeframe—even higher ones. Powered by advanced algorithms, this tool continuously analyzes market structure and updates in real time, saving you hours of manual analysis.
If you're looking for a smart, dynamic, and highly customizable S&R solution, this is the tool for you.
🔷 Key Features & Improvements
🟩 Automatic Level Detection
The indicator automatically plots all support and resistance levels, providing a clear map of key points on the chart.
🟩 Historical Level Display
Shows historical support and resistance levels, providing a comprehensive view of the market over time.
🟩 Dynamic Trend Creation
Automatically identifies and updates trends based on levels, simplifying the understanding of market directions.
🟩 Automatic Fibonacci
Generates Fibonacci levels based on the last two support and resistance levels, offering additional reference points for potential price retracements or extensions.
🟩 Customizable Alerts
Offers a series of configurable alerts to keep you informed about breakouts, new confirmed levels, and price bounces on active levels.
🔷 Technical Details and Customizable Inputs
1️⃣ Line Types - Select the type of lines to display: active, broken, both, or none.
2️⃣ Left Length - Determines the number of candles to calculate the previous high or low point.
3️⃣ Right Length - Defines the number of candles needed to confirm a level as Support or Resistance.
4️⃣ Timeframe - You can modify the timeframe of supports and resistances to view levels of a higher timeframe. It's also possible to add additional support and resistance levels using a second timeframe.
5️⃣ Breakout Source - Change the source needed to break support and resistance levels between Close or High/Low.
6️⃣ Delete at Timeframe - Allows removing levels based on the current chart resource instead of using that of the higher timeframe.
7️⃣ Session Range - Choose a period of distance from the last candle to define how far back in the past the indicator should look for Supports or Resistances.
8️⃣ Style Valid Level - Customize the appearance of active levels, including the color of the level itself, Liquidity fill, text color, line style and thickness, extension, as well as the size, position, and values to display in the level text.
9️⃣ Liquidity - This option displays the liquidity associated with each support and resistance level, with three modes: "Wick" which goes from the high/low to the upper/lower body, "Body" instead goes from the level to the lower/upper body of the candle and "Full Range" which extends from the high to the low of the candle.
1️⃣0️⃣ Style Break Level - Allows modifying color, style, and thickness of lines, as well as text width, for two types of breakouts: "MSS" and "BOS".
" MSS " stands for " Market Structure Switch " and indicates a level breakout opposite to the previous breakout, signaling a trend reversal.
" BOS ", on the other hand, means " Break of Structure" and occurs when a level is broken in the same direction as the previous one, confirming trend continuation.
1️⃣1️⃣ Fibonacci Trend Line - Add up to 8 Fibonacci levels based on the last two identified support and resistance levels. Customize the different levels by modifying colors, thickness, style, and extension of lines. You also have the option to add a transparent background between each level.
1️⃣2️⃣ Use Only Confirmed Levels - Activate this option if you want the system to use only the last two confirmed levels, excluding potential levels not yet confirmed.
1️⃣3️⃣ Reverse - Used to reverse the direction of Fibonacci lines.
1️⃣4️⃣ Use Higher / Lower - This option allows using the currently active maximum and minimum levels of Support and Resistance. The indicator will update each Support level until it encounters another active Resistance, and vice versa.
1️⃣5️⃣ Trend Style - Activate/deactivate two types of indicator Trends: "Bar Color" based on level breakouts and "Background Color" based on the last active unconfirmed level.
1️⃣6️⃣ Signal Style - Activate or deactivate the various breakout and bounce signals. Bounces present three options:
Total Rejection(TR) : occurs when the price exceeds the high or low and closes below the liquidity level.
Internal Rejection(IR) : the price closes in the liquidity zone.
Liquidity Rejection(LR) : the price does not exceed the high or low, but only the liquidity level, closing below it.
1️⃣7️⃣ Customized Alerts - Set alerts to be notified in case of breakouts, bounces, or formation of new levels.
These options allow you to optimize the indicator for different trading styles and market conditions, ensuring accurate and tailored technical analysis.
🔍 How to Use Support and Resistance MTF Pro
📌 Using Critical Levels
Consider all levels on the chart as "magnetic points" for the price. These represent critical areas where the market tends to react.
📈 Signal Interpretation
Use the indicator's signals to interpret market movements. A level breakout can indicate a trend reversal or continuation. Bounces can suggest the holding of a level or signal a possible breakout.
🛠 Strategy Integration
Leverage the trend of support and resistance levels, breakouts, and bounces as key elements to develop and refine your trading strategies.
☄️ Support and Resistance simplifies your market analysis, saving you time and improving the accuracy of your decisions. Thanks to clearly visualized and customizable levels, you'll have a clearer and more immediate view of market dynamics.
Don't wait any longer: discover how Support and Resistance can enhance your market analysis, offering you clear indications for faster and more precise trading decisions.
Adaptive Fibonacci Trend Ribbon[FibonacciFlux]Adaptive Fibonacci Trend Ribbon (FibonacciFlux)
Overview
The Adaptive Fibonacci Trend Ribbon is a versatile technical analysis tool designed for traders who want to leverage the power of multiple moving averages while integrating Fibonacci numbers. This indicator provides a dynamic visual representation of market trends, enhancing decision-making processes in trading.
Key Features
1. Multi-Moving Averages
- The indicator calculates eight different moving averages based on user-defined periods, including Fibonacci numbers such as 5, 8, 13, 21, 34, 55, 89, and 144.
- Traders can choose from various moving average types, including EMA, HMA, WMA, VWMA, ALMA, SMA, RMA, and TMA , allowing for tailored analysis based on market conditions.
2. Trend Detection
- Each moving average is color-coded based on its trend direction, with green indicating an upward trend and red indicating a downward trend.
- This visual clarity helps traders quickly assess market sentiment and make informed decisions.
3. Fill Areas for Enhanced Insight
- The indicator features fill areas between the moving averages, which dynamically change color according to their relative positions.
- This provides a clear visual cue of trend strength and potential reversal points, allowing traders to identify key areas of interest.
4. Customizable Inputs
- Users can easily adjust the source data, moving average lengths, and ALMA parameters (offset and sigma) to fit their trading strategies.
- This flexibility ensures that traders can adapt the tool to various market conditions and personal preferences.
Insights and Applications
1. Fibonacci Integration
- By incorporating Fibonacci numbers into the moving average periods, this indicator allows traders to align their strategies with key levels of support and resistance.
- This can enhance the accuracy of entry and exit points, particularly in trending markets.
2. Trend Continuation and Reversal Analysis
- The adaptive nature of the moving averages provides insights into potential trend continuations or reversals.
- Traders can use the indicator to identify when to enter or exit positions based on the interaction between the moving averages.
3. Visual Clarity for Quick Decisions
- The color-coded moving averages and fill areas offer immediate visual feedback on market conditions, helping traders react swiftly to changing dynamics.
- This is especially useful in fast-moving markets where timely decisions are critical.
Conclusion
The Adaptive Fibonacci Trend Ribbon is an essential tool for traders looking to enhance their technical analysis capabilities. By combining multiple moving averages with Fibonacci integration and dynamic visual cues, this indicator offers a robust framework for understanding market trends. Its flexibility and clarity make it an invaluable asset for both novice and experienced traders alike.
Open Source Contribution
This indicator is open source, inviting contributions and improvements from the trading community. Feel free to fork, enhance, and share your insights with the world, helping to foster a collaborative environment for traders everywhere.

MTF EHMA & HMA Insights [FibonacciFlux]MTF EHMA & HMA Insights
Overview
The Multi-Timeframe EHMA, HMA, and Midline with Fill script is a powerful technical analysis tool designed for traders seeking to enhance their market insights and decision-making processes. By integrating two advanced moving averages—Exponential Hull Moving Average (EHMA) and Hull Moving Average (HMA)—along with a dynamic midline, this indicator provides a comprehensive view of market trends across multiple timeframes.
Key Features
1. Dual Moving Averages
- Exponential Hull Moving Average (EHMA) :
- Offers a rapid response to price changes, making it particularly useful for identifying short-term trends.
- Utilizes a unique calculation method that reduces lag, allowing traders to react quickly to market movements.
- Hull Moving Average (HMA) :
- Known for its smoothness and ability to filter out noise, the HMA presents a clear picture of the underlying trend.
- The HMA is specifically designed to achieve a balance between responsiveness and smoothness, enabling traders to make informed decisions.
2. Midline Calculation
- Dynamic Midline (m) :
- The midline is calculated as the average of EHMA and HMA, providing a neutral reference point for evaluating price movements.
- It visually represents market sentiment; a rising midline suggests bullish conditions, while a declining midline indicates bearish trends.
3. Visual Components
- Fill Areas :
- Color-coded fills between the EHMA and HMA enhance visual clarity by indicating the relative position of these moving averages.
- The fill color dynamically changes based on the relationship between the two averages (green for EHMA below HMA and red for EHMA above HMA), allowing traders to quickly assess market conditions.
4. Signal Generation and Alerts
- Buy/Sell Signals :
- The indicator generates buy signals when the midline crosses above its previous value, indicating a potential upward trend.
- Conversely, sell signals are triggered when the midline crosses below its previous value, suggesting a possible downward movement.
- Alert Conditions :
- Built-in alerts notify traders in real-time when significant changes occur, allowing them to act swiftly on potential trading opportunities.
- Customizable alert messages ensure traders receive relevant information tailored to their strategies.
Technical Details
Input Parameters
- Timeframe Settings :
- Traders can customize the timeframes for both EHMA and HMA, enabling them to adapt the indicator to different trading styles and market conditions.
- Length Settings :
- Adjustable lengths for both moving averages impact their sensitivity, allowing traders to optimize their performance based on volatility and market dynamics.
Plotting and Visualization
- Plotting :
- The script plots the EHMA, HMA, and midline directly on the chart for easy visualization.
- Signal labels (BUY and SELL) are displayed prominently, helping traders to identify potential entry and exit points without ambiguity.
Benefits
1. Clarity and Insight
- The combination of EHMA, HMA, and midline provides a clear and concise visual representation of market trends, aiding traders in making informed decisions.
2. Flexibility
- Customizable parameters allow traders to tailor the indicator to their specific needs, making it suitable for various market conditions and trading styles.
3. Efficiency
- Real-time alerts and visual signals minimize response times, enabling traders to capitalize on opportunities as they arise.
4. Enhanced Trading Conditions
- When utilizing the Fibonacci number 144 on a daily chart, the indicator facilitates optimal trading conditions:
- "The entry was made before the bubble began, using 144 as the Fibonacci variable."
- "The exit occurred right before the bubble burst, or alternatively, a short position was initiated."
- "When the next bubble started, a long entry was made again."
- "Despite some lag, the position was exited and a long entry was made."
- "The exit or short entry took place at the second double top peak."
- "A short position was already established before the double top formation occurred."
- On a 4-hour chart, traders can effectively set stop losses at HMA levels, achieving a risk-reward ratio between 4 and 8.
- Additionally, analyzing the 15-minute chart with a multi-timeframe approach allows for more precise entry points.
Conclusion
The Multi-Timeframe EHMA, HMA, and Midline with Fill script is a robust tool for traders looking to enhance their technical analysis capabilities. By combining multiple moving averages with a dynamic midline and alert system, this indicator offers a comprehensive approach to understanding market trends. Its flexibility, clarity, and efficiency make it an invaluable asset for both novice and experienced traders alike.
Important Note
As with any trading tool, it is crucial to conduct thorough analysis and risk management when using this indicator. Past performance does not guarantee future results, and traders should always be prepared for potential market fluctuations.

Price & Volume Breakout Fibonacci Probability [TradeDots]📝 OVERVIEW
The "Price & Volume Breakout Fibonacci Probability" indicator is designed to detect the probability of the maximum run-up and drawdown of each breakout trade on an asset, assisting traders in optimizing their take profit and stop loss strategies.
🧮 CALCULATIONS
The algorithm detects price and volume breakouts to activate the Fibonacci levels displayed on the chart. It calculates these levels using the period pivot high and low, with the close price of the breakout bar as the reference price.
The indicator then forward-tests within an user-selected number of bars, detecting the maximum run-up and drawdown during that period. Consequently, it calculates the probability of the price hitting either side of the Fibonacci levels, showing the likelihood of reaching take profit and stop loss targets for each breakout trade.
📊 EXAMPLE
The above example shows two breakout trades, circled within the yellow rectangle zone.
The first trade has a maximum run-up above the +0.382 Fibonacci level zone and a maximum drawdown below the -0.618 Fibonacci level zone.
When the price reaches the maximum run-up, it only has a ~45% probability of moving further upward into the last two zones (25% + 19.44%). This indicates that setting a take profit at a higher level may have less than a 50% chance of success.
Conversely, when the price reaches its maximum drawdown, there is only an ~8% probability of moving further downward into the last drawdown zone. This could indicate a potential reversal.
⚙️ SETTINGS
Breakout Condition: Determines the type of breakout condition to track: "Price", "Volume", "Price & Volume".
Backtest Period: The maximum run-up and drawdown are detected within this bar period.
Price Breakout Period: Specifies the number of bars the price needs to break out from.
Volume Breakout Period: Specifies the number of bars the volume needs to break out from.
Trendline Confirmation: Confirms that the close price needs to be above the trendline.
📈 HOW TO USE
By understanding the probabilities of price movements to both the upside and downside, traders can set take profit and stop loss targets with greater accuracy.
For instance, placing a stop loss order below the zone with the highest probability minimizes the chances of being stopped out of a profitable trade. Conversely, setting a take profit target at the zone with the highest probability increases the win rate.
Additionally, if the price breaches multiple Fibonacci levels during the breakout period, it may indicate an abnormal state, signaling a potential reversal or pullback. This can help traders exit trades in a timely manner.
Traders can adjust their take profit and stop loss levels based on their individual risk tolerance.
RISK DISCLAIMER
Trading entails substantial risk, and most day traders incur losses. All content, tools, scripts, articles, and education provided by TradeDots serve purely informational and educational purposes. Past performances are not definitive predictors of future results.

Logarithmic and Linear Fibonacci LevelsIntroduction
Fibonacci levels are a technical analysis tool used by some traders to identify potential support and resistance levels. The principle for determining these levels is to take the distance between selected reference high and low points (swing high and swing low in general) as 1 unit and mark the ratios derived from the Fibonacci sequence, such as 0.236, 0.382, 0.618, etc., over this 1 unit. In the conventional method of level determination, the 1 unit is divided into equal distances within itself, and Fibonacci levels are determined based on these equal distances. These types of levels are called Linear Levels . A relatively less common method involves dividing the 1 unit into progressively smaller, more accurately described as proportionally equal, distances and determining Fibonacci levels based on these distances. These types are called Logarithmic Levels . The purpose of this indicator is to provide ease of use in determining both Linear and Logarithmic levels.
Where can it be Used?
Logarithmic Levels can be used in any instrument where volatility is high for any reason. Specifically in crypto, Logarithmic Levels work very well for BINANCE:BTCUSDT (to observe this, please study the wick from January 23, 2024). As another example, Logarithmic Levels can be used to identify potential accumulation and distribution schemes in altcoins with relatively high volume and market capitalization (refer to the chart provided above BINANCE:FETUSDT ). Additionally, when analyzing traditional markets, Logarithmic Levels can be beneficial for stocks with highly inflated or deflated prices (e.g., NASDAQ:TSLA , NASDAQ:NVDA ), in stock markets of countries battling high inflation (e.g., BIST:XU100 ), or in currency pairs of countries experiencing a recession (e.g., FX_IDC:JPYUSD ).
How can it be Used?
It is designed similarly to the Fibonacci Tool provided by Trading View to ensure users feel familiar with it. When you start the indicator, select the reference levels (Level 1 and Level 0), then click on the indicator settings to choose specific levels and customize them according to your preferences.
What Makes it Unique?
Indeed, in the Fibonacci Tool provided by Trading View, we can see both linear and logarithmic levels. However, to view logarithmic levels, it is necessary to switch the relevant instrument's Super Chart to a logarithmic scale. This causes the levels we want to remain 'linear' to also be displayed in their logarithmic form, potentially leading to errors in other indicators we use, incorrect functioning of trend lines drawn in linear scaling, and so on. Additionally, when the Super Chart is scaled logarithmically, it prevents the ability to set alerts for prices and trend lines. This indicator was created to avoid these problems without needing to change the chart's scaling method and to allow the simultaneous viewing of both Linear and Logarithmic levels.

Gann Box (Zeiierman)█ Overview
The Gann Box (Zeiierman) is an indicator that provides visual insights using the principles of W.D. Gann's trading methods. Gann's techniques are based on geometry, astronomy, and astrology, and are used to predict important price levels and market trends. This indicator helps traders identify potential support and resistance levels, and forecast future price movements.
Gann used angles and various geometric constructions to divide time and price into proportionate parts. Gann indicators are often used to predict areas of support and resistance, key tops and bottoms, and future price moves.
█ How It Works
The indicator operates by identifying high and low points within a visible range on the chart and drawing a Gann Box between these points. The box is divided into segments based on selected percentages, which represent key levels for observing market reactions. It includes options to display labels, a Gann fan, and Gann angles for analysis. Advanced features allow extending the box into the future for predictive analysis and reversing its orientation for alternative viewpoints.
High and Low Points Identification: It starts by locating the highest and lowest price points visible on the chart.
Gann Box Construction: Draws a box from these points and divides it according to specified percentages, highlighting potential support and resistance levels.
█ How to Use
Support and Resistance Levels
Using a Gann angle to forecast support and resistance is probably the most popular way they are used. This technique frames the market, allowing the analyst to read the movement of the market inside this framework.
The lines within the Gann Box, drawn at the key percentages, create a grid of potential support and resistance levels. As prices fluctuate, these lines can act as barriers to price movement, with the price often pausing or reversing at these intervals.
Forecasting with the 'Extend' Feature: The indicator's ability to extend lines and boxes into the future provides traders with a forward-looking tool to anticipate potential market movements and prepare for them.
Gann Fan: This feature draws lines at a significant price angle, helping traders identify potential support and resistance levels based on the theory that prices move in predictable patterns.
Gann Curves: Gann Curves display dynamic support and resistance levels, aiding in the analysis of momentum and trend strength.
█ Settings
The indicator includes several settings that allow customization of its appearance and functionality:
⚪ General Settings
Reverse: This setting changes the orientation of labels and calculations within the Gann Box, providing alternative analytical perspectives. It essentially flips the Gann Box's direction, which can be useful in different market conditions or analysis scenarios.
Extend: Extends the drawing of Gann lines or boxes into the future beyond the current last bar. This feature is essential for forecasting future price movements and identifying potential support or resistance levels that lie outside the current price action.
⚪ Gann Box
Show Box: Toggles the visibility of the Gann Box on the chart. The Gann Box is a fundamental tool in Gann analysis, highlighting key levels based on selected high and low points to identify potential support and resistance areas.
Show Fibonacci Labels: Controls the display of Fibonacci labels within the Gann Box. These labels mark specific Fibonacci retracement levels, aiding traders in recognizing significant levels for potential reversals.
Box Visibility: Allows users to enable or disable individual boxes within the Gann Box, providing flexibility in focusing on specific levels of interest.
Percentage Levels: Defines the Fibonacci levels within the Gann Box. Traders can adjust these levels to customize the Gann Box according to their specific analysis needs.
Coloring: Customizes the color of each level within the Gann Box, enhancing visual clarity and differentiation between levels.
⚪ Gann Fan
Show Fan: Enables the Gann Fan, which draws lines at significant Gann angles from a particular point on the chart, helping identify potential support and resistance levels.
Fan Percentages and Coloring: Similar to the Gann Box, these settings allow traders to customize which Gann angles are displayed and how they are colored.
⚪ Gann Curves
Show Curves: When enabled, this setting draws Gann Curves on the chart. These curves are based on Gann percentages and provide a dynamic view of support and resistance levels as they adapt to changing market conditions.
Curve Percentages and Coloring: Define which curves are displayed and their colors, allowing for a tailored analysis experience.
⚪ Gann Angles
Show Angles: Toggles the display of Gann Angles, which are crucial for understanding the market's price and time dynamics, offering insights into future support and resistance levels.
Coloring: Customizes the color of the Gann Angles, making it easier to differentiate between various angles on the chart.
█ Alerts
The indicator includes several alert conditions for price breakouts from the Gann Box and specific levels, enabling traders to be notified of significant market movements.
-----------------
Disclaimer
The information contained in my Scripts/Indicators/Ideas/Algos/Systems does not constitute financial advice or a solicitation to buy or sell any securities of any type. I will not accept liability for any loss or damage, including without limitation any loss of profit, which may arise directly or indirectly from the use of or reliance on such information.
All investments involve risk, and the past performance of a security, industry, sector, market, financial product, trading strategy, backtest, or individual's trading does not guarantee future results or returns. Investors are fully responsible for any investment decisions they make. Such decisions should be based solely on an evaluation of their financial circumstances, investment objectives, risk tolerance, and liquidity needs.
My Scripts/Indicators/Ideas/Algos/Systems are only for educational purposes!
