CHOP Zone Entry Strategy + DMI/PSAR ExitThis is a Strategy with associated visual indicators and Long/Short and Reverse/Close Position Alerts for the Choppiness Index (CHOP) . It is used to determine if the market is choppy (trading sideways) or not choppy (trading within a trend in either direction). CHOP is not directional, so a DMI script was ported into this strategy to allow for trend confirmation and direction determination; it consists of an Average Directional Index (ADX) , Plus Directional Indicator (+DI) and Minus Directional Indicator (-DI) . In addition, a Parabolic SAR is also included to act as a trailing stop during any strong trends.
Development Notes
---------------------------
This indicator, and most of the descriptions below, were derived largely from the TradingView reference manual. Feedback and suggestions for improvement are more than welcome, as well are recommended Input settings and best practices for use.
www.tradingview.com
www.tradingview.com
www.tradingview.com
Recommend using the below DMI and PSAR indicators in conjunction with this script to fully visualize and understand how entry and exit conditions are chosen. Variable inputs should correlate between the scripts for uniformity and visual compatibility.
THANKS to LazyBear and his Momentum Squeeze script for helping me quickly develop a momentum state model for coloring the Chop line by trend.
Strategy Description
---------------------------
CHOP produces values that determine whether the market is choppy or trending . The closer the value is to 100 , the higher the choppiness levels , while the closer it is to 0 , the stronger the market is trending . Territories for both levels, and their associated upper and lower thresholds, are popularly defined using the Fibonacci Retracements, 61.8 and 38.2.
Basic Use
---------------------------
CHOP is often used to confirm the market condition to help you stay out of sideways markets and only enter when there is movement or imminent explosions. When readings are above the upper threshold, continued sideways movement may be expected, while readings below the lower threshold are typically indicative of a continuing trend. It is also used to anticipate upcoming trendiness changes, with the general belief that extended periods of consolidation (sideways movement) are followed by extended periods of strong, trending, directional movement, and vice versa.
One limitation in this index is that you must be cautious in deciding whether the range or trend will likely continue, or if it will reverse.
Confidence in price action and trend is higher when two or more indicators are in agreement -- while this strategy combines CHOP with both DMI and PSAR, we would still recommend pairing with other indicators to determine entry or exit trade opportunities.
Recommend also choosing 'Once Per Bar Close' when creating alerts.
Inputs
---------------------------
Strategy Direction - an option to only trade Short, Long, Both, or only in the direction of the Trend (Follow Trend is the Default).
Sensitivity - an incremental variable to test whether the past n candles are in the same trend state before triggering a delayed long or short alert (1 is the Default). Can help filter out noise and reduces active alerts.
Show Chop Index - two visual styles are provided for user preference, a visible Chop line with a background overlay, or a compact column and label only view.
Chop Lookback Period - the time period to be used in calculating CHOP (14 is the Default).
Chop Offset - changing this number will move the CHOP either forwards or backwards relative to the current market (0 is the Default).
Smooth Chop Line and Length - if enabled, the entered time period will be used in calculating a smooth average of the index (Enabled and 4 are the Defaults).
Color Line to Trend Direction - toggles whether the index line is colored to visually depict the current trend direction (Enabled is the Default).
Color Background - toggles the visibility of a background color based on the index state (Enabled is the Default).
Enable DMI Option - if enabled, then entry will be confirmed by and dependent on the ADX Key Level, with any close or reversal confirmed by both ADX and +/-DI to determine whether there is a strong trend present or not (Enabled is the Default).
ADX Smoothing - the time period to be used in calculating the ADX which has a smoothing component (14 is the Default).
DI Length - the time period to be used in calculating the DI (14 is the Default).
ADX Key Level - any trade with the ADX above the key level is a strong indicator that it is trending (23 to 25 is the suggested setting).
Enable PSAR Option - enables trailing stop loss orders (Enabled is the Default).
PSAR Start - the starting value for the Acceleration Force (0.015 is our chosen Default, 0.02 is more common).
PSAR Increment - the increment in which the Acceleration Force will move (0.001 is our chosen Default, 0.02 is more common).
PSAR Max Value - the maximum value of the Acceleration Factor (0.2 is the Default).
Color Candles Option - an option to transpose the CHOP condition levels to the main candle bars. Note that the outer red and green border will still be distinguished by whether each individual candle is bearish or bullish during the specified timeframe.
Note too that if both DMI and PSAR are deselected, then close determinations will default to a CHOP reversal strategy (e.g., close long when below 38.2 and close short when above 61.8). Though if either DMI or PSAR are enabled, then the CHOP reversal for close determination will automatically be disabled.
Indicator Visuals
---------------------------
For the candle colors, black indicates tight chop (45 to 55), yellow is loose chop (38.2 to 45 and 55 to 61.8), dark purple is trending down (< 38.2), and dark blue is trending up (> 61.8).
The background color has additional shades to differentiate a wider range of more levels…
• < 30 is dark purple
• 30 to 38.2 is purple
• 38.2 to 45 is light purple
• 45 to 55 is black
• 55 to 61.8 is light blue
• 61.8 to 70 is blue
• > 70 is dark blue
Long, Short, Close, and Reverse labels are plotted on the Chop line, which itself can be colored based on the trend. The chop line can also be hidden for a clean and compact, columnar view, which is my preferred option (see example image below).
Visual cues are intended to improve analysis and decrease interpretation time during trading, as well as to aid in understanding the purpose of this strategy and how its inclusion can benefit a comprehensive trading plan.
DMI and Trend Strength
---------------------------
To analyze trend strength, the focus should be on the ADX line and not the +DI or -DI lines. An ADX reading above 25 indicates a strong trend , while a reading below 20 indicates a weak or non-existent trend . A reading between those two values would be considered indeterminable. Though what is truly a strong trend or a weak trend depends on the financial instrument being examined; historical analysis can assist in determining appropriate values.
DMI exits trade when ADX is below the user selected key level (e.g., default is 25) and when the +/- DI lines cross (e.g., -DI > +DI exits long position and +DI > -DI exits short position).
PSAR and Trailing Stop
---------------------------
PSAR is a time and price based indicator that excels at measuring direction and duration, though not the actual strength of a trend, which is why we use this in conjunction with DMI. It is also included in this script as a trailing stop option to maximize gains during strong trends and to mitigate any false ADX strengthening signals.
This creates a parabola that is located below the candle during a Bullish trend and above during a Bearish trend. A buy or reversal is signaled when the price crosses above or below the Parabolic SAR.
Long/Short Entry
---------------------------
1. CHOP must be over 61.8 (long) or under 38.2 (short).
2. If DMI is enabled, then the ADX signal line must be above the user selected Key Level (default is 25).
3. If Sensitivity is selected, then that past candle must meet the criteria in step 1, as well as all the intermediate candles in between.
4. If "Follow Trend" is selected and PSAR is enabled, then a long position can only open when the momentum and PSAR are in an uptrend, or short when both are in a downtrend, to include all intermediate candles if the Sensitivity option is set on a past candle.
Close/Reverse
---------------------------
1. If DMI is enabled, then a close flag will be raised when the ADX signal drops below the Key Level (of 25), and -DI crosses over +DI (if long), or +DI crosses over -DI (if short).
2. If PSAR is enabled, then a close flag will be raised when the current trend state is opposite the last state.
3. If both DMI and PSAR are disabled, then a close flag will be raised if the Chop line drops under 38.2 (if long) or goes over 61.8 (if short).
4. If a Long or Short Entry is triggered on the same candle as any of the above close flags, then the position will be reversed, else the position will be closed.
Strategy Alerts
---------------------------
1. Long Entry
2. Short Entry
3. Reverse
4. Close
The provided backtest result is based on a position sizing of 10% equity with 100k initial capital. When testing SPX, disabling the DMI performed the best, but EURUSD performed poorly without it enabled, and TSLA had a small reduction in net profit. Timeframe likewise differed between commodities with TSLA performing best at 30M, SPX at 15M, and EURUSD at 4H. I do not plan on using this as a standalone strategy, but I also was expecting better results with the inclusion of EMI and PSAR to compliment the CHOP. Key elements of this script will likely be included in future, more holistic strategies.
Disclaimer
---------------------------
Past performance may not be indicative of future results. Due to various factors, including changing market conditions, the strategy may no longer perform as well as in historical backtesting. This post and the script are not intended to provide any financial advice. Trade at your own risk.
No known repainting, though there may be if an offset is introduced in the Inputs. I did my best not to code any other variables that repaint, but cannot fully attest to this fact.
Exit

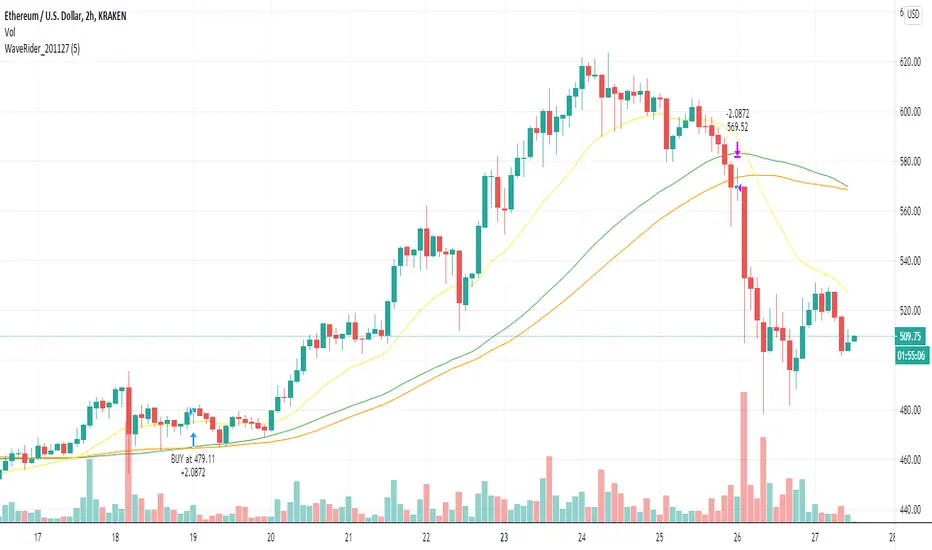
The WaveRider - Help me to exit position!Hello,
I always like to refer to my previous articles to allow people to understand where am I in terms of knowledge at the time when I write this article.
BTC and ETH Long strategy version 1
BTC and ETH Long strategy version 2
Although some part of my crypto trading is automated via HaasOnline software, I like to take discretionary trades to feel the excitement of manual trading, especially during bull market :).
I write this new article and script because I did struggle to decide when to exit a recent LONG position on Ethereum.
Most of the novice traders struggles to know when to exit the position when gains are made.
The is exactly what happens to many people trading cryptos in the beginning of this bull market.
We always want more, we want to ride the wave as much as possible.
We see the gains growing every day and don't want to exist the position because tomorrow will bring more gains.
Yes, but sometimes there is a small retracement, the price is bleeding slowly but we want to hold because the price will move UP again in one of two days.
So the big question is went to exit (or not).
This subject is a difficult one because we are humans and highly influenced by our psychology.
Depending on the mood we are in, we can take different decisions.
If we are not feeling good and we are not in good mood, we will probably close a winning position as soon as a retracement comes in to keep our gains because we see this retracement as something bad.
On the other side, if we feel good and are in a good mood that day, we might take to opposition decision and keep the trade running as we believe that this retracement is something healthy for the price to allow it to continue to move up.
For novice traders, these emotions can impact the way how we trade and create frustrations if we exit a position too soon or too late.
So, why not to let a script giving us advices on this decision? If we are not sure if we should exit or not, this script might help us to take a better decision.
I have named this script the "WaveRider" because it is supposed to be used during bull market only when the asset is moving up.
Best time frame to use with crypto such as Bitcoin and Ethereum are 2H, 4H and 6H candles.
Even if it can also give you entry points to open a trade, the goal of this script is more to give you exit points.
So, if you have opened a trade manually and you are wondering if this is the right time to close it, this script is made for you.
Technically, entry points are based on 2 Moving averages (slow and fast). We can enter in position when crossing over.
The Position can be closed if the same Moving averages are crossing down. In addition, it will exit if the price suddenly drops below the Moving average.
I know it sounds simple and stupid, but sometimes we don't ask ourselves the right questions when taking the decision to exit a position. So, this script will remind you the basic stuff to consider before closing your position.
I hope that such idea will help you to take good exit decisions in the future.
Let me know if you need more details or want to access it.
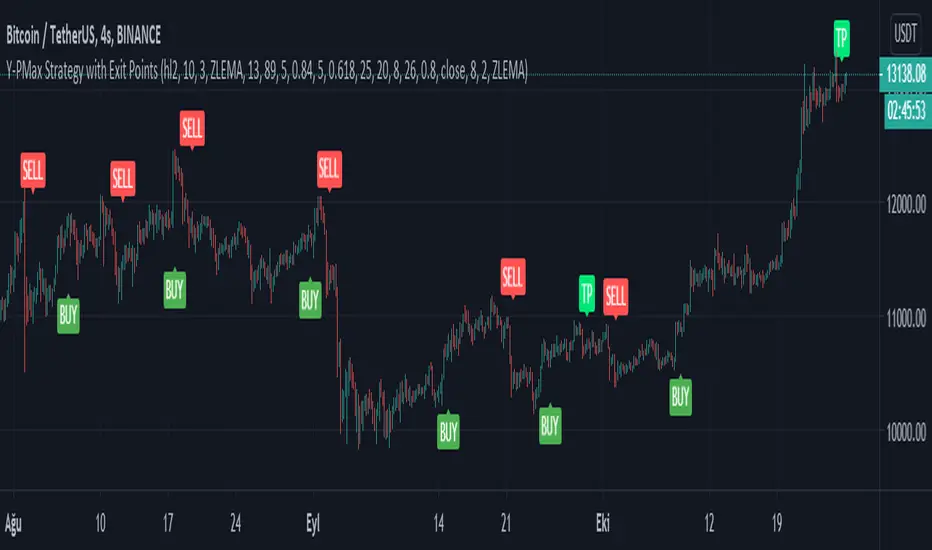
Y-Profit Maximizer Strategy with Exit PointsThis script based on KivancOzbilgic 's PMax indicator. I modified a bit. Added Filters, Exit (TP) Levels and few indicator in it. This script opening only Long Positions.
I have used this indicators in this strategy:
-Moving Stop Loss (Most) by ceyhun
-PMax Explorer STRATEGY & SCREENER
-Bollinger Bands on Macd
-Tillson T3 Moving Average by KIVANÇ fr3762
I am open to suggestions for improve this script.
PS: Script is in Turkish Language.
CCI - SWIFF KNIFECCI indicator swiff knife.
A lot of different usages of CCI ae possible with this script :
- 2 CCI lines crossovers.
- CCI - 0 Line crossovers
- CCI + Moving Average crossovers (many types of MA are available)
Filters can be added.
CCI can be used as a confirmation indicator, a continuation indicator, an exit indicator, a chopiness indicator .... It can even make coffee, who knows.

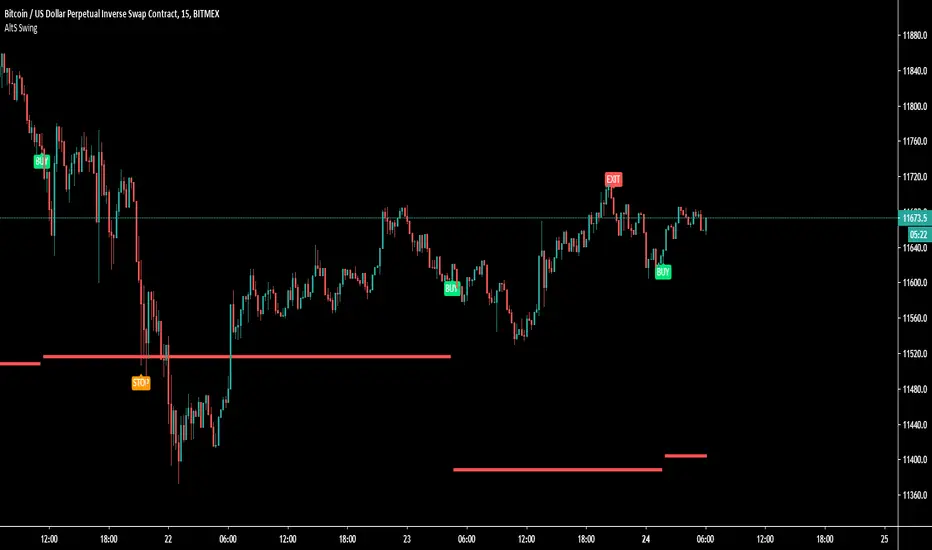
AltS Swing (INV)
PLEASE READ THIS DESCRIPTION TO SAVE TIME AND UNDERSTAND WHAT THIS INDICATOR DOES
This is a official version of AltSignals Long/Short Reverse Indicator
Description:
This indicator uses various indicators in combination with each other, some of the key ones to mention is Hulls, EMA , MA. Along with that it uses EMA crossovers to get the precise entries and exits.
The recommended time frames with this indictor are shorter ones, for example 5m,10m,15m work well, along with that I have found that some of the more unique time frames also work well such as 20m,45m,2hr and so on.
This indicator is not super advanced but it's still very powerful, with only 130 lines of code.
This indicator works on every chart, time, and candle type but you must play with the settings to find what is best, the same setting will not work on every pair etc.
With AltSignals Swing Indicator it trades one way, that means it gives 3 pieces of information. BUY/TakeProfit/StopLoss.
Unlike most indicators which Buy and Sell both ways this one focuses on one direction of trading so please take into account when using this.
I have added in a reverse strategy which basically shows the opposite values of of the buy, so if you select the box in the settings and un-tick it, then it will show opposite directions so sells only.
This feature is very useful especially in general bear markets when buying is difficult.
I have also added in the option for no stop losses to be used, if you set the stop loss value = 100 then it will show no stop losses.
I suggest a stop loss somewhere in the region of 1-2-3%, please note that you can use decimal stop losses too so for example 0.1 or 0.5.
This indicator is NOT a once size fits all, every chart is different, time frame and candles also, so i would suggest spending some time going through and playing with the channel length settings, which will change the EMA numbers.
Using this along with the back script to find the ideal settings is the best way to use this script, once you have done that make sure to save those values somewhere.
Its important to remember that the Regular script and the back testing script values should be the same for them to match up on the chart, so the channel lengths, stop losses and so on values should be the same.
Side note
This is not financial advice.
We will continue making updates as time goes on.
If you would like to try this script for free please visit our website or message us on Tradingview live chat.
CDub's BolBands SetupUses a set of Bollinger Bands (user defined deviation, user defined deviation * 2) to determine possible entry set ups.
Signals are triggered when price crosses the first band (closest to the baseline MA) in the desired direction.
baseline can be your take profit 1 target
The inside band determines entry and can be used as a take profit 2 target (Opposite side of baseline)
The outside band is a suggested stop loss target (Same side of baseline) and can be used as a take profit 3 target (Opposite side of baseline)
Suggestions are welcome!
-CDub

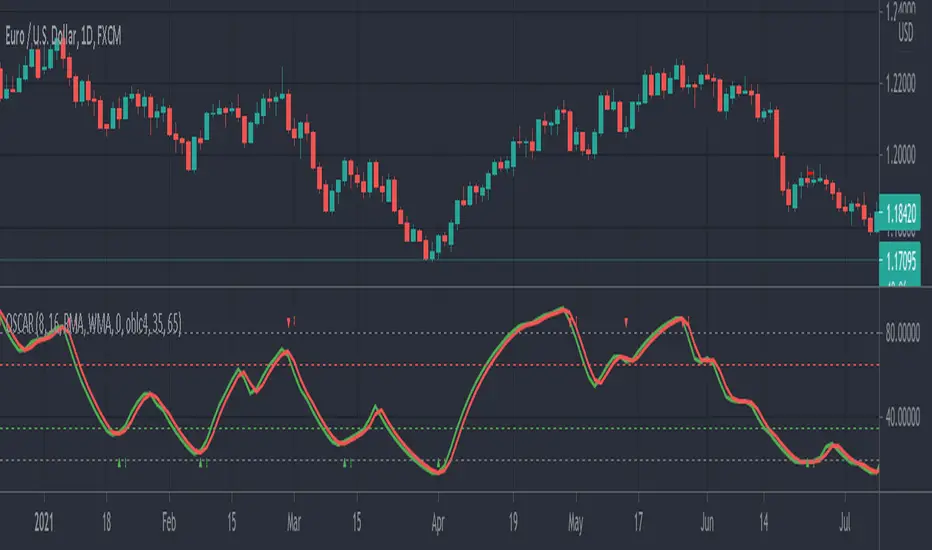
OSCAR Oscillator by GenZai - NNFXOSCAR Oscillator by GenZai
Green line is the Oscar Rough
Red line is the Oscar
By default based on the 8 last candles and smoothed using RMA
Purple line is the Slow Oscar
By default based on the 16 last candles and smoothed using WMA
HOW TO USE
Exit signaling
This indicator can be used as an exit indicator when line cross each other.
Entry signaling
When the green line crosses up, it indicates a long entry
When the red line crosses up, it indicates a short entry
Overbought/Oversold
When the indicator crosses the dashed grey lines it indicates Overbought Oversold
Slow Oscar Add-on
This is an Add-on to the orignal Oscar indicator
Can be hidden if you want the original experience of the Oscar indicator.
Can be used as a confirmation indicator by looking at the direction of the slope to verify is your are trending long or trending short.
Can be used as a baseline to confirm signals given by Oscar
Can be used to tweak your signals and test different settings.
Stock or Forex?
The program was originally written for stocks, but works equally well with the Forex market.
How this indicator is calculated ?
This is the formula we use to calculate the Oscar:
let A = the highest high of the last eight days (including today)
let B = the lowest low of the past eight days (including today)
let C = today's closing price
let X = yesterday's oscillator figure (Oscar)
Today's "rough" oscillator equals (C-B) divided by (A-B) times 100.
Next we "smooth" our rough number (let's call it Y) like this:
Final oscillator number = ((X divided by 3) times 2), plus (Y divided by 3).
SETTINGS:
You can choose between different smoothing options:
RMA: Moving average used in RSI. It is the Adjusted exponential moving averages (also known as Wilder's exponential moving average)
SMA : Simple moving average
EMA : Exponential moving average
WMA : Weighted moving average
FauxLife EFIModification to Elder's Force Index (EFI)
Ability to change calculation from standard EMA to your choice of SMA, EMA, WMA, or HMA. Very interesting results!
Adjust lookback from standard/suggested 13 candlesticks
Added a color indication to positive or negative force reading
Added background color tint for an easier read on dashboard setups
Suggested pair with my On Balance Volume with Cross to use as a filter & entry/exit setup. Enter or exit trades when the two indicators switch at the same time or within 1-2 candlesticks of each other.

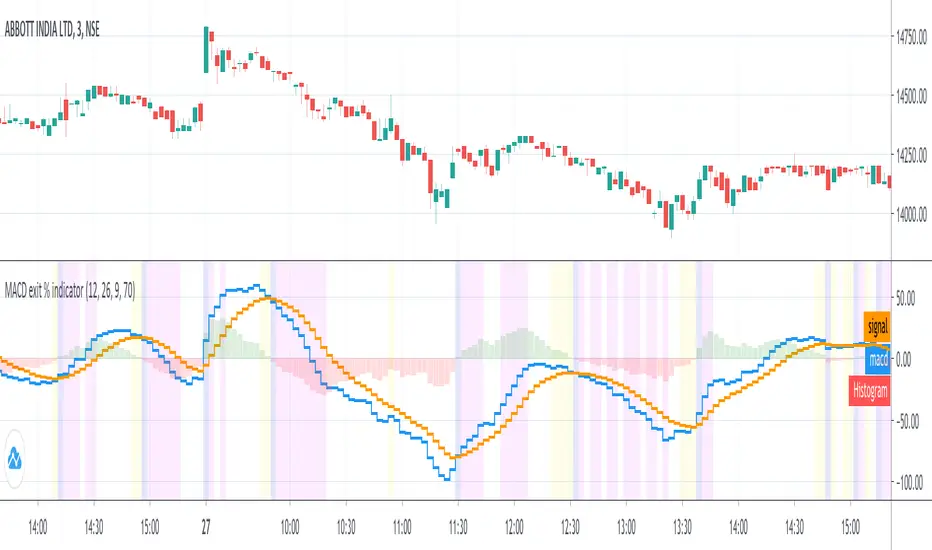
MACD exit % indicatorIntroduction
An exit indicator for MACD, good for triggering order exit via MACD.
It works by considering and the .
Then, it just exits when the % change in these values surpasses a threshold.
Indicators
blue line - MACD
orange line - Signal
green/red columns - Histogram
aqua background - Last Histogram Flip
fuchsia background - Max abs(Histogram) value after last flip
orange Background - Exit region
TradeChartist MTF RSI Spotter™TradeChartist MTF RSI Spotter is an elegant Multi Timeframe RSI tool that helps spot price trends using visually engaging and appealing RSI plots and backgrounds compared to the basic RSI plot. Also the Bull and the Bear background fills + HTF RSI based background fills are highly useful for traders who like to visually understand areas of entry and exit based on RSI .
What does ™TradeChartist MTF RSI Spotter do?
Plots RSI with visually spottable colors for Bull and Bear zones (Green and Red) with optional background fill.
Plots RMA based on User specified length.
Plots user preferred HTF RSI on same chart as chart TF - HTF resolution from indicator settings drop-down must be used.
Fills Bull and Bear zone colors based on HTF based RSI movement.
Spots Regular RSI Bullish and Bearish Divergences.
Plots RSI color candles on main chart based on Upper and Lower RSI band.
Plots RSI based on RSI smoothing (1 for Regular RSI without smoothing) and Heikin Ashi RSI if opted from indicator settings.
This indicator works like a dream when used with other indicators for confirmation of Trends.
Note 1: Divergences don't work to trader's expectations all the time. It is a great indicator but has to be used with caution and entries must be confirmed using another indicator like Volume , Trend, fundamentals, market sentiment etc. They can't be used on their own to decide entry and exit.
Note 2: Bull and Bear RMA with chart TF RSI should be used for confirmation and not as a standalone indicator for entry and exit.
Example charts
Premium Scripts - Trial access and Information
Trial access offered on all Premium scripts.
PM me directly to request trial access to the scripts or for more information.

Z Score Enhanced Time Segmented Volume (Multi MA)**THIS VERSION HAS BEEN STANDARDIZED WITH A Z SCORE CALCULATION AND ALLOWS THE USER TO SELECT WHICH MOVING AVERAGE THEY WOULD LIKE TO UTILIZE FOR THE SIGNAL LINE**
Chart shows the Non-Standardized Enhanced Time Segmented Volume (Multi MA) with default settings on top and the Standardized version with default settings on the bottom.
Time Segmented Volume was developed by Worden Brothers, Inc to be a leading indicator by comparing various time segments of both price and volume . Essentialy it is designed to measure the amount of money flowing in and out of an instrument.
Time Segmented Volume was originally ported to TradingView by user @liw0 and later corrected by user @vitelot. I never quite understood how to read Time Segmented Volume until I ran across a version by user @storma where they indicated when price would be long or short, but that code also utilized the incorrect calculation from user @liw0.
In an effort to make Time Segmented Volume more accessible and easier to read, I have re-coded it here. The calculations are based on the code from @vitelot and I have added direction indicators below the chart.
If the histogram (TSV) is greater than zero and greater than the moving average, price should be moving long and there will be a green box below the chart.
If TSV falls below the moving average while still being greater than zero, the trend may be exhausting and has been coded to read Price Action Long - FAILURE with a black x below the chart.
If the histogram (TSV) is less than zero and less than the moving average, price should be moving short and there will be a red box below the chart.
If TSV rises above the moving average while still being less than zero, the trend may be exhausting and has been coded to read Price Action Short - FAILURE with a black x below the chart.
At times, the moving average may be above zero while TSV is below zero or vice versa. In these situations the chart will indicate long or short based on whether or not TSV is greater or less than zero. It is possible a new trend may be forming as the moving average obviously lags, but also possible price is consolidating with little volume and causing TSV to oscillate close to zero.
**Z Score // Standardized Option **
Thist Standardized code implements all of the above but also allows the user to select a threshold level that should not need to be adjusted for each instrument (since the output is standardized).
If the TSV value meets the long and short signal requirements above and TSV is greater than the threshold values a green or red box will print ABOVE the oscillator. The histogram will also change color based on which threshold TSV has met.
This calculation allows us to compare current volatility to the mean (moving average) of the population (Z-Length). The closer the TSV Z-Score is to the mean, the closer it will be to the Zero Line and therefore price is likely consolidating and choppy. The farther TSV Z-Score is from the mean, the more likely price is trending.
The MA Mode determines the Moving Average used to calculate TSV itself. The Z-Score is ALWAYS calculated with a simple moving average (as that is the standard calculation for Z-Score).
The Threshold Levels are the levels at which TSV Z-Score will change from gray to yellow, orange, green ( bullish ), or red ( bearish ).
Statistically speaking, confidence levels in relation to Z-Score are noted below. The built in Threshold Levels are the positive and negative values for 90%, 95%, and 99%. This would indicate when volatility is greater than these values they are out of the ordinary from the standard range. You may wish to adjust these levels for TSV Z-Score to be more responsive to your trading needs
80% :: 1.28
85% :: 1.44
90% :: 1.64
95% :: 1.96
99% :: 2.58
The Z Length is the period for which the Z Score is calculated
More information regarding Time Segmented Volume can be found here: www.worden.com
Original code ported by @liw0
Corrected by @vitelot
Updated/Enhancements by @eylwithsteph with inspiration from @storma
Multiple MA Options Credits to @Fractured and @lejmer
Bits and Pieces from @AlexGrover, @Montyjus, and @Jiehonglim
As always, trade at your own risk.

Enhanced Time Segmented Volume (Multi MA)**THIS VERSION ALLOWS THE USER TO SELECT WHICH MOVING AVERAGE THEY WOULD LIKE TO UTILIZE FOR THE SIGNAL LINE**
Chart shows two different options of many. Top option is the default settings and bottom option is a different moving average with no other changes.
Time Segmented Volume was developed by Worden Brothers, Inc to be a leading indicator by comparing various time segments of both price and volume. Essentialy it is designed to measure the amount of money flowing in and out of an instrument.
Time Segmented Volume was originally ported to TradingView by user @liw0 and later corrected by user @vitelot. I never quite understood how to read Time Segmented Volume until I ran across a version by user @storma where they indicated when price would be long or short, but that code also utilized the incorrect calculation from user @liw0.
In an effort to make Time Segmented Volume more accessible and easier to read, I have re-coded it here. The calculations are based on the code from @vitelot and I have added direction indicators below the chart.
If the histogram (TSV) is greater than zero and greater than the moving average, price should be moving long and there will be a green box below the chart.
If TSV falls below the moving average while still being greater than zero, the trend may be exhausting and has been coded to read Price Action Long - FAILURE with a black x below the chart.
If the histogram (TSV) is less than zero and less than the moving average, price should be moving short and there will be a red box below the chart.
If TSV rises above the moving average while still being less than zero, the trend may be exhausting and has been coded to read Price Action Short - FAILURE with a black x below the chart.
At times, the moving average may be above zero while TSV is below zero or vice versa. In these situations the chart will indicate long or short based on whether or not TSV is greater or less than zero. It is possible a new trend may be forming as the moving average obviously lags, but also possible price is consolidating with little volume and causing TSV to oscillate close to zero.
More information regarding Time Segmented Volume can be found here: www.worden.com
Original code ported by @liw0
Corrected by @vitelot
Updated/Enhancements by @eylwithsteph with inspiration from @storma
Multiple MA Options Credits to @Fractured and @lejmer
Bits and Pieces from @AlexGrover, @Montyjus, and @Jiehonglim
As always, trade at your own risk.

Highs & Lows of Last [x] Bars===========
Highs & Lows of Last Bars
===========
We have found this indicator invaluable over the past few years - whether you prefer to trade Crypto, Forex, Commodities or something else this indicator could prove really useful. It's always nice to know the highs and lows of the last Week or Month, the problem being the information is only really relevant at the start or end of that chosen time period; throughout the mid-section of that time period the chart will either be displaying irrelevant information or info that has been/is being re-painted. Not good!
Our Highs & Lows of Last Bars Indicator will remove this re-painting problem and display up-to-date information from higher time frames without compromising the integrity of your current chart period.
-----------
Most high & low finder indicators will use, (for example), a 'W' or 'M' as their higher TF to get HTF results - we do things just a little bit differently, it's like this:
Most other High/Low Indicators:
~ MON 1st (get high/low value from 'W' TF) ~
~ MON 8th (get new data and plot from 'W' TF)
etc. - This leads to gaps in the data, re-painting and missing lots of potential mid-week trades.
Our High & Low of Last Bars:
~ MON 1st (get high/low value from LAST 7 DAYS) ~
~ TUE 2nd (get high/low value from LAST 7 DAYS) ~
etc.
This provides a much smoother High/Low plot with more relevant information. You can clearly see areas of support and resistance, updated on the LTF chart using data from a HTF.
Because we've included 2 TF's you can use simultaneously you can see when the lower TF touches the Higher TF this (generally, but not always!) means there's a breakout coming!
Hope this is useful to you guys!
Good Luck and Happy Trading!

Areas of Support/Resistance & BreakoutA pretty little indicator showing pivotal breakouts - that is, locating critical pivot points within price action, connecting the dots and trading the breakouts from this area!
-----------
Useful for finding good entry levels, exit levels, areas of strong support/resistance and most importantly - the Breakout!
Includes "Bars to the Left" variable so you can shorten or lengthen the indicator as required.
Good Luck and Happy Trading!

[redxbt] MA exit modified special thanks to redxbt for the script code
modified for 55,99 EMA's
dip and tip points
green and lime are dips for buying
red and orange are tops for selling
works best on 5,10 min scalping charts

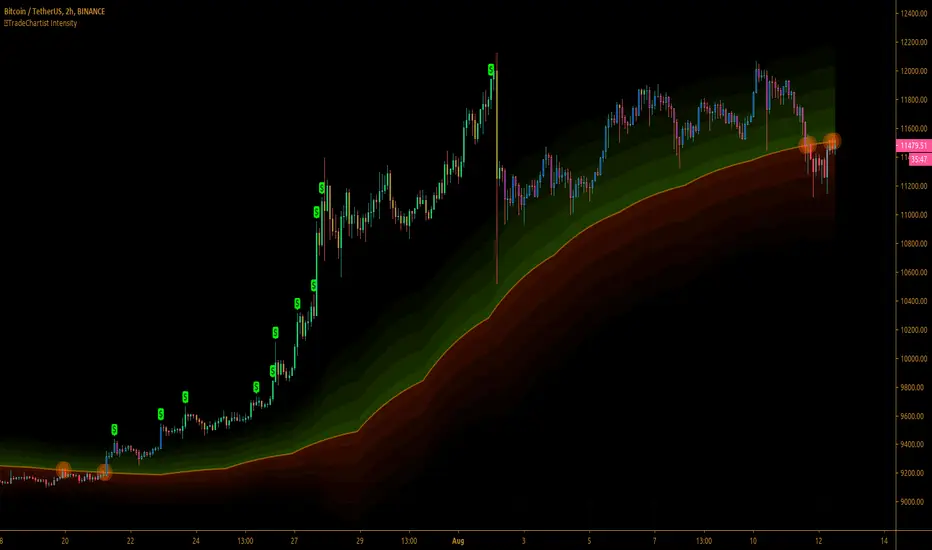
™TradeChartist Intensity™TradeChartist Intensity is a visual indicator that comes with Intensity color candles and Auto-fibs feature that helps any trader with Entry/Exit and levels confirmation based on where the price is, in relation to the Orange Price Equilibrium line and the 5 zones of Bull/Bear limits that fade into the top or bottom outer space.
™TradeChartist Intensity itself doesn't plot BUY or SELL signals, but when used with ™TradeChartist Rubicon gives a better picture for trade confirmations. It can also be used as a standalone indicator and works equally effective with other traditional and non-traditional indicators.
The indicator comes with simple settings with useful features outlined below.
Intensity Color Candles
Intensity Color Candles when activated from settings paints the candles/bars with colors specific to the Bull/Bear limits or the outer space and is easy to identify the signal strength over time.
Uptrend - The bars/candles move away from the Orange Price Equilibrium line towards the upper Bull limits with bar color fading slowly leading to outer space where the bar color turns neon green.
Downtrend - The bars/candles move away from the Orange Price Equilibrium line towards the lower Bear limits with bar color fading slowly leading to outer space where the bar color turns neon red.
When the price candle wick or body touches the Orange Price Equilibrium line, distinct torchlight circle appears to signal the trader of a potential change in price direction which can be used as a signal confirmation in conjunction with another indicator before taking a trade position.
Show Auto Fib Levels
Auto Fib Levels plot automatic Fib levels based on significant Highs and Lows based on Intensity strategy which mostly are reference prices of recent highest high above Orange Equilibrium price line and recent lowest low below the Orange Equilibrium price line.
15m XBT chart with 'Show Auto Fib Levels' checked and 'Show Fibs from current High/Low' unchecked under indicator settings
These Auto Fib Levels change when the price movement/trend changes direction and will be based on trending price direction.
Show Fibs from current High/Low
When this option is chosen from indicator settings, the auto fib levels are drawn from the highest high of the trending price direction to lowest low of last trend for uptrend or vice-versa for downtrend.
15m XBT chart as above with 'Show Fibs from current High/Low' unchecked under indicator settings
Show Profit Candles
Activating this option from indicator settings will automatically plot $ labels above candle highs that hit important resistance levels during uptrend and candle lows that hit important support levels during downtrend. This will help traders take out profits during trades based on their personal profit goals and realistic trade targets based on momentum/RSI/volatility etc.
Example chart of XAUUSD 1hr Gold chart showing both Long and Short trade Profit candles
Give a thumbs up or leave a comment if you like the script.
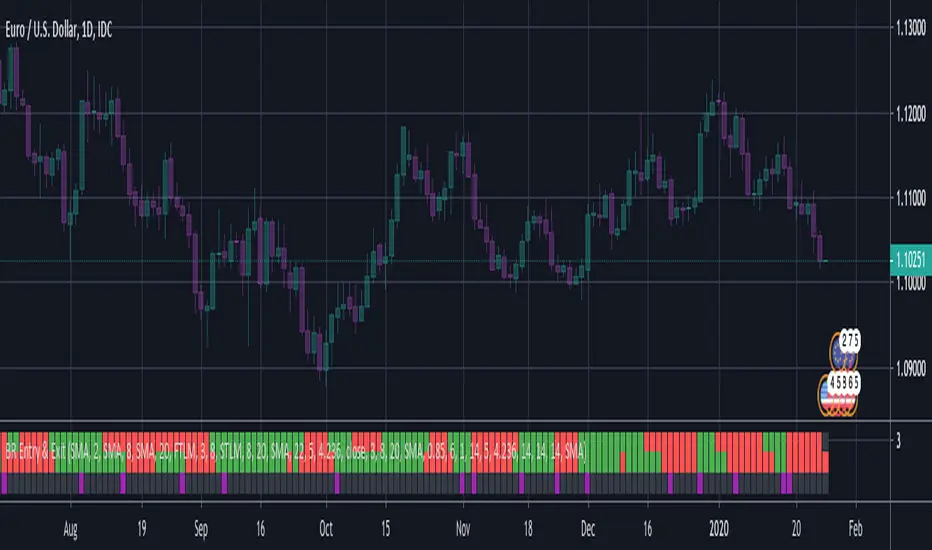
BERLIN Renegade - Entry and ExitThis is the entry and exit part of a larger algorithm called the "BERLIN Renegade". It is based on the NNFX way of trading, with some modifications.
For entry, it consists of Modified Chaikin Oscillator and Advanced MACD. The Advanced MACD is not available on its own, but all others are publically
available.
For exit it consists of the DIDI Index and the QQE line (original idea by Jie). Special thanks to Michael Kuczynski for the idea to include the FTLM digital filter.
Long signal: Green bars (upper and lower are both green)
Short signal: Red bars (upper and lower are both red)
Exit signal: Purple bars (bottom) - DIDI Index with QQE line
Uber REX Oscillator [UTS]The Rex Oscillator measures market behavior based on the relationship of the close to the open, high and low values of the same bar. A big difference between the high and close on a bar indicates weakness, and wide disparity between the low and close indicates strength. The difference between open and close also indicates market performance.
When the Rex Oscillator turns positive in a bearish trend, a reversal is indicated. Likewise, Rex turning negative in a bull market indicates a reversal to the downside.
General Usage
The Rex Oscillator is mostly used as a Reversal and Exit indicator.
Signals are created when Rex is crossing the Signal line. They that can be used to EXIT or LONG/SHORT a trade.
It is worth investing the time and fine-tune the settings: e.g. SuperSmoothed 16 and HMA 40 provides decent results.
Moving Averages
16 different Moving Averages are available:
ALMA (Arnaud Legoux Moving Average)
DEMA (Double Exponential Moving Average)
EMA (Exponential Moving Average)
FRAMA (Fractal Adaptive Moving Average)
HMA (Hull Moving Average)
JURIK (Jurik Moving Average)
KAMA (Kaufman Adaptive Moving Average)
Kijun (Kijun-sen / Tenkan-sen of Ichimoku)
LSMA (Least Square Moving Average)
RMA (Running Moving Average)
SMA (Simple Moving Average)
SuperSmoothed (Super Smoothed Moving Average)
TEMA (Triple Exponential Moving Average)
VWMA (Volume Weighted Moving Average)
WMA (Weighted Moving Average)
ZLEMA (Zero Lag Moving Average)
A freely determinable length allows for sensitivity adjustments that fits your own requirements.
Alerts
Traders can easily use the reversal signal to trigger alerts from:
Cross Up
Cross Down
Those values are > zero if a condition is triggered.
Alert condition example: "Cross Up" - "Greater Than" - "0"
Trend Visualization
Optional: If the signal line trend direction is DOWN it is painted red. If the trend direction is UP the signal line is painted in green.

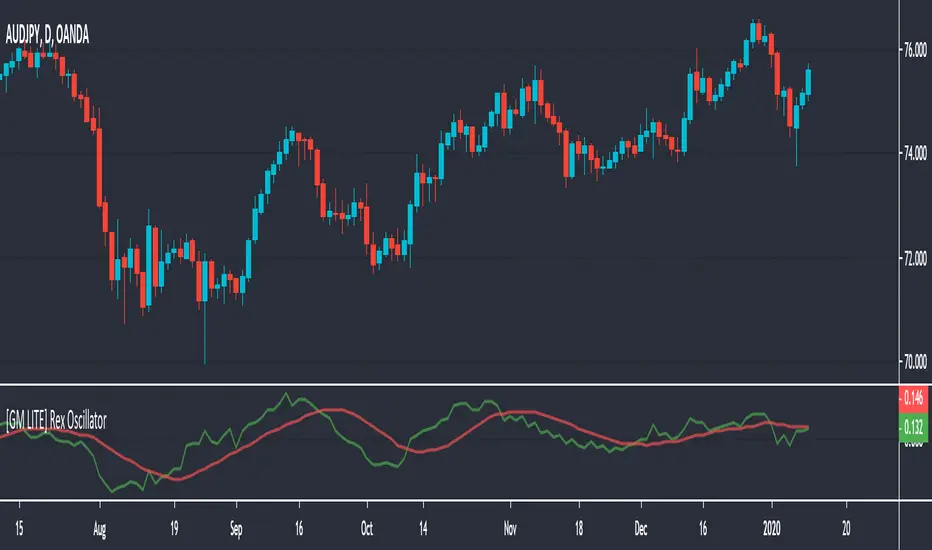
[GM LITE] Rex OscillatorThe Rex oscillator measures market behavior based on the relationship of the close to the open, high and low values of the same bar. A big difference between the high and close on a bar indicates weakness, and wide disparity between the low and close indicates strength. The difference between open and close also indicates market performance.
The True Value of a Bar (TVB) gives an indication of how healthy the market is. A negative close and a positive TVB (or vice versa) is an indication of the market building strength on the opposing side of the trend. The Rex oscillator is a moving average (SMA, EMA, WMA or SMMA) of the TVB value with the specified period.
This is a direct conversion of the MT4 MQL script.
The MA Settings are as follows
0 - SMA
1 - EMA
2 - SMMA
3 - LWMA
Usage - two lines cross = entry or exit signal.
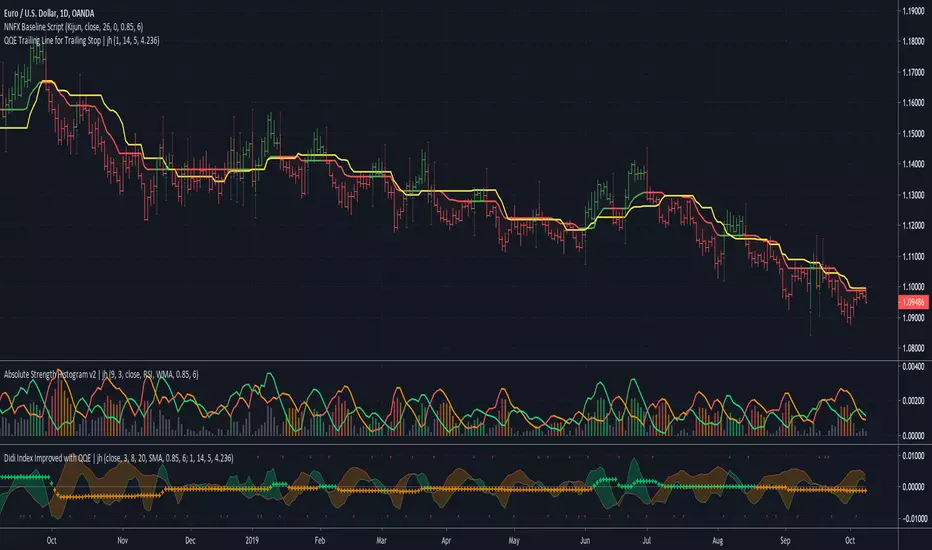
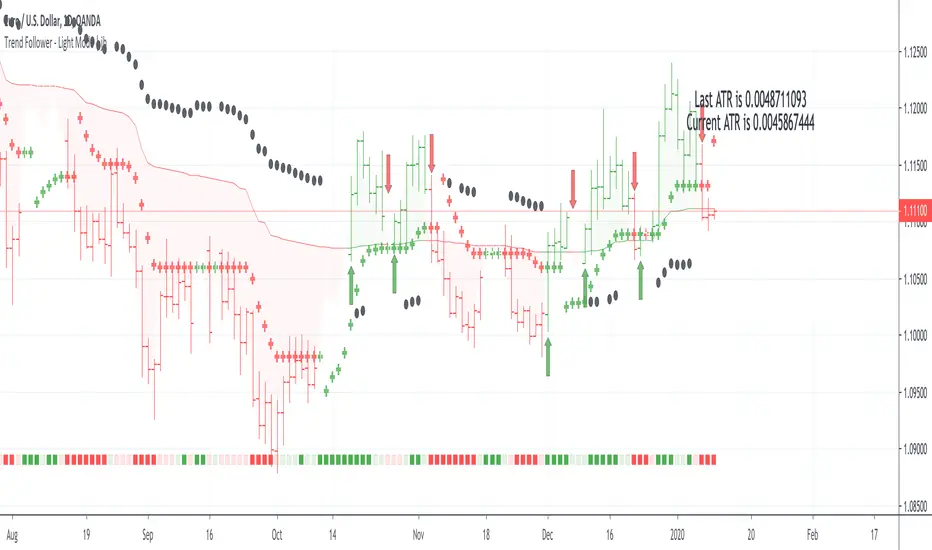
Trend Follower - Light Mode | jhFollow up script for my Trend Follower script.
I'm used to dark mode, so I coded a few key plots in white, so those are changed into black on the script.
Notably:
- > 1 ATR in black dots along the baseline
- Current and previous ATR text labels to the right of the price
- A text label spacing input that allows you to adjust the spacing for text label from price.
This is a trend following system that combines 3 indicators which provide different functionalities, also a concept conceived by VP's No Nonsense FX / NNFX method.
1. Baseline
The main baseline filter is an indicator called Modular Filter created by Alex Grover
- www.tradingview.com
- Alex Grover - Modular Filter
-------
That's the moving average like baseline following price, filtering long and short trends and providing entry signals when the price crosses the baseline.
Entry signal indicated with arrows.
2. Volume/Volatility, I will called it Trend Strength
The next indicator is commonly known as ASH, Absolute Strength Histogram.
This indicator was shared by VP as a two line cross trend confirmation indicator, however I discovered an interesting property when I modified the calculation of the histogram.
- Alex Grover Absolute Strength
-------
My modification and other info here
- Absolute Strength Histogram v2
-------
I simplified the display of the trend strength by plotting squares at the bottom of the chart.
- Lighted Squares shows strength
- Dimmed Squares shows weakness
3. Second Confirmation / Exits / Trailing Stop
Finally the last indicator is my usage of QQE (Qualitative Quantitative Estimation), demonstrated in my QQE Trailing Line Indicator
- QQE Trailing Line for Trailing Stop
-------
Three usages of this amazing indicator, serving as :
- Second trend confirmation
- Exit signal when price crosses the trailing line
- Trailing stop when you scaled out the second trade
This indicator is plotted with crosses.
Additional plots and information
Bar Color
- Green for longs, Red for shorts, White when the baseline direction conflicts with the QQE trailing line direction
- When it's white, it's usually ranging and not trending, ASH will also keep you off ranging periods.
-------
ATR Filter
- White circles along the baseline, they will show up if the price has moved more than one ATR from the baseline
- The default allowance is 1 ATR.
-------
The previous and current ATR value
- Label on the right side of the chart showing the previous and current value of ATR
Trend Follower | jhThis is a trend following system that combines 3 indicators which provide different functionalities, also a concept conceived by VP's No Nonsense FX / NNFX method.
1. Baseline
The main baseline filter is an indicator called Modular Filter created by Alex Grover
- www.tradingview.com
- Alex Grover - Modular Filter
-------
That's the moving average like baseline following price, filtering long and short trends and providing entry signals when the price crosses the baseline.
Entry signal indicated with arrows.
2. Volume/Volatility, I will called it Trend Strength
The next indicator is commonly known as ASH, Absolute Strength Histogram.
This indicator was shared by VP as a two line cross trend confirmation indicator, however I discovered an interesting property when I modified the calculation of the histogram.
- Alex Grover Absolute Strength
-------
My modification and other info here
- Absolute Strength Histogram v2
-------
I simplified the display of the trend strength by plotting squares at the bottom of the chart.
- Lighted Squares shows strength
- Dimmed Squares shows weakness
3. Second Confirmation / Exits / Trailing Stop
Finally the last indicator is my usage of QQE (Qualitative Quantitative Estimation), demonstrated in my QQE Trailing Line Indicator
- QQE Trailing Line for Trailing Stop
-------
Three usages of this amazing indicator, serving as :
- Second trend confirmation
- Exit signal when price crosses the trailing line
- Trailing stop when you scaled out the second trade
This indicator is plotted with crosses.
Additional plots and information
Bar Color
- Green for longs, Red for shorts, White when the baseline direction conflicts with the QQE trailing line direction
- When it's white, it's usually ranging and not trending, ASH will also keep you off ranging periods.
-------
ATR Filter
- White circles along the baseline, they will show up if the price has moved more than one ATR from the baseline
- The default allowance is 1 ATR.
-------
The previous and current ATR value
- Label on the right side of the chart showing the previous and current value of ATR
Adding my Didi and ASH indicators up on this screenshot
Didi Index Improved with QQE

Mirror MACD by Trader JayThis is my take on the metatrader indicator, the mirror macd. Works pretty good on Forex, haven't tested on anything else
Enter long after the Blue Line Cross Up the Red Line and EXIT after the Green line Cross Up the Red Line (above the Blue Line).
For the opposite position : ENTER SELL after the Red Line Cross Down.

QQE Trailing Line for Trailing Stop | jhUsing parts of QQE (Qualitative Quantitative Estimation) again, this time I'm applying the trailing line of QQE on price directly.
Outcome, it's behaving like a baseline filter and it can be use as an exit or a trailing stop indicator.
As comparing to Kijun-sen line in yellow, the QQE trailing line follows the price closer, therefore exiting you sooner when the trend direction changes.
There's 2 QQE option, they behave differently during the trend change.
Credits to Glaz and Shizaru for their QQE code.