Dream Indicator v 1.0UNDER DEVELOPMENT - PRIVATE RELEASE ONLY
Dream Indicator v 1.0
A trend following indicator optimized for use with heikin ashi charts.
Keeps you in a trade, and provides entry/exit points.
Effective across all time frames (higher is better, as with all indicators). MTF capable to provide either long-term trend following (higher time frame), or quicker entry/exit signals (lower time frame).
Requires a trade bias (e.g. divergence, support/resistance, 200 period MA).
This is a private release only, so I can grant access to specific users for feedback. A public release MAY follow in the future. Register your interest in the comments or PM me.
Entrypoint

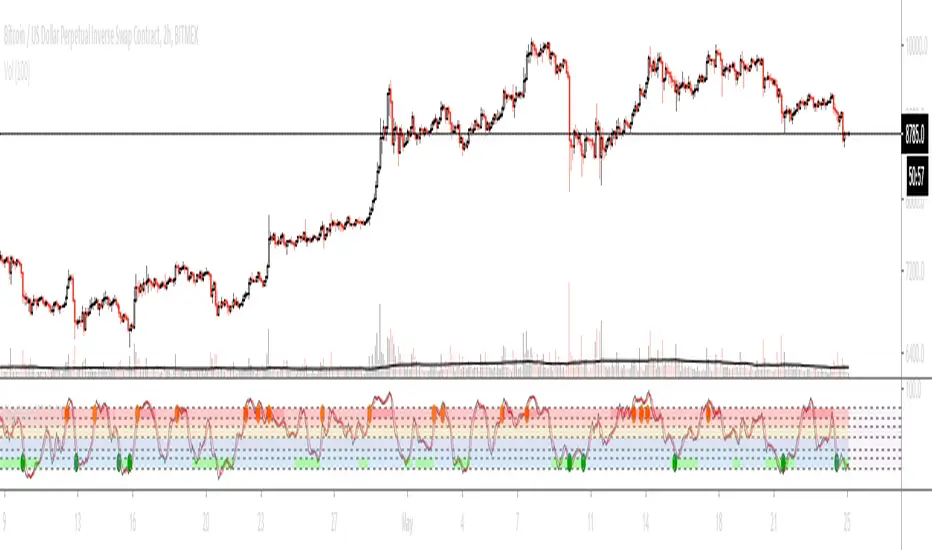
Slow Stochastic + ADX exhaustationSlow stochastic with ADX exhaustation and sell/entry points as orange/green circles.
This is a script I remade from Marco Valente's "RSI Combo" and Oshri17 "Slow stochastic".
Credits and thanks to them for sharing, I just expanded the diversity ^^
Hope you enjoy phit! ;D
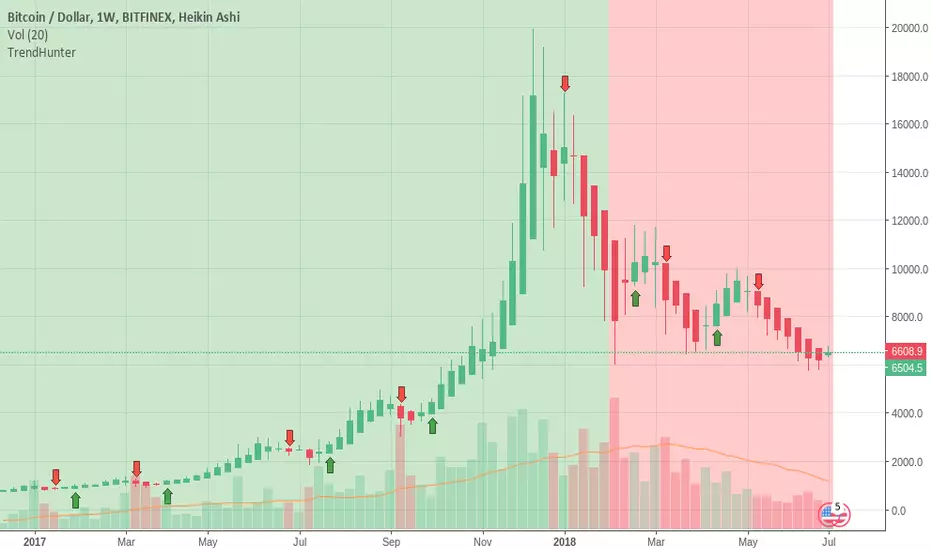
TrendHunterThis indicator aims to provide a clean visual clue about trends and also possible entry/exit points.
Green background + green arrow buy signal = strong buy.
Red background + red arrow sell signal = strong sell.
Green background + red arrow = Possible end of the uptrend. Might be an opportunity to sell the top or open a short position for a scalp.
Red background + green arrow = Possible end of the downtrend. Might be an opportunity to buy the bottom or open a long position for a scalp.
Annual subscription, 50 spots.
Contact: trendhunter@protonmail.com
[A3] New Signal EntryNew Upgrade.
Wallet DONATION
~~~~~~~~~~~~~~~~~~~~~~~~~~~~~
Trx
0x33e527b990f7db72156973cbd11d4eee1c9e1359
stq
0x0b7f825a6f2a4240dedf70f143858113464bd7f5
~~~~~~~~~~~~~~~~~~~~~~~~~~~~~~
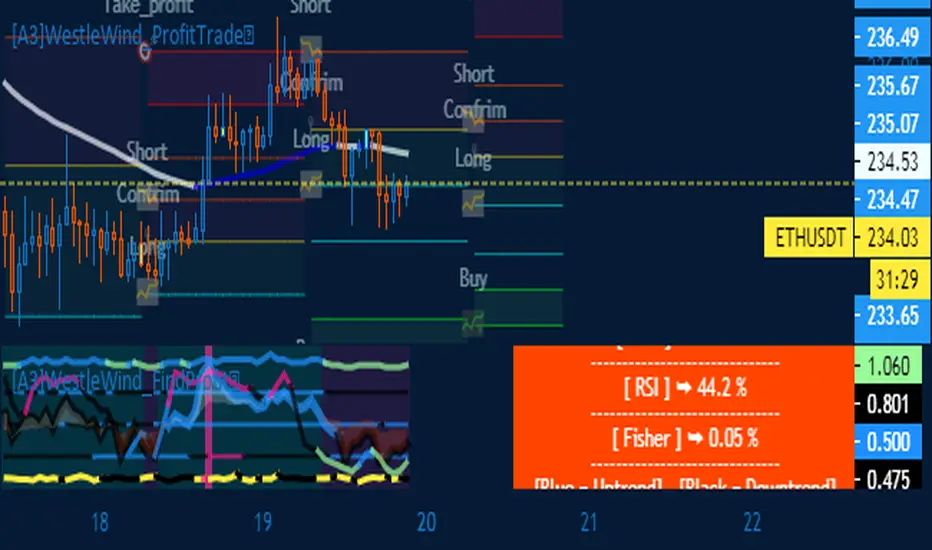
Buy Signal and Entry points (alpha)
Here is some study for my new bot project. 🤖
Indicator shows entry points (buy signals). Bets results on 15M TF and higher. (1H recommended)
Pay attention to how the script gives signals before the pumps. 📈📈📈
You can cut false signals by using stop-loss orders (recommended).
Use on you own risk.
This is alpha version of script. May be updated in the future.
=================================================================
Стратегия разработанная для нашего торгового бота. 🤖
Индикатор показывает точки входа на покупку. Показывает хорошие результаты на ТФ 15М и выше. (Рекомендую 1Ч)
Обратите внимание на то, как скрипт срабатывает перед пампами. 📈📈📈
Чтобы купировать ложные сигналы, рекомендую использовать стоп-лосс ордера.
Это альфа версия скрипта, возможно будет дорабатываться и обновляться. Но это не точно :)

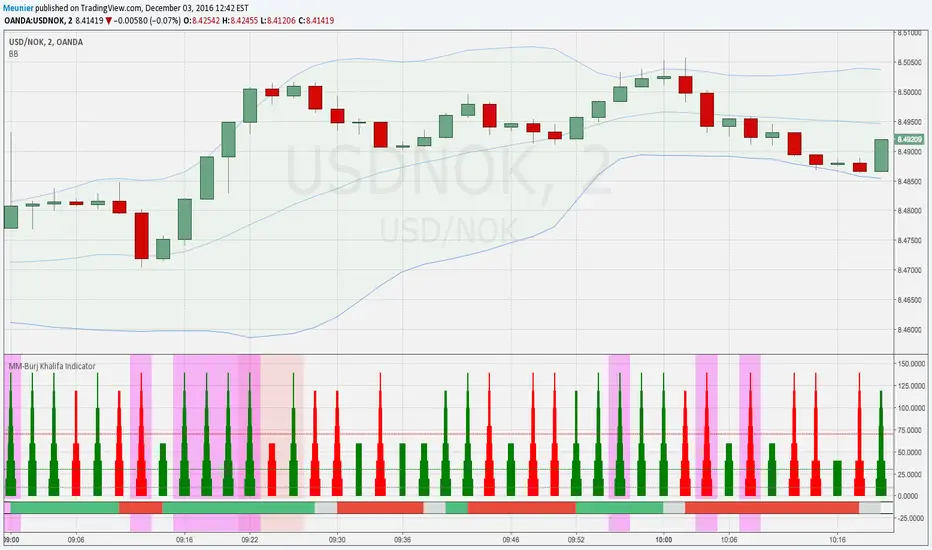
MM-Burj Khalifa Indicator
This indicator uses several signals to visualize a "perfect candle" to enter a trade.
It colors the background to identify the zones of interest (multiple configurable high or low RSI zones). Underlying is a trendbar with the current MACD direction. It's possible to tweak the indicator with a lot of options in the settings section (e.g. for which period you want a rising DM+-signal, etc.)
The indicator is using signals of:
--MACD
--RSI
--PVT
--ATR
--AD and DMI+/DMI-
When all 7 criterias are met it highlights the candle.
It also creates different colums with different height and width, so that you can see which signal is OK and which is maybe missing. When all signals are on GO you'll see a Burj-Khalifa-like figure. If not all signals are on GO you'see crippled versions.
To be clear:
it's not intended to detect trends or supertrends or reversals. It's purpose it's just to decide if this current candle is really going in the right direction. It doesn't prevent upcoming reversals in the opposite direction.
The Burj-Khalifa indicator could help to confirm the entry point of an trade which was already planned.
I'll come up with a more detailed documentation.
MM-Burj Khalifa IndicatorThis indicator uses several signals to visualize a "perfect candle" to enter a trade.
It colors the background to identify the zones of interest (multiple configurable high or low RSI zones). Underlying is a trendbar with the current MACD direction.
The indicator is using signals of:
--MACD
--RSI
--PVT
--ATR
--AD and DMI+/DMI-
When all 7 criterias are met it highlights the candle.
It also creates different colums with different height and width, so that you can see which signal is OK and which is maybe missing. When all signals are on GO you'll see a Burj-Khalifa-like figure. If not all signals are on GO you'see crippled versions.
To be clear:
it's not intended to detect trends or supertrends or reversals. It's purpose it's just to decide if this current candle is really going in the right direction.
The Burj-Khalifa indicator could help to confirm the entry point of an trade which was already planned.

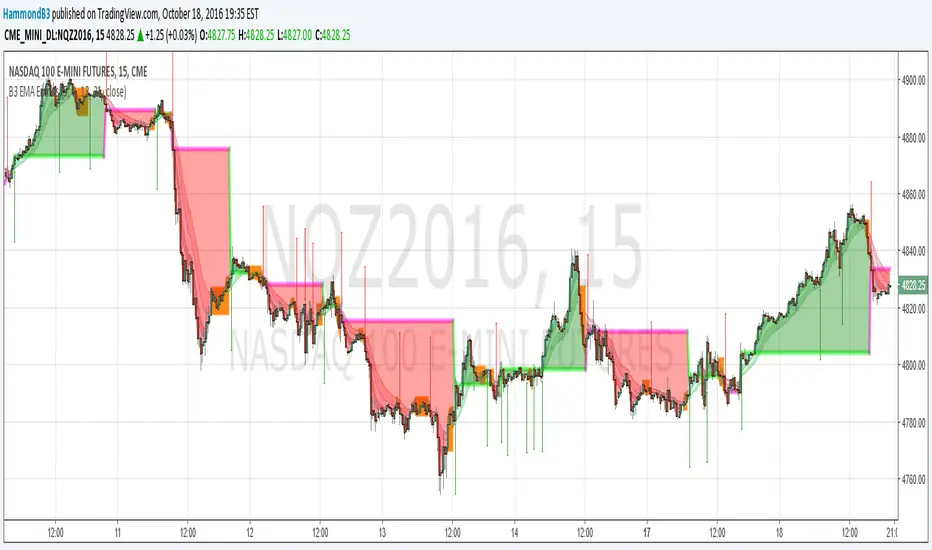
B3 EMA EntriesB3 EMA Entries = B3 EMA Ribbon "Trader"
This study takes the B3 EMA Ribbon and builds trade entries from it. The clouds represent the deviation from entry points; orange equals weakening or undetermined trend. Manage your own exits, and if you have a large deviation cloud in comparison to prior clouds.... take them profits!
Here also is a glimpse into my proprietary scripting that I will likely offer for a subscription at some point. Many simpler freebies like this share to come first of course! I will give away most simple indicators, but there are a few sub-chassis things I use, which I developed myself. One of which is indicator back testing, where I see all of the strategy's history information from the indicator on the chart. Sans trade-ticket automation, this voids the need for a strategy file or A.P.I. or backtesting devices (however, I plan to adapt things to TradingView's strategy system if I can, so that automation can take place). As well as this algorithmic trading system chassis, I also have a specialized statistical output chassis and another few graphical depiction sets.
For this share, you should manage your own exits, (you could simply use the orange clouds as an exit.) This is my most simple of the "indicator traders" I call them. The more intricate algorithmic trading indicators I make have the full trading package down to the risk to reward, entry, target, stop, and trail. The statistical systems are pretty unique, and I haven't seen many doing what I do on that front yet, so I am excited to get those out to more people. Look for these subscriptions in the near future, but as a token of introduction enjoy my next several free shares too.
Cheers, and good trades to you. ~B3