Crypto Scannner for Traffic Lights StrategyI allways try to make trading easier. Developing Scripts for a quick backtest and improvement of a strategy, getting alerts for entry and exit a position. Loading data to a spreadsheet is also important and takes time.
In this case finding good parameters in different markets or assets to enter in a position, is a bit exhausting. It is something you have to do everyday, and sometimes in different moments of the day.
So I manage to develop a Screener, to take a quick look at specific hours, and tell if I have a buy or sell condition in an specific asset. Obviously this is not an alert to make a trade instantaneusly, but this help you filter a lot of information in matters of seconds. Then open those specific charts and make a better analisys.
A few weeks ago, I published a scrpipt called "Traffic Lights Strategy", that uses 4 emas to get a buy or a sell condition.
It is easy to understand and use, but if you don´t want to missed some opportunities, and don't want to be look at the screen in all the time looking for them, I have here a simple solution.
This script works plotting 2 labels. The first one plots all the assets in which the condition is true (fastema > medema > slowema > filterema or fastema < medema < slowema < filterema)
The second one plots the assets were the condition is true only if happened up to 5 candles back, so you can be in time to enter a trade.
You can take the script and customize it for a different strategy or assets. I coded like this because I backtested this strategy in this specific assets, and statistics suggest that it might be profitable.
I hope this works for you. In other time I'll try to code a script for the others strategies I published.
Exponential Moving Average (EMA)

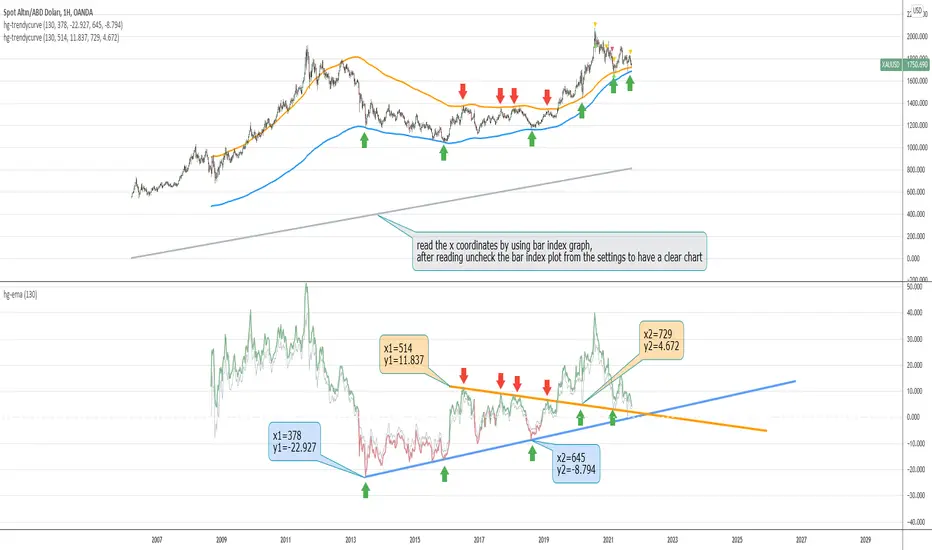
hayatguzel trendycurveENG
If we are wondering how the trendlines drawn on the hayatguzel indicator look like on the graph, we should use this indicator. Trendlines that are linear in Hg (hayatguzel) are actually curved in the graph.
"hayatguzel curve" indicator has capable of plotting horizontal levels but not trendlines in hg indicator. But "hayatguzel trendycurve" indicator has capable of plotting (on the chart) trendlines in hg.
First of all, we start by determining the coordinates from the trendlines drawn in hg. The coordinate of trendline beginings is x1,y1. In the continuation of the trendline, the coordinate of the second point taken from anywhere on the trendline is defined as x2,y2. In order to find the x1 and x2 values, the gray bar index chart must be open. After reading the values, the bar index chart can be turned off in the settings. The x coordinates of the trendlines will be the values in this gray bar index graph. You can read these coordinates from the gray numbers in the hg-trendycurve setting at the top left of the graph. The y values are the y axis values in the hg indicator.
It should be noted that the ema value in the hayatguzel trendycurve indicator must be the same as the ema value in the hg indicator.
Hayatguzel trendycurve indicator is not an indicator that can be used on its own, it should be used together with hayatguzel indicator.
TR
Hayatguzel indikatöründe çizilen trendline'ların grafik üzerine nasıl göründüğünü merak ediyorsak bu indikatörü kullanmalıyız. Hg'de doğrusal olan trendline'lar doğal olarak grafikte eğriseller.
Hayatguzel curve indikatöründe hg'deki sadece yatay seviyeler grafiğe dökülürken bu hayatguzel trendycurve indikatörü ile hg'deki trendline'lar da grafiğe dökülebiliyor.
Öncelikle hg'de çizilen trendline'lardan koordinatları belirlemek ile işe başlıyoruz. Trendline'ların başladığı yerin koordinatı x1,y1'dir. Trendline'ın devamında trendline üzerinde herhangi bir yerden alınan ikinci noktanın koordinatı da x2,y2 olarak tanımlandı. x1 ve x2 değerlerini bulabilmek için gri bar index grafiğinin açık olması gerekmektedir. Değerleri okuduktan sonra bar index grafiği ayarlardan kapatılabilir. Trendline'ların x koordinatları bu gri renkli bar index grafiğindeki değerler olacaktır. Bu koordinatları grafikte sol üstte bulunan hg-trendycurve ayalarındaki gri sayılardan okuyabilirsiniz. y değerleri ise hg indikatöründeki y ekseni değerleridir.
Unutulmamalı ki hayatguzel trendycurve indikatöründeki ema değeri hg indikatöründeki ema değeri ile aynı olmalıdır.
Hayatguzel trendycurve indikatörü kendi başına kullanılabilecek bir indikatör olmayıp hayatguzel indikatörü ile beraber kullanılması gerekmektedir.
7 Moving Averages [Plus]Moving Averages are price based, lagging (or reactive) indicators that display the average price of a security over a set period of time. A Moving Average is a good way to gauge momentum as well as to confirm trends, and define areas of support and resistance. Essentially, Moving Averages smooth out the “noise” when trying to interpret charts. Noise is made up of fluctuations of both price and volume. Because a Moving Average is a lagging indicator and reacts to events that have already happened, it is not used as a predictive indicator but as an interpretive one for confirmations and analysis.
Bollinger Bands (BB) are a widely popular technical analysis instrument created by John Bollinger. The BB consist of a band of three lines which are plotted in relation to security prices. The line in the middle is usually a Simple Moving Average (SMA) set to a period of 20 days (the type of trend line and period can be changed by the trader; however a 20 day moving average is by far the most popular). The SMA then serves as a base for the Upper and Lower Bands which are used as a way to measure volatility by observing the relationship between the Bands and price. Typically the Upper and Lower Bands are set to two standard deviations away from the SMA (The Middle Line); however the number of standard deviations can also be adjusted by the trader.
This script shows 6 moving averages and Bollinger Bands.
Features:
- Standard MA inputs.
- MA type.
- MA period.
- MA source.
- MA resolution (time frame).
- MA Offset.
- Forecasting : forcasted prices are calculated using our MAType and MASource for the MAPeriod.
- Trail: Show only candles not included in the MA calculation.
The color of MA1 depends on the chosen strategy, by default this is the 3EMA strategy. You can also select "Pivot Point Supertrend" or "Ichimoku Trend"
Added "Parabolic Stop and Reverse (PSAR)" . The PSAR is a time and price technical analysis tool primarily used to identify points of potential stops and reverses. In fact, the SAR in Parabolic SAR stands for "Stop and Reverse". The indicator's calculations create a parabola which is located below price during a Bullish Trend and above Price during a Bearish Trend.
Added "Linear Regression Channel" which can be correctly plotted on logarithmic charts. A linear regression channel consists of a median line with 2 parallel lines, above and below it, at the same distance. Those lines can be seen as support and resistance. The median line is calculated based on linear regression of the closing prices but the source can also be set to open, high or low. The height of the channel is based on the deviation of price to the median line. Extrapolating the channel forward can help to provide a bias and to find trading opportunities.

hayatguzel curveENG
When the support resistance study is performed on the hayatguzel indicator, we see that these levels, which are actually horizontal in hayatguzel, are curvilinear when they are plotted on the chart, this is because the hayatguzel indicator uses moving average EMAs.
We can understand the chart more easily by shaping the resulting table in hayatguzel indicator in our minds more easily and seeing these horizontal levels in hayatguzel as curvilinear on the graph.
Let me explain what needs to be done with an example:
The indicator value on top of the yellow box is 13.58 and below of the yellow box of the hayatguzel indicator 5.83. The curves that will occur when we add these values to the hayatguzel curve indicator are shown in green. With the same logic, if we want to see this level, which is the upper blue resistance box on the hayatguzel indicator and coincides with the 67 level, on the graph, we enter 67 for both of the coefficients in the hayatguzel curve indicator. ( Which ema is used in hayatguzel, the same ema value must be entered in hayatguzel curve, ema200 is used in this example )
The result is that the hg curves drawn in green act as support and when the upward movement comes, the hg curve drawn in blue now passes through the 2700s. In other words, we can see that the position is in support and where its target is.
I'd like to show all this in one hayatguzel indicator, but pinescript doesn't make it possible. That's why I had to write this code separately.
TR
Hayatguzel indikatöründe destek direnç çalışması yapıldığında aslında hayatguzel'de yatay olan bu seviyelerin grafiğe atıldığında eğrisel olduğunu görüyoruz, bunun nedeni hayatguzel indikatörünün hareketli ortalama olan ema'ları kullanmasıdır.
Hayatguzel indikatöründeki ortaya çıkan tabloyu kafamızda daha rahat şekillendirmek ve hayatguzel'de yatay olan bu seviyeleri grafik üzerinde eğrisel olarak görerek grafiğe daha çok hakim olabiliriz.
Yapılması gereken şeyi bir örnekle anlatayım:
Hayatguzel indikatöründeki sarı kutunun üstünde indikatör değeri 13.58 ve altında 5.83. Biz bu değerleri hayatguzel curve indikatörüne eklediğimiz zaman oluşacak eğriler yeşil ile gösterildi. Aynı mantıkla hayatguzel indikatöründeki üstteki mavi direnç kutusu olan ve 67 seviyesine denk gelen bu seviyeyi grafikte görmek istiyorsak hayatguzel curve indikatöründeki katsayıların ( coefficient ) ikisine de 67'yi giriyoruz. ( hayatguzel'de hangi ema kullanıldıysa hayatguzel curve'de de aynı ema değeri girilmeli, bu örnekte ema200 kullanıldı )
Burdan ne sonuç çıkıyor peki ?
Çıkan sonuç yeşil ile çizilen hg eğrilerinin destek görevi gördüğü ve yukarı doğru hareket geldiğinde mavi ile çizilen hg eğrisinin şu an 2700 lerden geçtiğidir. Yani hem pozisyonun destekte olduğunu hem de hedefinin neresi olduğunu görebiliyoruz.
Bütün bunları tek bir hayatguzel indikatörünün içinde göstermek isterdim ama pinescript bunu mümkün kılmıyor. O nedenle bu kodu ayrı olarak yazmak zorunda kaldım.

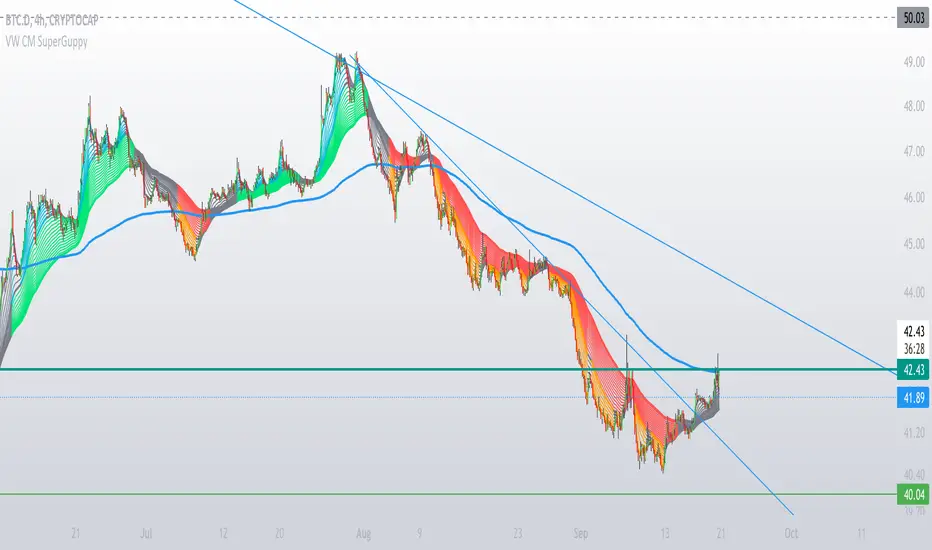
Volume Weighted Super GuppyGuppy Super EMA is a technical indicator that aims to anticipate a potential breakout in the price of an asset. The term gets its name from Daryl Guppy, an Australian financial columnist and book author who developed the concept in his book, "Trading Tactics."
It uses the exponential moving average (EMA) to capture the difference between price and value in a stock. A convergence in these factors is associated with a significant trend change.
I have added Volume Weighting for EMAs and simple workaround if there no volume data.
Moving Average Exponential with Standard Deviation BandThis is standard EMA script available on Trading View and i have just added ability to add a channel based on standard deviation. In addition to it you can enable/disable optional lines from options and it would add 50% levels of upper and under channel. I added 50% as it provide important price levels if you have right settings selected for channel factor.

world stage indexThis is an indicator that expresses the ratio of "stage1" and "stage4" of world index.
40 symbols are as follows
(JAPAN, US, EUROPE, and CANADA)
OSE:NK2251!, DJ:DJI, NASDAQ:IXIC, SP:SPX, XETR:DAX, TVC:CAC40, TVC:UKX, TSX:TSX
(ASIA)
TVC:SHCOMP, SZSE:399001, TVC:HSI, TWSE:TAIEX, BSE:SENSEX, OANDA:SG30SGD, INDEX:KSI, SET:SET
(EUROPE)
INDEX:SX5E, INDEX:FTSEMIB, SIX:SMI, BME:IBC, EURONEXT:BEL20, TVC:AEX, OMXCOP:OMXC25, XETR:0Q5X
(Pacific Ocean)
ASX:XJO, TVC:NZ50G, IDX:COMPOSITE, FTSEMYX:FBMKLCI, BMFBOVESPA:IBOV, BMV:ME, BVL:SPBLPGPT, BYMA:IMV
(Eastern Europe & Middle East)
MOEX:IMOEX, GPW:WIG20, OMXHEX:OMXH25, OMXSTO:OMXS30, DFM:DFMGI, TADAWUL:TASI, OSE:GNRI, EGX:EGX30
The criteria are as follows:
EMA5≧EMA20≧EMA40 : Stage1
EMA5≦EMA20≦EMA40 : Stage4
A.The sum of Stage1 was multiplied by 2.5 and drawn on a scale of 0 to 100, with yellow area
B.The Sum of Stage4 was multiplied by 2.5 and drawn on a scale of 0 to 100, with blue area.
C. The ratio of A/B was multiplied by 2.5 and drawn on a scale of 0 to 100, with red lines.
This idea is from Kojirou Kousi.
40 symbols of this script are partially different from Kojiro kousi's idea.
But he said the difference isn't matter.
「小次郎講師指数」に着想を得た、世界40カ国の株価指数stage状態です。
参考文献は、小次郎講師著書「世界一わかりやすい投資の勝ち方」です。
小次郎講師とは一部異なるシンボルを採用していますが、
多少の違いは余り大した問題では無いと御本人から教わった事があります。
先進国に関してはおそらくほとんど同じだと思います。
stage1の合計の%を黄色、stage4の合計の%を青色、stage1の合計/stage4の合計の%を赤で表示しています。
雰囲気で分かればいいので、正確な数字までは表示しませんでした。
個人的には現状分析以外にも、プラクティス時に世界情勢を把握するのに重宝しています。

ExTreeMe IndicatorThis indicator can plot of 6 time frame ema with pre-calculated length for each interval.
Additionally with EMA, it calculates 6 timeframe RSI and show green zones on the chart. Green zone can be short/mid/long term.
Short term zones(only for scalping) are decided based on first 3 EMAs. Mid term zones are decided based on first 2nd-4th EMAs. Long Term are decided on last 3 EMAs.
Mid term zones are most effective for positional trades.
Green colour is the entry zone. 2 condition will give better chance of a trendy upmove.
1. EMAs have crossover-ed recently and all are very near to each other and current price
2. Green zone appears after long consolidation.
There is other colour zone which indicates RSI is in no man's land(51-49), need to be cautious then.
Exit when white band appears.
This indicator is totally independent of current chart timeframe and stays same irrespective of which time frame you select for your chart.
Creator: DeeJay
Strategy By: Express Tree from NiftyBN

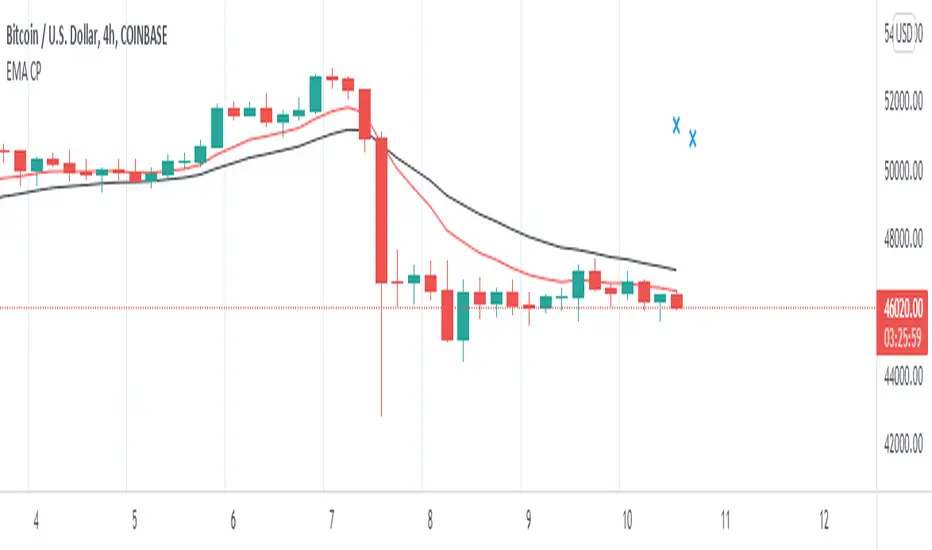
2 EMA Meeting PointThis script will calculate when the next candle needs to close for the moving averages to cross .
If you use EMAs that are far away, the convergence point may be ridiculously far away from the chart. I recommend using ' Scale Price Chart Only ' with this script.
I think you can use this to organize your watchlists if you trade crossovers. If your cross is completely out of the chart, its symbol can be down below, because the cross is unlikely to happen in the next candle.
Good luck!
Up/Down Indicator - DurbtradeA simple but unique indicator to show ONLY whether there is an increase or a decrease in price compared to the previous value.
Also includes a customizable SMA or EMA based "Smoothing Length" variable,
allowing the indicator to show whether the SMA or the EMA of the price
is up or down compared to the previous value.
An offset option is also included if you need it.
Settings :
Personal thoughts :
I wanted to have an indicator that showed ONLY whether the price is UP or DOWN from the previous value.
My logic was that I could have a more accurate perception of general up or down trend direction
if I removed the AMOUNT of increase or decrease happening from moment to moment over time.
From there, I added the SMA/EMA "Smoothing Length" and "Smoothing Type" variables into the script.
By increasing the value of the smoothing length above 1,
the indicator act as a color-changing moving average, except without showing an actual value.
"Smooth Length" acts just like the length of any other moving average...
When the value of the "Smooth Length" is = 1, the indicator shows whether PRICE is up or down.
When the value of the "Smooth Length" is = 50, the indicator shows whether the MOVING AVERAGE with a length of 50 is up or down.
When the value of the "Smooth Type" is = 1, the indicator is SMA based.
When the value of the "Smooth Type" is = 2, the indicator is EMA based.
As you can see in the main chart above, or in the picture below, I show the indicator in 2 different ways...
The indicator on the top shows price up/down action,
and the indicator on the bottom shows the 50 SMA up/down action :
Other key points :
The indicator height can be smashed down as small as possible and still remain 100% functional...
which is very important when chart real-estate is limited.
Here is an example of my main layout setup, with the Up/Down indicator on the top left :
As you can see, it takes up very little space, but still remains fully functional.
In the example above, I have it overlayed on the left chart price panel,
with the price visibility turned off.
If it is overlayed on the price panel like so, and you want to see both the indicator and price,
simply turn the price visibility on to see both.
Since the indicator displays itself merely by changing the color of the background,
layer order has no effect, and the indicator is always drawn in the background.
The Up/Down indicator can also be used in conjunction with other candle types
that sometimes display candle color differently than standard candles, such as heikin-ashi candles.
Just take note that the colors of the indicator may not match the colors of the heikin-ashi candles.
Finally, I looked very hard to find an indicator like this on TradingView, and found absolutely nothing.
I know that it is a simple concept, but I'm honestly surprised I couldn't find anything like it.
I have been using it for awhile now, and I'm proud of the results...
therefore, I'd like to share it with the community, along with my previously published indicators,
in the hope that you find it useful!
Outro :
A) As with my previous indicators,
this one was written while keeping information, color, clarity, chart real-estate, and customization in mind.
B) It is optimized to be displayed on all display setups...
for use on your own personal television, laptop, or cellular phone screen...
and on all chart zoom levels and layout styles.
C) Please feel free to comment your thoughts, critiques, or suggestions. They are all very helpful!
D) Check out my previous pine script indicators if you like this one. They work really well together.
E) I hope that you find this script useful.
F) Enjoy!
// Durbtrade

EMA DifferenceThis indicator simply calculates the difference between two EMAs (one is EMA-10 and the other one is EMA-20) and shows the amount of difference in form of a histogram chart. When the histogram bars are above zero, it shows you that we have an uptrend, and vice versa. You can use this Indicator in various markets and it is compatible with different time-frames.

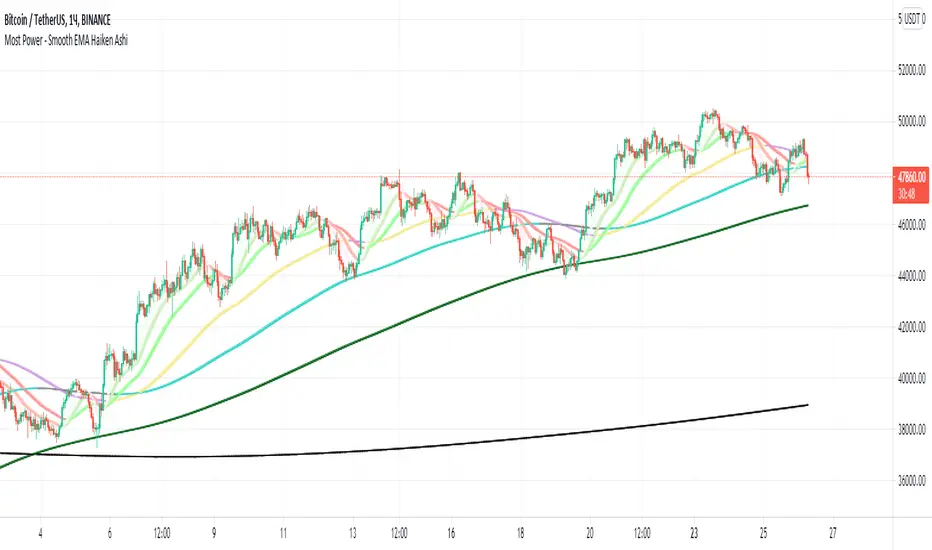
Most Power - Smooth EMA Haiken AshiMost Power - Smooth EMA Haiken Ashi
The indicator displays smoothed EMA (5, 10, 20, 50, 100, 200, 1000). Smoothing occurs through the use of Haiken AShi
Horizontal Line At Daily Moving AveragesThis script allows you to see the major daily moving average levels on a smaller time frame.
One challenge with day trading is, when trading on a smaller time frame, you are not paying as much attention to the daily price levels. One solution might be to select a chart layout on Tradingview which allows you to see both the daily and a smaller time frame at the same time. However, this approach takes up valuable screen space. All you are really looking for is the significant daily price level and the price action near that level. This script allows you to merge the 2 goals on 1 chart. You have the smaller time frame open to monitor detailed price action and horizontal lines at the major moving average levels.
Red: 9 EMA
Navy: 20 MA
Green: 50 MA
Blue: 100 MA
Purple: 200 MA

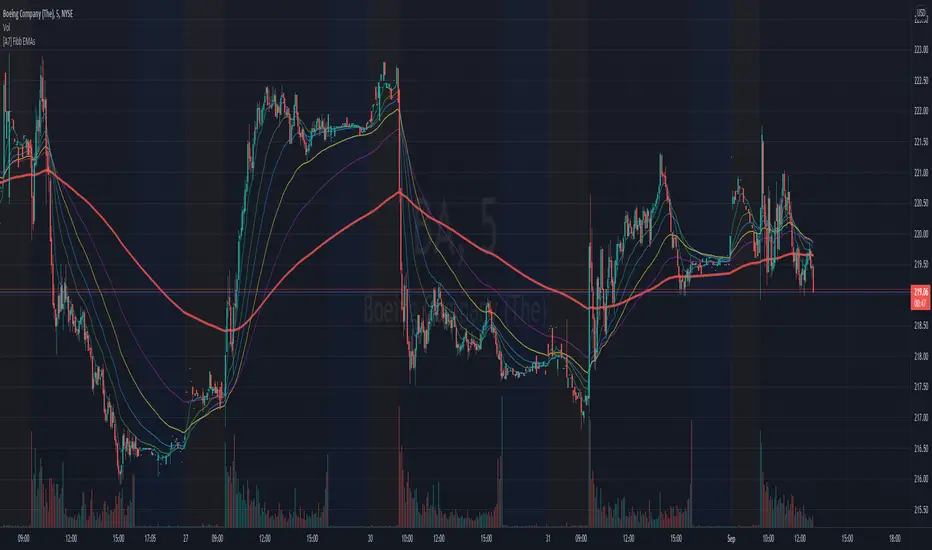
[A7] Fibonacci EMAs (8,21,34,55,89,233) Fibonacci EMAs (8,21,34,55,89,233)
Fibonacci Exponential Moving Averages
8 - aqua
21 - green
34 - blue
55 - yellow
89 - purple
233 - red
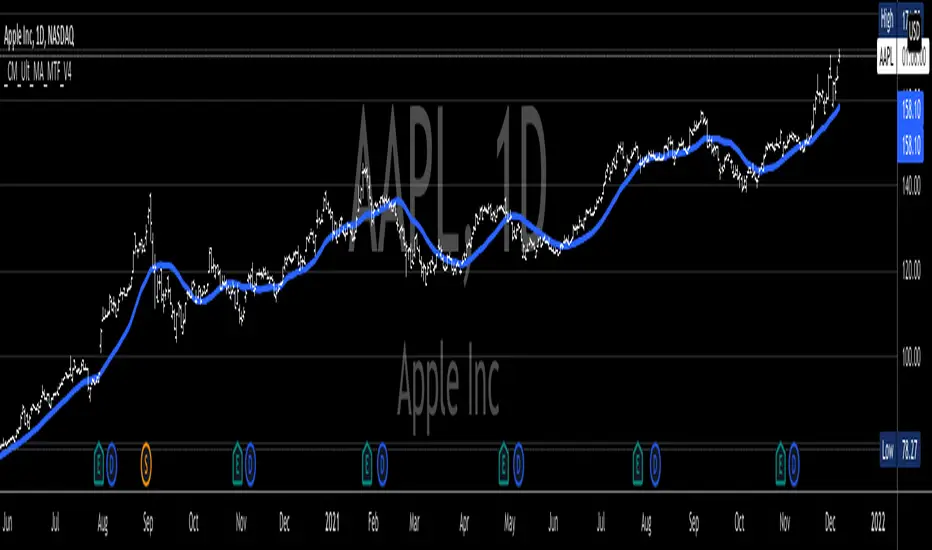
_CM_Ultimate_MA_MTF_V4***For a Detailed Video Overview Showing all of the Settings...
Click HERE to View Video
New _CM_Ultimate_MA_MTF_V4 - Update - 08-24-2021
Thanks to @SKTennis for help with code
Added Ability to Plot 1 or 2 Moving Averages - Fast MA & Slow MA
Added Ability to Plot Fast MA with Multi TimeFrame
Added Ability to Plot Slow MA with Multi TimeFrame
Added Ability to Color Fast MA Based on Slope of MA
Added Ability to Color Fast MA based on being Above/Below Slow MA
Added Ability to Plot 8 Types of Moving Averages
Simple, Exponential, Weighted, Hull, VWMA, RMA, TEMA, & Tilson T3
Added Ability to Set Alerts Based on:
Slope Change in the Fast MA Or Fast MA Crossing Above/Below Slow MA.
Added Ability to Plot "Fill" if Both Moving Averages are Turned ON
Added Ability to control Transparency of Fill
Added Alerts to Settings Pane.
Customized how Alerts work. Must keep Checked in Settings Pane, and When you go to Alerts Panel, Change Symbol to Indicator (_CM_Ultimate_MA_MTF_V4)
Customized Alerts to Show Symbol, TimeFrame, Closing Price, & Moving Average Signal Name in Alert
Alerts are Pre-Set to only Alert on Bar Close
See Video for Detailed Overview
New Updates Coming Soon!!!
***Please Post Feedback and Any Feature Requests in the Comments Section Below***
Bollinger bands + EMAI discovered a video on YouTube which was published on Jan 22, 2021. I just coded on TradingView. It's performing better in smaller TimeFrames (1m, 5m, ...).
How does it work? How to use?
This is based on Bollinger Bands and Exponential Moving Average. The logic is so simple: It will wait until the a candle starts to poke out of the BB. When it figures out a price outside the band, it will be altered for next candle. If the next candle close back inside the band, it will be marked with a up triangle (for long positions) or down triangle (for short positions). The take profit level would be the Exponential Moving Average.
It can be used as a confirmation alongside other techno fundamental tools and analysis.
P.S. As it's prohibited by community rules to link to outside, while it seems to be a kind of advertisement, I cannot share the link to the video. Cheers to those creative and kind YouTubers!

REMORA StrategyStrategy:
Finding entry using pullback or Buy On Dip method.
This indicator using EMA line and ATR strategy to find best entry.
EMA line consist of :
EMA 20, EMA 50 and EMA 90.
Entry signal when candle rebound on EMA line and rocket signal appeared.
Exit when "SL" signal appeared.

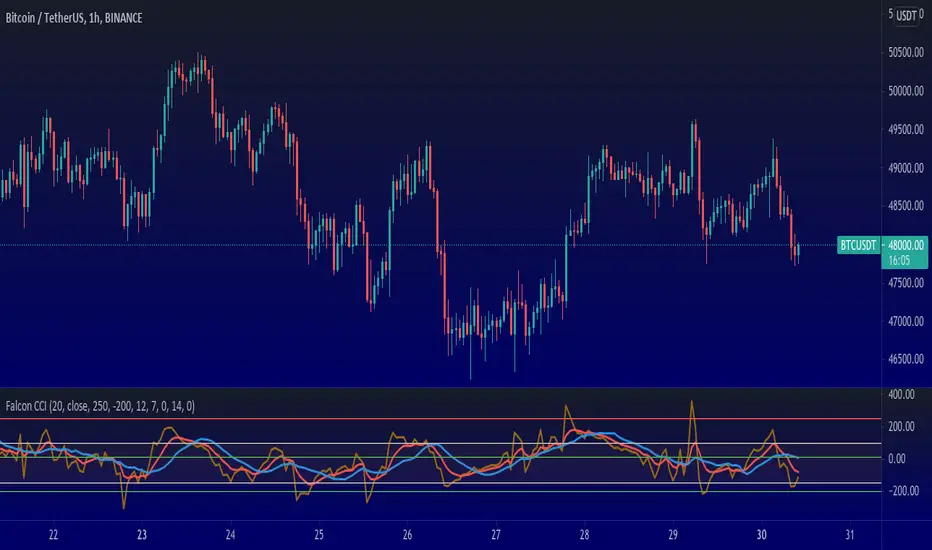
ExpertToken Buy/Sell SignalExpertToken Buy/Sell Signal เป็นอินดิเคเตอร์ที่สามารถบอกสัญญาณการซื้อขาย และบอกแนวโน้มของราคาได้
หลักการทำงาน
สัญญาณ Buy/Sell ถูกกำหนดโดยการใช่ CCI วัดโมเมนตัมการซื้อขาย หาก CCI ส่งสัญญาณว่าแรงขายเยอะเกินไป และมีแนวโน้มราคาจะกลับตัวสูงขึ้น ก็จะส่งสัญญาณ Buy แต่หาก CCI ส่งสัญญาณว่าแรงซื้อเยอะเกินไป และมีแนวโน้มราคาจะกลับตัวต่ำลง ก็จะส่งสัญญาณ Buy
เส้นสีน้ำเงินเป็นเส้น EMA 200 ไว้ใช้บอกแนวโน้มระยะยาว
เมฆขาว ประกอบไปด้วย เส้นสีเขียว(เส้น EMA เคลื่อนที่เร็ว) และเส้นสีแดง(เส้น EMA เคลื่อนที่ช้า) โดยให้ทั้งสองเส้นตัดกันเพื่อบอกสัญญาณการกลับตัว ค่าเริ่มต้นของทั้งสองเส้นเป็น 20, 50
วิธีการใช้อินดิเคเตอร์
ขั้นตอนแรก ให้ดูเส้นสีน้ำ หากราคาอยู่เหนือเส้นสีน้ำเงิน อาจมีแนวโน้มที่ราคาจะขึ้น
ขั้นตอนที่สอง ให้ดูเมฆ ที่ถูกสร้างขึ้นโดยการน้ำเส้น EMA 2 เส้น สีเขียวและสีแดง หากเส้นสีเขียวอยู่เหนือเส้นสีแดง ราคาอาจมีแนวโน้มที่ขึ้น หากเส้นสีแดงอยู่เหนือเส้นสีเขียว ราคาอาจจะลง แต่ถ้าหากราคาอยู่ในโซนเมฆขาว(ราคาอยู่ระหว่างเส้นเขียวกับสีแดง) ราคาอยู่ในช่วงเป็นกลาง
สุดท้าย หากมีข้อความบอกสัญญาณบอกว่า Buy หรือ Sell ให้พิจารณาจากสองขั้นตอนก่อนหน้านี้ หากมันสอดคล่องกับสองขั้นตอนก่อนหน้านี้ ให้พิจารณาการเปิดตำแหน่งตามสัญญาณ
################################################################################################
ExpertToken Buy/Sell Signal is an indicator that can give you trading signals. and tell the trend of the price
How it works
Buy/Sell signals are determined by using CCI to measure trading momentum.
If CCI signals too much selling pressure and there is a tendency for the price to reverse higher It sends a buy signal, but if CCI signals that it is overbought and the price tends to reverse lower will send signal Buy
The blue line is the EMA 200 line to indicate a long-term trend.
The white cloud consists of a green line (fast moving EMA line) and a red line (slow moving EMA line), with the two lines intersecting to signal a reversal. The default values for both lines are 20, 50.
How to use the indicator
The first step is to look at the watercolor lines. If the price is above the blue line There may be a tendency for prices to go up.
The second step is to look at the clouds that are created by watering the 2 EMA lines, green and red. If the green line is above the red line The price may tend to go up. If the red line is above the green line, the price may go down, but if the price is in the white cloud zone (the price is between the green and red line), the price is in the neutral range.
Finally, if there is a signal to say Buy or Sell, consider the previous two steps. If it complies with the previous two steps Consider opening a position based on a signal.

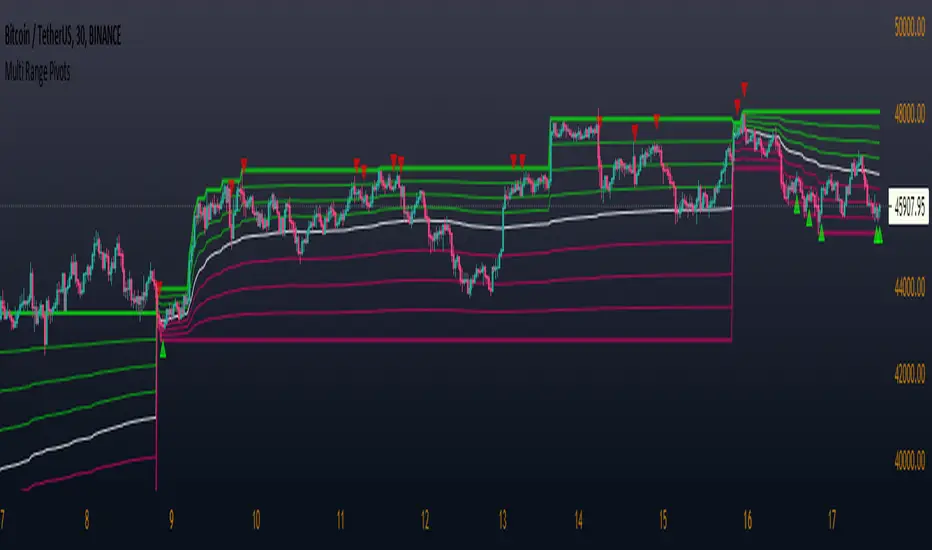
Multi Range Pivots
Multi Range Pivots works by recognizing the high and low of the timeframe selected and plotting range high to MEAN averages and range low to MEAN averages.
This is essentially the VWAP pivots updated to include not only VWAP as a MEAN, but also SMA, EMA, VWMA, DEMA, TEMA, TRIMA, KAMA, MAMA, T3, H/L basis and Donchian basis.
Also, with high and low no longer repainting, I was able to add true reliable signals.
Enjoy
[bjb] tEMAs - Triple Exponential Moving Averages, by BlueJayBirdIs it not a pain in the butt not to find a simple script like this one in TV? I didn't find one, so I made it.
Features:
- Simple script with 3 simple Exponential Moving Averages.
Special features:
- Settable time resolution.
- Colored fill between EMA20/50 pair, and between EMA50/200 pair.
More useful than you think:
- I've found it specially useful for detecting Elliot Wave patterns. The fill colors make them stand out. Use EMA20/50 pair for this.
- The resolution change makes EMAs studies from higher timeframes, at lower time frames, more accurate. Try from 1m timeframe, setting the tEMAs resolution to 1h.
Like, follow and comment. 💯

Multi-timeframe MAs + Stoch RSI SignalsHello traders,
I welcome you to my first published script on TradingView: “Multi-timeframe Moving Averages + Stochastic RSI”.
The script is based on a simple formula: Buy signals are generated when a fast moving average is above a slower moving average (uptrend) and the Stochastic RSI K line is crossing above the oversold level (entry).
Sell signals are generated when a fast moving average is below a slower moving average (downtrend) and the Stochastic RSI K line is crossing below the overbought level (entry).
This indicator works best in strong trends!
**Please note the above example has repainting turned on which may produce unrealistic results when viewing historical data. See below for more information regarding this and how you can turn it off.**
The user has the following inputs:
- Option to change the Stochastic RSI settings, including the oversold and overbought levels.
- Option to enter any value for both the Fast Moving Average and the Slow Moving Average.
- Option to change between EMA or SMA for each moving average.
- Multiple time frames to choose from, as well as the ability to selectively turn off individual time frames (both plots and alerts).
(Default time frames are 1 hour, 4 hour, and Daily. You can have a 4th time frame by changing your current time frame to something lower than the other 3 time frames)
- Turn on/off repainting: If repainting is turned on you will get an alert and buy/sell signal on chart immediately when condition is met, however the signal may disappear from chart if the condition reverses during the same candle.
If repainting is turned off, the indicator will wait for the candle to close before issuing the alert and painting the signal on chart.
For higher time frames, the indicator will wait for the candle in the higher time frame to close before issuing a signal if repaint is turned off. Default is set to Repaint on, so please be aware of this if you do not want repainting.
How to use alerts:
- Before you do anything, make sure your current time frame is the lowest time frame you’d like alerts on, as you will still receive alerts for the higher time frames you selected in settings.
- Once you have all the settings changed to how you like, save your chart first. Then right click on any of the indicator’s buy/sell signals on the chart and click “Add Alert on MAs + Stoch RSI”.
- Make sure “Any alert() function call” is selected under the Condition.
- You can delete or change the text in “Alert name” if you want as the alert message is already built into the indicator, and it will tell you in the alert message which asset and time frame to buy or sell.
Other things to note:
- The indicator will not display the buy/sell signals of lower time frames when you are on a higher time frame. This was done purposely to reduce clutter on the chart when you switch to higher time frames.
- While the alert message will tell you which time frame a signal was generated, the plots on the chart will instead show “Buy/Sell TF1, or TF2, or TF3”.
If the signal is from the current time frame that the alert was created on, then it will simply show “Buy” or “Sell”.
Hope you guys enjoy using this one, please drop a like if you found it useful. If anyone wants to modify my script in any way, please just credit me for the original work when you publish the script. Good luck!

Falcon Commodity Channel IndexFalcon CCI indicator is a superb indicator for anyone who wants to dig deep and still float. The trading lifestyle requires you to be one step ahead of everyone else, while doing so, you want to manage risk, enter at correct positions and perhaps exit at correct positions too.
Exiting at correct positions is so over rated, people tend to forget that exit is as important as entry and therefore we need to make sure that we use a good indicator setup that helps us to do that.
Falcon CCI Indicator is a receipe developed by me during recent Bitcoin slump, where we really needed something more to help us get pass through ups and downs, sudden movements and volatility in the market.
This indicator is perfect even for the swing and trend traders, intra day and day traders who want a quick win, rather than invest for long term.
Here are entry and exit plans based on this indicator:-
Setup: I keep CCI at 20, MA at 14 and EMA at 7 but I change it depending on the stock or crypto. Truth is, you can play with it and find what is best for your trading setups, but once you are done, it really works.
Buy: Buy when CCI crosses above MA or EMA , but CCI should be below 50
Sell: Sell when CCI crosses below MA or EMA (You need to choose), CCI should be above 150
There can be other entry and exit based on just CCI values, and therefore I have added some max and min inputs too in the indicator, e.g. Buy when CCI is -180 and sell when CCI is 300.
Trading is a long process.
To all my friends who have lost in futures , or anywhere else in the market, don't worry, just follow the process and follow your own rules. Don't break them.
You can connect with me on Trading View, message me to discuss this further. Happy to take your questions.
P.S you can also add linear regression to this to give you certain price points, for market tops or bottoms within the time frame.
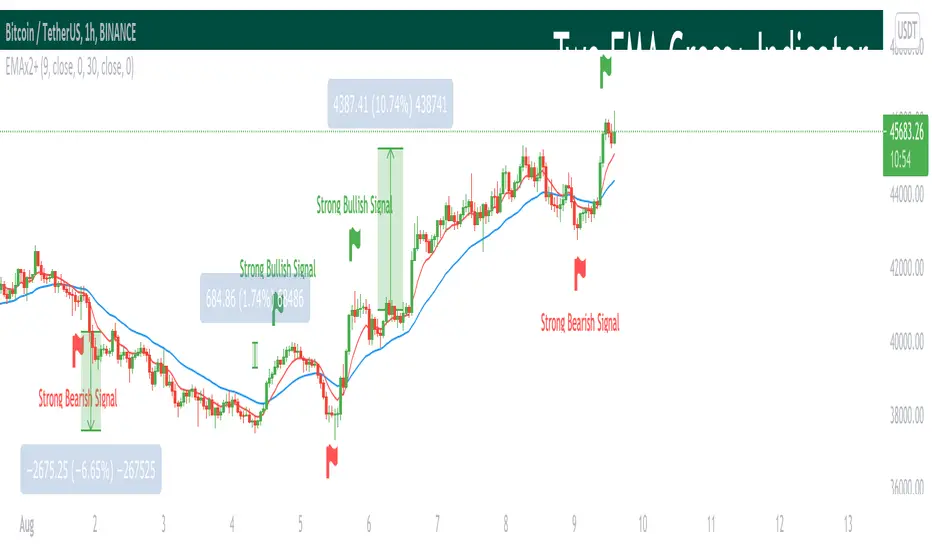
Two EMA Cross+ IndicatorHello traders!
Today we gonna demonstrate out heuristic of classical EMA Indicator. We decided to simplify your trading staff and add some meta data. So, let’s look at it from the very beginning and initially speak about what EMA is and then I’ll tell you why our indicator is extremely convenient and useful.
So, what is EMA? An exponential moving average ( EMA ) is a type of moving average (MA) that places a greater weight and significance on the most recent data points. The exponential moving average is also referred to as the exponentially weighted moving average . An exponentially weighted moving average reacts more significantly to recent price changes than a simple moving average ( SMA ), which applies an equal weight to all observations in the period.
Key takeaways:
-The EMA is a moving average that places a greater weight and significance on the most recent data points.
-Like all moving averages, this technical indicator is used to produce buy and sell signals based on crossovers and divergences from the historical average.
As you know, EMA Cross is one of basic and most popular Entry Indicators. It’s kinda easy to understand and even easier to use. This indicator consists of two EMAs - fast (red line) and slow (blue line). Fast EMA is EMA of less length that the fast EMA (default parameter is 9). Thus, it reacts the price change more actively than the slow. We can say that it takes into consideration the most actual price movements. Speaking about slow EMA (default parameter is 30) it’s more inert and it’s more difficult to change its action vastly. We can say that the EMA «looks» at the historical data more accurate, but doesn’t forget about actual price movements.
But how it works? Trivial. When the fast EMA crosses the slow bellow, it provides bearish signal, whereas when it crosses it above, it’s bullish signal. Even more, we added some «confirmation» factor. As you know, when the price is above the slow EMA, the slow EMA plays the role of support line for price and means that the price is in uptrend. Thus, when we see the cross above and it takes place under the price, we called it «strong Bullish Signal». When the price is bellow the slow EMA, slow EMA is resistance. Thus, when we see the cross bellow and it’s under the slow EMA, we called it «strong Bearish Signal».
To make your trading process easier, we plotted the places of crosses on the chart and added the descriptions of the crosses. The flags mean the place of cross. The default parameters have nice backtest on 1H chart. However, you can also change them depending on your goals and the time period. The places of cross looks like flags (red flag is «bearish» cross, green - «bullish»). As you can see, it’s really convenient.
I hope you’ll enjoy our heuristic of classical EMA Cross. We are sure that the meta data that we are taking into consideration makes the signals more accurate and the deals more profitable. The SkyRock Team with support of Trading View try to make your trading process more successful and profitable. Every day we works in conjunction to boost both your skills and trading balance. We hope, it’s really useful for you, dear traders!