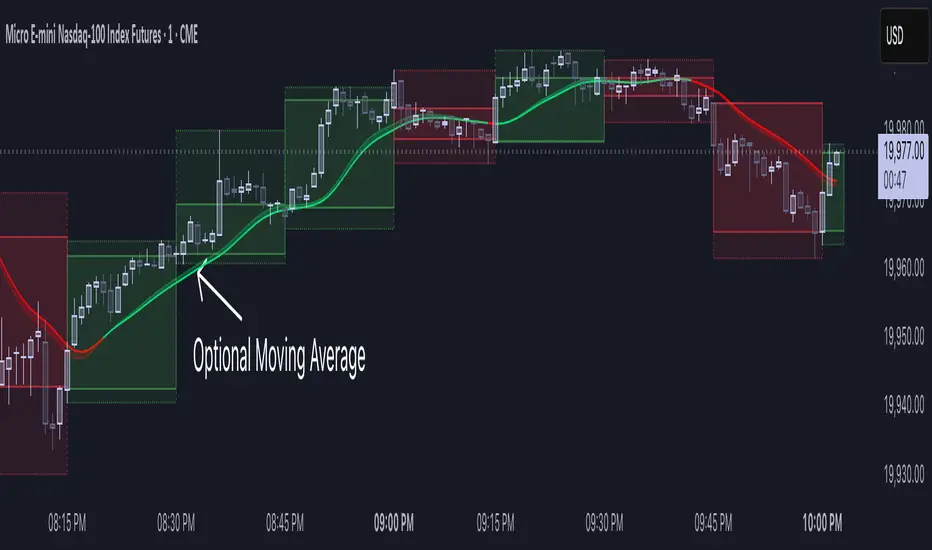
Realtime HTF Candle [NLR]This lightweight indicator displays higher timeframe candles on your current chart - in real-time as they form, not just after they close.
Unlike most HTF candle indicators that only show completed candles (and often feel bloated with too many features), this script updates the current HTF candle live, including its open, high, low, and close as it develops.
🔹 Features:
Draws full-body HTF candles (high-to-low and open-to-close ranges).
Supports any custom HTF (e.g., 15m candles on a 1m chart).
Color-coded boxes to differentiate between bullish and bearish candles.
Live updating HTF candle box as price evolves — no delay.
Optional moving average overlays with smoothing to help track short- and long-term trends.
Perfect for intraday traders who want to stay aligned with higher timeframe structure without clogging up their charts.
Exponential Moving Average (EMA)
TradeDots - Buy Sell Signals ProThe TradeDots - Buy Sell Signals Pro is an advanced technical analysis tool engineered to identify key market turning points and trend continuations. By combining multiple confirmation methods, this indicator provides traders with a comprehensive system for recognizing high-probability entry and exit points across various market conditions.
📝 HOW IT WORKS
Enhanced Supertrend Implementation
Unlike the traditional Supertrend indicator that simply changes color when price crosses above or below a calculated line, our implementation incorporates multiple layers of confirmation:
Advanced Calculation: Uses an enhanced ATR-based algorithm that incorporates trend bias detection and momentum filtering
Multi-Factor Confirmation: Considers price interaction with previous Supertrend values, not just current crossovers
Contextual Awareness: Distinguishes between different entry types based on market risk levels and momentum conditions
Visual Enhancement: Provides background shading to clearly indicate trend direction and strength
Smart Trendline Algorithm
The indicator employs a proprietary Smart Trendline that adapts to market conditions using an advanced moving average system. Unlike traditional moving averages that simply track price, the Smart Trendline incorporates volatility data to change colors based on momentum strength, providing immediate visual feedback about the current market phase with zero lag.
Calculation: Processes price data through selectable advanced calculation methods (including Hull, Jurik, and McGinley averages) with dynamic color-coding based on a modified Keltner Channel system.
Visualization: Green indicates strong bullish momentum, purple represents bearish momentum, and gray signals consolidation or uncertain conditions.
Multi-Signal Confirmation System
The indicator integrates three distinct signal mechanisms to confirm trading opportunities:
1. RSI-Sequential Reversal Signals: Combines RSI levels with seq count patterns to identify potential short-term reversals.
Calculation: Analyzes RSI conditions against specific thresholds while tracking consecutive pattern formations.
Visualization: Green triangles for buy signals and red triangles for sell signals.
2. Statistical Reversal Signals: Identifies statistically significant deviations from normal price behavior.
Calculation: Uses a modified standard deviation approach to determine when price has moved too far from its statistical average.
Visualization: Large green arrows emoji for powerful buy signals and red arrows emoji for powerful sell signals.
3. Supply & Demand Zone Detection: Automatically identifies key price levels where significant buying or selling pressure may exist.
Calculation: Uses RSI extremes combined with confirmation periods to establish high-probability reversal zones.
Visualization: Green-filled areas mark support (demand) zones and red-filled areas mark resistance (supply) zones.
Buy/Sell Signal Generation
The system generates several types of signals with varying strengths:
1. Regular Buy/Sell Signals: Generated when:
Price crosses with MA above/below the Supertrend line
RSI conditions confirm the direction
Candlestick patterns support the signal direction (bullish/bearish candle formation)
Visualized as green/red triangles
2. Strong Buy/Sell Signals: Appear when multiple confirmation factors align:
Regular buy/sell condition is met
Price is interacting with a Supply/Demand zone
Additional momentum confirmation from auxiliary indicators
Seq count reaches significant levels
Statistical Reversal signal confirms the direction
3. Breakout Signals: Special case signals that appear during:
Trend transitions after consolidation
When price breaks through significant resistance/support levels from previous trend
Following pattern completions that suggest increased momentum
Market Structure Analysis
The indicator categorizes market conditions and provides visual cues for traders:
Trend Identification: Supertrend-based algorithm with enhanced visual presentation identifies the prevailing market direction.
Bar Coloring System: Candles change color based on price position relative to EMAs to clearly display strength and direction of momentum
🛠️ HOW TO USE
Signal Interpretation
Buy Signals: "Buy" signals, Green triangles (RSI-Sequential) and large green arrows (Statistical Reversals) appear at potential buy points.
Sell Signals: "Sell" signals, Red triangles (RSI-Sequential) and large red arrows (Statistical Reversals) appear at potential sell points.
Highest Probability Entries: Occur when signals appear near or within Supply & Demand zones.
Trading Strategies
Trend-Following Strategy
1. Identify the main trend using the Smart Trendline color
2. Enter long positions during uptrends when:
Price pulls back to the Smart Trendline
Green triangles or arrows appear
Signals occur near green demand zones
3. Enter short positions during downtrends when:
Price bounces up to the Smart Trendline
Red triangles or arrows appear
Signals occur near red supply zones
Counter-Trend/Reversal Strategy
1. Look for Statistical Reversal arrows at significant price extremes
2. Confirm with an RSI-Sequential signal in the same direction
3. Pay special attention when these signals appear inside Supply & Demand zones
4. Use the Smart Trendline color change as additional confirmation
Multiple Confirmation Technique
For highest probability trades, look for:
Signal alignment (both signal types in same direction)
Supply/Demand zone interaction
Smart Trendline color supporting the signal direction
❗️LIMITATIONS
Signal Lag: The system identifies reversals after they have begun, potentially missing the absolute bottom or top.
False Signals: Can occur during periods of high volatility or range-bound markets.
Timeframe Sensitivity: Some signals work better on higher timeframes for long-term trading, while others are more effective on lower timeframes for short-term trading.
Bar Closing Requirement: All signals are based on closed candles and may be subject to change until the candle closes.
RISK DISCLAIMER
Trading involves substantial risk, and most traders may incur losses. All content, tools, scripts, articles, and education provided by TradeDots are for informational and educational purposes only. Past performance is not indicative of future results.
This indicator should be used as part of a complete trading approach that includes proper risk management, consideration of the broader market context, and confirmation from price action patterns. No trading system can guarantee profits, and users should always exercise caution and use appropriate position sizing.

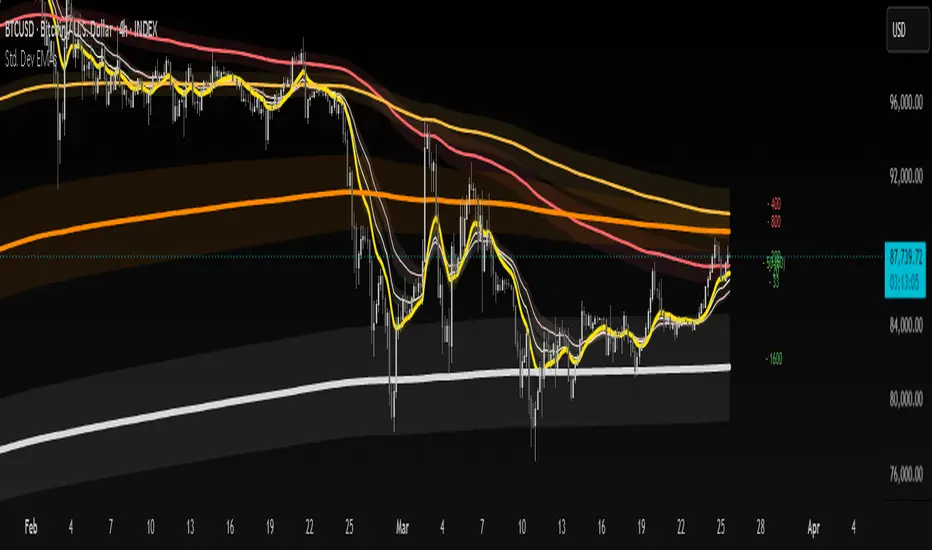
Advanced Standard Deviation EMAs📊 Advanced Standard Deviation EMAs Indicator
This indicator plots up to 7 customizable EMAs with standard deviation channels which helps traders see the potential levels surrounding the EMAs that accounts for recent volatility.
📈 What is Standard Deviation?
Standard deviation is a statistical measure that quantifies the amount of variation or dispersion in a set of values. In trading, it measures how much price movement deviates from the average (mean) price over a specific period. Higher standard deviation indicates higher volatility, while lower values suggest more consistent price action. When applied to EMAs, standard deviation channels help traders identify when price is behaving normally versus when it's making extraordinary moves, potentially signaling trading opportunities or increased risk.
- - - - - - -
✨ Key Features
- Highly Customizable: Each EMA can be independently configured for maximum flexibility
- Multi-Timeframe Analysis: Each EMA can calculate on its own timeframe while displayed on the same chart
- Adaptive Labels: Smart labels show period, timeframe, and trend direction
- Visual Clarity: Fully customizable colors, transparency, and visual elements
🛠️ Per-EMA Customization
Each of the 7 EMAs offers individual control over:
- 📏 Period Length: Set your preferred EMA calculation period
- ⏱️ Timeframe: Calculate each EMA on its own timeframe (defaults to chart timeframe)
- 📏 Standard Deviation Multiplier: Fine-tune channel width with individual multipliers
- 🎨 Colors: Custom colors for lines, fills, and labels
- 🔍 Visibility: Toggle line, fill, and label visibility independently
- 🌫️ Transparency: Adjust fill transparency for each Standard Deviation Channel
🏷️ Smart Labels
Labels automatically display:
1. EMA length (e.g., "- 200")
2. Calculation timeframe when custom (e.g., "- 200 (240)")
3. Trend direction through color
Label colors indicate trend direction:
- 🟢 Green: EMA is trending upward (customizable)
- 🔴 Red: EMA is trending downward (customizable)
⚙️ Global Settings
- Label Offset: Position labels away from price action (default: 20 bars)
- Label Size: Choose from multiple text sizes
- Quick Toggle: Disable all EMA lines and fills with one click while keeping labels
💡 Use Cases
- Multi-timeframe trend analysis
- Dynamic support/resistance identification
- Price volatility assessment
- Trend strength confirmation
- - - - - -
Comment down below if you have any cool feature ideas or want to show your support and give this indicator a like if you're enjoying it :)
Enjoy!
SS
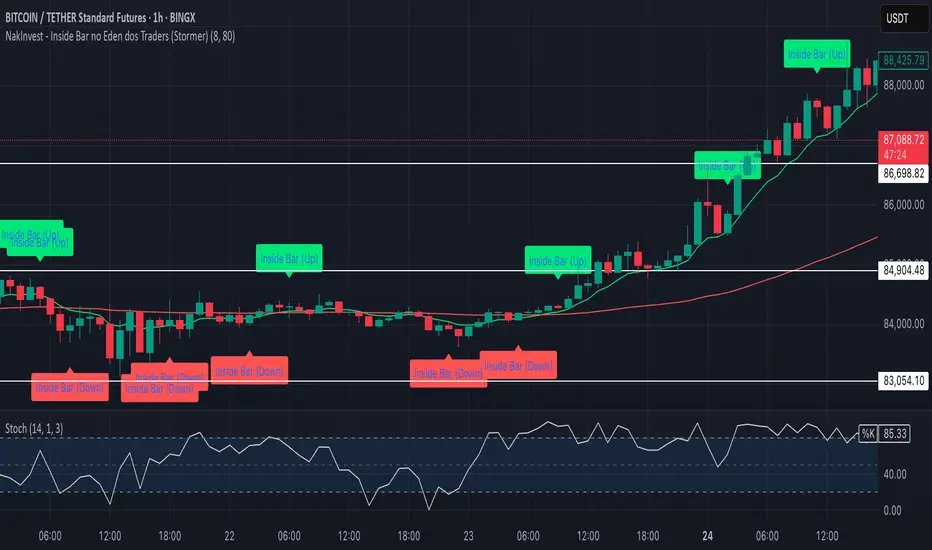
NakInvest - Inside Bar no Eden dos Traders (Stormer)📌 NakInvest - Inside Bar Detector (Éden dos Traders Enhanced Detection)
This indicator is designed to identify Inside Bars that occur during strong trending conditions, following the popular Éden dos Traders strategy by Stormer, famous brazilian trader. It uses the relationship between two EMAs (Short EMA & Long EMA) to determine whether the market is in a bullish or bearish trend, and highlights Inside Bars that meet specific criteria.
⸻
🔍 What This Indicator Does:
1. EMA-Based Trend Detection:
• Identifies Uptrends when the Short EMA is above the Long EMA.
• Identifies Downtrends when the Short EMA is below the Long EMA.
2. Inside Bar Detection:
• An Inside Bar is detected when the entire candle (body & wicks) is contained within the body of the previous candle.
• This pattern suggests consolidation and potential breakouts, especially when found within a strong trend.
3. Debug Mode for Transparency:
• When enabled, provides visual markers to indicate when the conditions for trend detection and Inside Bars are met.
• Helps traders understand why certain candles are detected and others are not.
⸻
📈 How to Use:
• Apply this indicator to any market and timeframe, but it’s most effective on higher timeframes (H1, H4, Daily).
• Ideal for traders looking for trend-continuation setups or reversal signals after periods of consolidation.
• Combine this indicator with other tools (e.g., Volume Analysis, Price Action Patterns) for greater accuracy.
⸻
⚙️ Indicator Settings:
1. Short EMA Length: The period for the fast-moving average (default: 8).
2. Long EMA Length: The period for the slow-moving average (default: 80).
3. Enable Debug Mode: Toggle visibility of debug markers to better understand condition logic.
⸻
📢 Alerts:
This script includes labels for:
• IB (Up): Inside Bar detected during an uptrend.
• IB (Down): Inside Bar detected during a downtrend.
⸻
📌 Disclaimer:
This indicator is intended for educational purposes only and is not financial advice. Always perform your own research and consult with a financial professional before making any trading decisions.
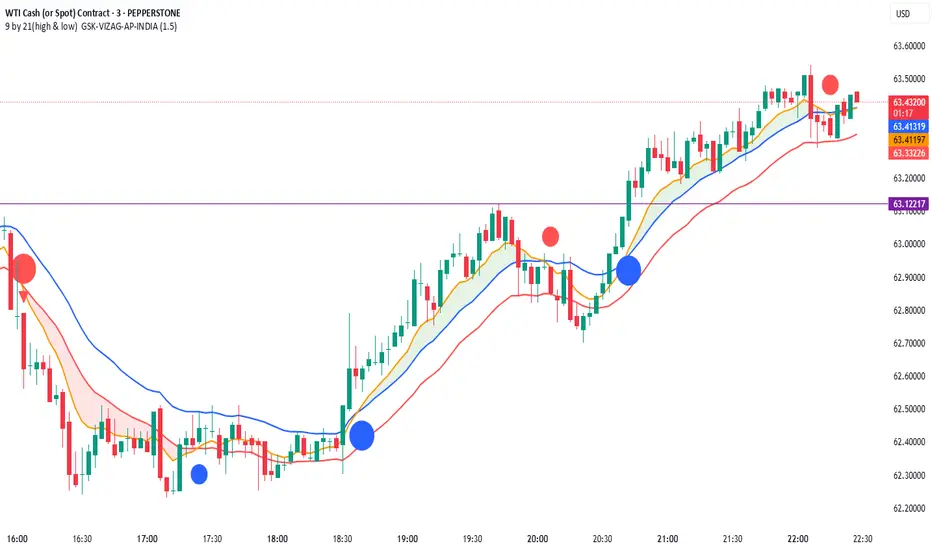
9 by 21(high & low) GSK-VIZAG-AP-INDIA21 EMA High & Low + 9 EMA Crossover with Volume & Wick Confirmation
🔹 What Does This Indicator Do?
This indicator is designed for momentum-based trend trading by combining exponential moving averages (EMAs), price action filters, and volume analysis. It provides traders with high-probability buy and sell signals while filtering out weak trends and false breakouts.
🔹 How Is It Different from Other Indicators?
Unlike traditional EMA crossover strategies that rely only on moving averages, this indicator enhances reliability by incorporating custom volume conditions, price action validation, and wick-based filtering.
Key Features That Make It Unique:
Dynamic EMA Bands for Trend Identification
Uses 21 EMA High & 21 EMA Low as dynamic support & resistance levels, creating a flexible trading range.
Helps traders identify trend strength and potential reversals without relying on static levels.
Enhanced EMA Crossover System
Includes a 9 EMA crossover signal to detect momentum shifts before traditional EMAs react.
Avoids lagging signals often seen in standard moving average crossovers.
Smart Volume-Based Confirmation
Uses a custom volume multiplier to detect significant market participation.
Filters out low-volume breakouts that may lead to false signals.
Wick-Based Filtering for Precision
Identifies candles with no lower wick (for buy signals) and no upper wick (for sell signals) to confirm strong price movements.
Helps traders avoid weak reversals and focus only on strong momentum shifts.
🔹 How to Use This Indicator in Trading?
Buy Conditions:
Bullish candle (green) with no lower wick, confirming strong buying pressure.
Price is above the 21 EMA High and remains above 21 EMA Low.
Volume shows an increase, confirming market participation.
Sell Conditions:
Bearish candle (red) with no upper wick, signaling strong selling pressure.
Price is below the 21 EMA Low and remains under the 21 EMA High.
Volume confirms strong momentum in the downward direction.
Bonus: The indicator also highlights 9 EMA & 21 EMA crossovers to provideearly trend confirmations.
Who Should Use This Indicator?
✅ Intraday Traders – Looking for quick entry and exit signals based on price momentum.
✅ Swing Traders – Who want to identify medium-term trend shifts with volume confirmation.
✅ Trend Followers – Seeking a robust moving average system to avoid false breakouts.
✅ Momentum Traders – Who need price-action-based confirmation before taking a trade.
Why This Indicator Stands Out?
Unlike standard EMA-based indicators that often generate false breakouts, this tool:
✔️ Filters low-quality signals using smart volume analysis.
✔️ Enhances trend confirmation with wick-based filtering.
✔️ Detects momentum early using a unique EMA crossover combination.
This makes it more reliable than traditional moving average-based systems and highly adaptable for different market conditions.
Note: The logic behind this indicator is proprietary and non-repainting, making it a powerful tool for traders who rely on EMA-based trend strategies.
Try it out and see how it improves your trading decisions!
Why This Description Works?
✔ No code exposure – The logic is explained in concept but not in detail.
✔ Clear differentiation – Shows why this is better than other indicators.
✔ Compliant with TradingView rules – No vague claims, but precise explanations.
Would you like to add any specific trading examples or screenshots to further enhance it? Let me know!
Share Your Experience!
Your feedback is valuable! If you find this indicator useful, leave a comment with your experience—how it worked for you, any improvements you suggest, or the best settings you discovered.
Let’s build a community of traders refining strategies together!
Disclaimer:
This indicator is for educational and informational purposes only. It does not guarantee profitable trades and should be used with proper risk management. Always conduct your own research before making trading decisions.
Ripster Trend Labels LT INTRODUCTION
Ripster Trend Labels are Extension of Ripster Clouds on Daily & Hourly & Weekly Timeframe for Long Term Analysis for Swing Traders and Investors
Key Components of the Code:
Initialization:
The script starts with the study function, which sets up the overlay on the chart and titles it "Ripster Trend Labels LT".
Users can customize the position of the trend table on the chart via an input option that allows selection among various placements like top_right, top_center, etc.
EMA Calculations:
Daily EMAs: The script calculates two daily EMAs (21-day and 55-day) using the security function to fetch the daily closing prices, ensuring no lookahead bias.
Weekly EMAs: Similarly, it calculates two weekly EMAs (12-week and 50-week) using weekly closing prices.
1-Hour EMA: A 50-period EMA is calculated based on 1-hour closing prices
Trend Label Determination:
For each timeframe (1-hour, daily, and weekly), the script compares the closing prices with their respective EMAs to determine if the trend is bullish or bearish.
Labels like "Bullish" or "Bearish" are dynamically generated based on these comparisons and are updated in real-time as new data becomes available.
Table Creation and Display:
A table is dynamically generated at the user-specified position on the chart.
The table has rows corresponding to each analyzed timeframe, displaying trend labels which are color-coded (green for bullish, red for bearish) to provide visual cues about the market condition.
Explanation of the Clouds & How to Use:
The strategy employs a multi-timeframe analysis using EMA-based "clouds" to evaluate stock trends from short-term fluctuations to long-term movements. This method allows traders to systematically identify potential bullish reversals or signs of a bearish trend weakening, and to make informed decisions based on the overall alignment of these clouds.
Sequence of Cloud Shifts for Trend Analysis:
Ripster 1-Hour Cloud (34/50 1HR): The first indicator to respond, a bullish shift here signals the initial potential for upward momentum. It serves as an early alert for traders to monitor subsequent clouds for confirmation of trend reversal.
MTF1 20/21 Daily Cloud: A bullish turn following the Ripster 1-Hour Cloud strengthens the reversal signal on a daily timeframe. This cloud's shift adds reliability to the initial bullish signal by confirming sustained daily trend strength.
MTF2 50/55 Daily Cloud: Further confirmation comes from this cloud turning bullish, which underscores a robust daily bullish trend. It solidifies the market's bullish sentiment, indicating a sustainable upward trend.
Weekly 5/12 Cloud: This intermediate-term indicator turning bullish consolidates the bullish signals from shorter timeframes, indicating broader market acceptance and strength of the bullish trend.
Weekly 34/50 Cloud: The bullish shift in this cloud confirms a long-term bullish trend. This is a critical confirmation for long-term traders, indicating that the stock might be entering a strong and sustained upward trajectory.
Overall Cloud Alignment and Strategic Implication ns:
All Clouds Are Bullish: When every cloud from the 1-Hour to the Weekly 34/50 is bullish, it signals a strong, unified bullish market sentiment.
Strategy for Bullish Alignment: Traders should view this as an optimal condition for buying dips. The unanimous bullish signal across all timeframes suggests that any pullbacks are temporary, offering buying opportunities.
Using Other Analysis: Enhance this strategy by confirming dips with other bullish indicators like rebounding from key support resistance levels or any other technical analysis
All Clouds Are Bearish: A bearish alignment across all clouds indicates a pervasive downtrend.
Strategy for Bearish Alignment: Traders are advised to avoid long positions and consider risk management strategies, such as tightening stop-losses or taking short positions.
Complementary Analysis: Confirm bearish trends with additional indicators like breakdowns below key support levels etc
Conclusion:
This cloud-based trend analysis provides a structured way to track market dynamics across multiple timeframes, offering clear signals for entry and exit strategies. By observing the sequential shifts in these clouds, traders can align their trading strategies with both short-term and long-term market trends, enhancing their decision-making process. The integration of other technical tools with this cloud-based analysis not only validates the trend signals but also helps in managing trades more effectively, capitalizing on the comprehensive view of market conditions provided by the clouds.

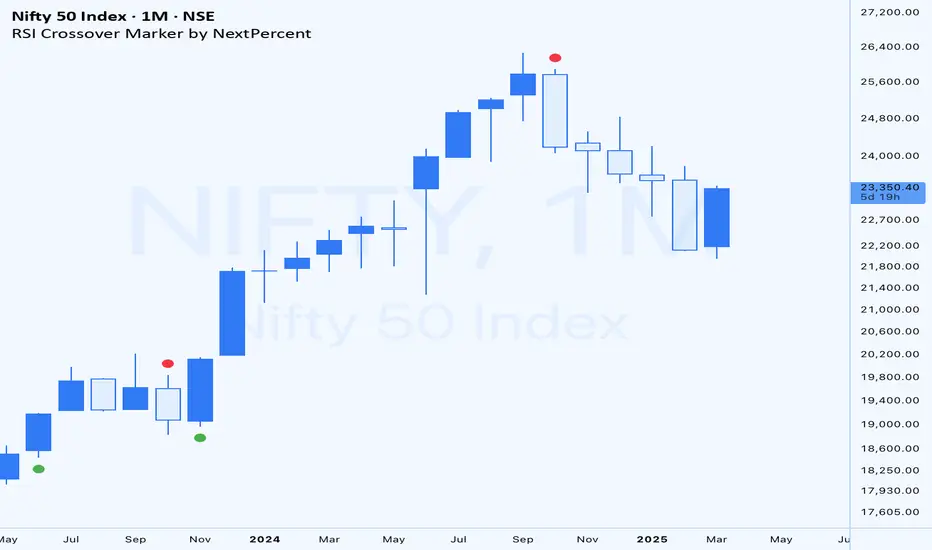
RSI Crossover Marker by NextPercentRSI Crossover Marker by NextPercent
This indicator combines RSI crossovers with moving averages and optional divergence detection to generate trading signals.
Key Features:
• RSI crossover signals with customizable moving average (EMA, SMA, WMA, RMA)
• Optional divergence detection
• Flexible timeframe settings
• Wait for candle close option
• Visual signals using triangles above/below price bars
Signal Generation:
• Bullish Signal: RSI crosses above the moving average
• Bearish Signal: RSI crosses below the moving average
• When divergence is enabled, signals only appear with confirmed divergence patterns
Customizable Parameters:
• RSI Length and Source
• Moving Average Type and Length
• Bollinger Band Standard Deviation
• Timeframe Selection
• Divergence Detection Toggle
Visual Signals:
• Green triangles appear below bars for bullish signals
• Red triangles appear above bars for bearish signals
Note:
This indicator is designed to help identify potential trend reversals and trading opportunities based on RSI momentum and optional divergence confirmation.
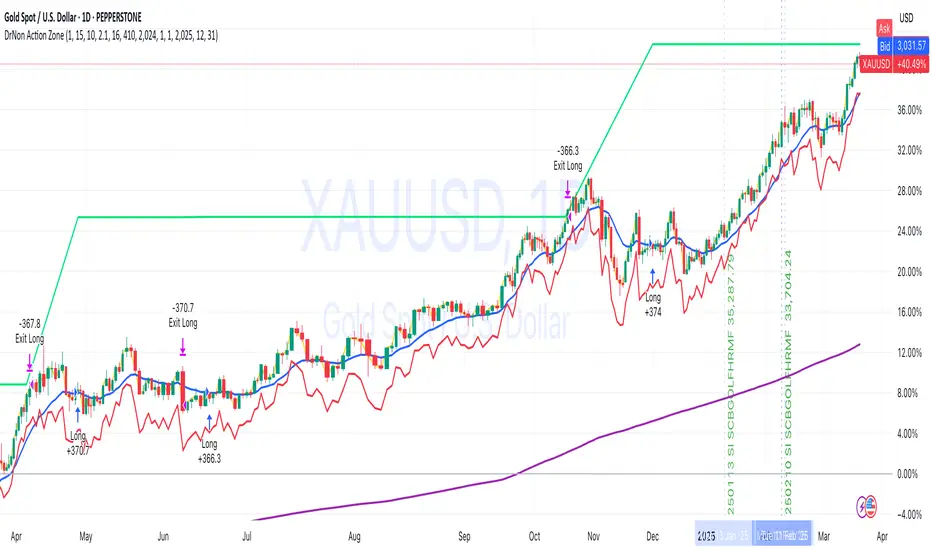
DrNon Action Zone📈 Strategy Title:
DrNon Action Zone — EMA Cross with ATR Stop, % Take-Profit, Alerts & Date Range
⸻
🧠 Strategy Concept:
DrNon Action Zone is a long-only trend-following strategy that enters trades when momentum aligns with long-term trend confirmation. It uses:
• EMA Cross (Fast vs. Slow) to identify momentum shift
• Optional EMA Filter based on days to confirm that price is in a “trend zone”
• ATR-based trailing stop for adaptive risk management
• Percentage Take-Profit for reward targeting
• Date Range Filter for focused backtesting or event-based execution
It also includes alerts, visual signals, and full customization via inputs.
⸻
⚙️ Strategy Inputs Explained:
Input Name Description
Fast EMA Length Period of the short-term EMA used for crossover signals (default: 5)
Slow EMA Length Period of the long-term EMA used for crossover signals (default: 200)
ATR Period Period used to calculate the Average True Range (ATR)
ATR Multiplier Multiplies ATR value to calculate the trailing stop distance
Take-Profit % Percentage above entry price to exit the trade for profit
Use EMA Filter? If enabled, long entries require price to be above a customizable EMA filter
EMA Filter Days Number of days used for EMA filter (converted to bars based on chart timeframe)
Use Date Range? Enable or disable the date filter
Start Date / End Date Specify a custom range to apply the strategy
⸻
✅ Long Entry Conditions (The Action Zone):
A long trade is entered when:
1. EMA(Fast) crosses above EMA(Slow)
2. If EMA Filter is enabled, Close > EMA(Filter Days)
3. If Date Filter is enabled, current candle is within specified start and end dates
⸻
❌ Exit Conditions:
The strategy will close the position when either:
• Price drops to ATR-based trailing stop, OR
• Price reaches the Take-Profit % target
⸻
🛎️ Alerts:
Alert Name Trigger Condition
Long Entry Alert EMA cross and all filters passed (entry signal triggered)
Exit Alert Price hit ATR Stop or Take-Profit (exit signal triggered)
⸻
📊 Visual Elements:
• Yellow Line — Fast EMA
• Blue Line — Slow EMA
• Purple Line — EMA Filter (based on user-defined days)
• Red Line — ATR-based Trailing Stop
• Lime Line — Take-Profit Level
• Green Triangle — Long Entry Signal (on crossover)
⸻
🧪 Backtesting Tips:
• Adjust EMA Filter Days to simulate different trend conditions (e.g., 100d, 150d, 200d).
• Use ATR Multiplier to adapt the stop-loss to market volatility.
• Combine date filtering with known events (e.g., earnings, FOMC meetings).
• Test in multiple timeframes — 1H, 4H, or Daily for stronger signals.
EMA Clouds with Strict Buy/Sell SignalsEMA Clouds with Strict Buy/Sell Signals - Precision Trading Unleashed
Unlock the power of trend-following precision with the EMA Clouds with Strict Buy/Sell Signals indicator, a sophisticated tool built for traders who demand reliability and clarity in their decision-making. Inspired by the legendary Ripster EMA Clouds, this indicator takes the classic cloud concept to the next level by incorporating stricter, high-confidence signals—perfect for navigating the markets on 15-minute or higher timeframes.
Why You’ll Want This on Your Chart:
Dual EMA Clouds for Crystal-Clear Trends: Watch as two dynamic clouds—formed by carefully paired Exponential Moving Averages (8/21 and 34/50)—paint a vivid picture of market momentum. The green short-term cloud and red long-term cloud provide an intuitive, at-a-glance view of trend direction and strength.
Stricter Signals, Fewer False Moves: Tired of chasing weak signals? This indicator only triggers buy and sell signals when the stars align: a cloud crossover (short-term crossing above or below long-term) and price confirmation above or below both clouds. The result? Fewer trades, higher conviction, and a cleaner chart.
Customizable Timeframe Power: Whether you’re a scalper on the 15-minute chart or a swing trader on the daily, tailor the clouds to your preferred higher timeframe (15min, 30min, 1hr, 4hr, or daily) for seamless integration into your strategy.
Visual Mastery Meets Actionable Alerts: Green buy triangles below the bars and red sell triangles above them make spotting opportunities effortless. Pair this with built-in alerts, and you’ll never miss a high-probability trade again.
How It Works:
Buy Signal: Triggers when the short-term cloud crosses above the long-term cloud and the price surges above both, signaling a robust bullish breakout.
Sell Signal: Activates when the short-term cloud dips below the long-term cloud and the price falls beneath both, confirming bearish dominance.
Cloud Visualization: The green cloud (8/21 EMA) tracks fast-moving trends, while the red cloud (34/50 EMA) anchors the broader market direction—together, they filter noise and spotlight tradable moves.
Why Traders Will Love It:
Designed for those who value precision over guesswork, this indicator cuts through market clutter to deliver signals you can trust. Whether you’re trading stocks, forex, crypto, or futures, its adaptability and strict logic make it a must-have tool for serious traders. Customize the EMA lengths, tweak the timeframe, and watch your edge sharpen.
Add EMA Clouds with Strict Buy/Sell Signals to your chart today and experience the confidence of trading with a tool that’s as disciplined as you are. Your next big move is waiting—don’t let it slip away.

Crypto Strategy SUSDT 10 minThis strategy is designed to trade the **SUSDT** pair on a **10-minute time frame**, using a combination of an Exponential Moving Average (EMA) and percentage-based Stop Loss (SL) and Take Profit (TP) levels.
### How the strategy works:
1. **EMA Calculation**:
- The strategy calculates a 24-period Exponential Moving Average (EMA) based on the closing price.
- This EMA serves as the primary trend indicator.
2. **Entry Conditions**:
- **Long Position**: A long position is entered when the closing price is above the EMA and the opening price is below the EMA. This indicates a potential upward trend.
- **Short Position**: A short position is entered when the closing price is below the EMA and the opening price is above the EMA. This indicates a potential downward trend.
3. **Stop Loss and Take Profit**:
- Both Stop Loss (SL) and Take Profit (TP) are calculated based on the entry price of the position.
- **For Long Positions**:
- Stop Loss is set as a percentage below the entry price.
- Take Profit is set as a percentage above the entry price.
- **For Short Positions**:
- Stop Loss is set as a percentage above the entry price.
- Take Profit is set as a percentage below the entry price.
- The percentage values for SL and TP can be adjusted in the strategy's settings (default: SL = 2%, TP = 4%).
4. **Exit Conditions**:
- The position is closed automatically when either the Stop Loss or Take Profit level is reached.
5. **Visualization**:
- The 24-period EMA is plotted on the chart as a blue line, helping visualize the trend direction.
### Key Features:
- **Pair and Time Frame**: The strategy is optimized for the SUSDT pair on a 10-minute time frame.
- **Customizable Parameters**: Users can adjust the Stop Loss and Take Profit percentages to suit their risk tolerance and trading style.
- **Trend-Following Approach**: The strategy uses the EMA to identify and follow the current market trend.
This strategy is simple yet effective for capturing trends while managing risk through predefined Stop Loss and Take Profit levels.

Air Gap MTF with alert settingsWhat it shows:
This indicator will show a horizontal line at a price where each EMAs are on on different time frames, which will remove the effort of having to flick through different time frames or look at different chart.
The lines itself will move in real time as price moves and therefore as the EMA values changes so no need to manually adjustment the lines.
How to use it:
The price gap between each of the lines are known as "air gaps", which are essentially zones price can move with less resistance. Therefore bigger the airgap there is more likely more movement in price.
In other words, where lines are can be a resistance (or support) and can expect price stagnation or rejection.
On the chart it is clear to see lines are acting as resistances/supports.
Key settings:
The time frame are fixed to: 30min, 1hr and 4hr. This cannot be changed as of now.
EMA values for each time frame are user changeable in the settings, and up to 4 different values can be chosen for each time frame. Default is 5,12,34 and 50 for each timeframe.
Line colour, thickness and style can be user adjusted. Start point for where line will be drawn can be changed in the settings, either: start of day, user defined start or across the chart. In case of user defined scenario user can input a number that specifies a offset from current candle.
Label colour, font, alignment, text size and text itself can be user adjusted in the settings. Price can be also displayed if user chooses to do so. Position of label (offset from current candle) is user specified and can be adjusted by the user.
Both the lines and labels can be turned off (both and individually), for each lines.
Alert Settings:
Manually, user can set alerts for when price crosses a specific line.
This can be done by:
right click on any of line
choose first option (add alert on...)
On the second option under condition, use the dropdown menu to choose the desired EMA/timeframe to set alert for.
Hit "create" at bottom right of option
----------------------------------------------------------------------
If anything is not clear please let me know!

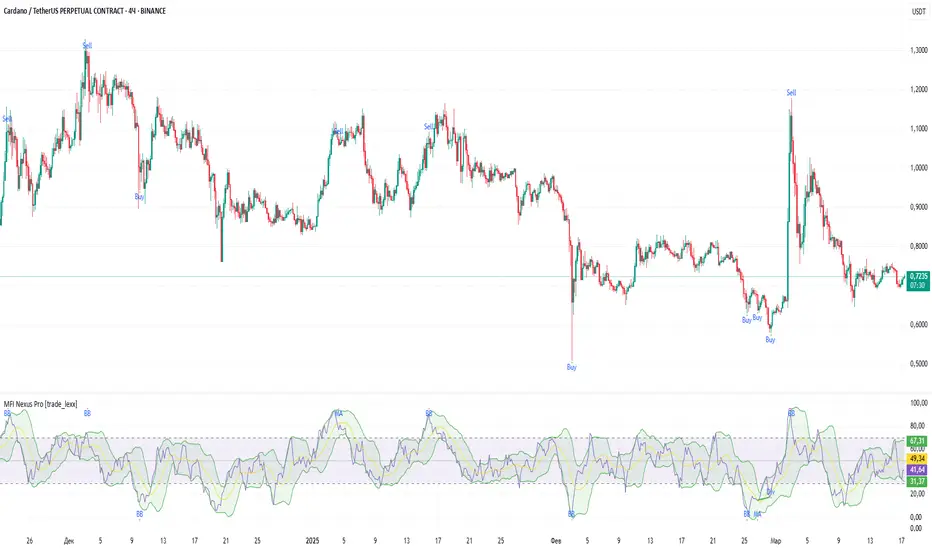
MFI Nexus Pro [trade_lexx]📈 MFI Nexus Pro is your reliable trading assistant!
📊 What is MFI Nexus Pro ?
MFI Nexus Pro is a trading indicator that analyzes cash flows in the market. It shows where money is moving — into or out of an asset, and based on this, generates buy or sell signals.
💡 The main components of the indicator
📊 The MFI Cash Flow Index (MFI)
shows the strength of cash flow into an asset. Values above 70 indicate overbought (an early sale is possible), and values below 30 indicate oversold (an early purchase is possible).
📈 Moving Averages (MA)
The indicator uses 10 different types of moving averages to smooth the MFI line.:
- SMA: Simple moving average
- EMA: Exponential moving average
- WMA: Weighted moving average
And other more complex types (HMA, KAMA, VWMA, ALMA, TEMA, ZLEMA, DEMA)
The choice of the type of moving average affects the speed of the indicator's response to market changes.
🎯 Bollinger Bands (BB)
Bands around the moving average that widen and narrow depending on volatility. They help determine when the MFI is out of the normal range.
🔄 Divergences
Divergences show discrepancies between price and MFI:
- Bullish divergence: the price is falling and the MFI is rising — an upward reversal is possible
- Bearish divergence: the price is rising and the MFI is falling — a downward reversal is possible
🔍 Indicator signals
1️⃣ Moving average signals (MA)
Buy signal
- What happens: MFI crosses its moving average from bottom to top
- What does it look like: the green triangle labeled "MA" under the chart
- What does it mean: money begins to actively flow into the asset, price growth is possible
Sell signal
- What happens: the MFI crosses the moving average from top to bottom
- What does it look like: a red triangle with the label "MA" above the chart
- What does it mean: money starts to leave the asset, the price may fall
2️⃣ Bollinger Band Signals (BB)
Buy signal
- What's happening: The MFI crosses the lower Bollinger band from bottom to top
- What it looks like: the green triangle marked "BB"
- What it means: The MFI was too low and is now starting to recover
Sell Signal
- What's going on: MFI crosses the upper Bollinger band from top to bottom
- What it looks like: a red triangle marked "BB"
- What it means: The MFI was too high and is now starting to decline
3️⃣ Divergence Signals (Div)
Buy Signal (Bullish Divergence)
- What's going on: the price is falling more than the MFI
- What it looks like: a green triangle marked "Div"
- What it means: despite the fall in price, money is already starting to return to the asset
Sell signal (bearish divergence)
- What is happening: the price is rising more strongly than the MFI
- What does it look like: the red triangle with the label "Div"
- What does it mean: despite the price increase, money is already starting to leave the asset
🛠️ Filters to filter out false signals
1️⃣ Minimum distance between the signals
- What it does: sets the minimum number of candles between signals
- Why it is needed: prevents signals from being too frequent during strong market fluctuations
- How to set it up: Set the number from 0 and above (default: 5)
2️⃣ "Waiting for the opposite signal" mode
- What it does: waits for a signal in the opposite direction before generating a new signal
- Why you need it: it helps you not to miss important trend reversals
- How to set up: just turn the function on or off
3️⃣ Filter by MFI levels
- What it does: generates signals only when the MFI is in the specified ranges
- Why it is needed: it helps to catch the moments when the market is oversold or overbought
- How to set up:
- For buy signals: set a range for oversold (e.g. 1-30)
- For sell signals: set a range for overbought (e.g. 70-100)
4️⃣ The RSI filter
- What it does: additionally checks the RSI values to confirm the signals
- Why it is needed: adds additional confirmation from another popular indicator
- How to set up: Similar to the MFI filter, set ranges for buying and selling
🔄 Signal combination modes
1️⃣ Normal mode ("None")
- How it works: all signals (MA, BB, Div) work independently of each other
- When to use it: for general market analysis or when learning how to work with the indicator
2️⃣ "And" mode ("MA and BB and Div")
- How it works: the alarm appears only when several conditions are triggered simultaneously
- Combination options:
- MA+BB: signals from the moving average and Bollinger bands
- MA+Div: signals from the moving average and divergence
- BB+Div: signals from the Bollinger bands and divergence
- MA+BB+Div: all three signals simultaneously
- When to use: for more reliable but rare signals
3️⃣ "OR" mode ("MA or BB or Div")
- How it works: the alarm appears when any of the conditions are triggered
- When to use: for frequent signals when you don't want to miss any opportunity.
🔌 Connecting to trading strategies
The indicator can be connected to your trading strategies using 5 different channels.:
1. Channel for MA signals: connects only signals from moving averages
2. BB signal channel: connects only the signals from the Bollinger bands
3. Channel for divergence signals: connects only divergence signals
4. Channel for "And" mode: connects only combined signals
5. Channel for "OR" mode: connects signals from any source
🔔 Setting up alerts
The indicator can send alerts when alarms appear.:
- Alerts for MA: when the MFI crosses the moving average
- Alerts for BB: when the MFI crosses the Bollinger bands
- Divergence alerts: when a divergence is detected
- Combined alerts: for "AND" and "OR" modes
🎭 What does the indicator look like on the chart ?
- MFI main line: purple line
- Overbought/oversold levels: horizontal lines at levels 30 and 70
- Middle line: dotted line at level 50
- MFI Moving Average: yellow line
- Bollinger bands: green lines around the moving average
- Signals: green and red triangles with corresponding labels
📚 How to start using MFI Nexus Pro
1️⃣ Initial setup
- Add an indicator to your chart
- Select the type of moving average and the period (you can leave it as the default)
- Activate the desired signal types (MA, BB, Div)
2️⃣ Filter settings
- Set the distance between the signals to get rid of unnecessary noise
- Adjust the MFI and RSI levels depending on how volatile your asset is
- If you need more reliable signals, turn on the "Waiting for the opposite signal" mode.
3️⃣ Operation mode selection
- First, use the standard mode to see all possible signals.
- When you get comfortable, try the "And" mode for more reliable signals.
- For active trading, you can use the "OR" mode
4️⃣ Setting up Alerts
- Select the types of signals you want to be notified about
- Set up alerts for "AND" or "OR" modes if you use them
5️⃣ Verification and adaptation
- Check the operation of the indicator on historical data
- Adjust the parameters for a specific asset
- Adapt the settings to your trading style
🌟 Usage examples
For trend trading
- Use MA signals in the direction of the main trend
- Turn on the "Waiting for the opposite signal" mode
- Set stricter levels for filters
For trading in a sideways range
- Use BB signals to detect bounces from the range boundaries
- Use the MFI level filter to confirm overbought/oversold conditions
- Adjust the Bollinger bands according to the width of the range
To determine the pivot points
- Pay attention to the divergence signals
- Use the "And" mode by combining divergences with other signals
- Check the RSI filter for additional confirmation
Renz-GPT IndicatorThe Renz-GPT Indicator is a powerful, all-in-one trading tool designed to simplify decision-making and improve trade accuracy using a combination of trend, momentum, and volume analysis.
🔍 How It Works
Trend Detection:
Uses two EMAs (Exponential Moving Averages) to identify the current market trend.
A higher timeframe EMA acts as a trend filter to align trades with the larger market trend.
Momentum Confirmation:
RSI (Relative Strength Index) confirms the momentum strength.
Only takes trades when the momentum aligns with the trend.
Volume Confirmation:
Uses On-Balance Volume (OBV) to verify if volume supports the trend direction.
Signal Calculation:
Combines trend, momentum, and volume signals to create a high-probability trade setup.
Filters out weak signals to avoid false trades.
Entry, Stop Loss & Take Profit:
Displays clear LONG and SHORT markers on the chart.
Automatically calculates and displays Stop Loss and Take Profit levels based on ATR (Average True Range).
Alerts:
Sends real-time alerts when a valid buy or sell signal occurs.
Alerts include entry price, stop loss, and take profit levels.

Best MA Pair Finder (Crossover Strategy)This indicator automatically identifies the optimal pair of moving averages (MAs) for a crossover strategy using all available historical data. It offers several MA options—including SMA, EMA, and TEMA—allowing users to select the desired type in the settings. The indicator supports two strategy modes: “Long Only” and “Buy & Sell”, which can be chosen via the options.
For each MA pair combination, the indicator performs a backtest and calculates the profit factor, considering only those pairs where the total number of trades meets or exceeds the user-defined "Minimum Trades" threshold. This parameter ensures that the selected optimal pair is based on a statistically meaningful sample rather than on a limited number of trades.
The results provided by this indicator are based on historical data and backtests, which may not guarantee future performance. Users should conduct their own analysis and use proper risk management before making trading decisions.

iD EMARSI on ChartSCRIPT OVERVIEW
The EMARSI indicator is an advanced technical analysis tool that maps RSI values directly onto price charts. With adaptive scaling capabilities, it provides a unique visualization of momentum that flows naturally with price action, making it particularly valuable for FOREX and low-priced securities trading.
KEY FEATURES
1 PRICE MAPPED RSI VISUALIZATION
Unlike traditional RSI that displays in a separate window, EMARSI plots the RSI directly on the price chart, creating a flowing line that identifies momentum shifts within the context of price action:
// Map RSI to price chart with better scaling
mappedRsi = useAdaptiveScaling ?
median + ((rsi - 50) / 50 * (pQH - pQL) / 2 * math.min(1.0, 1/scalingFactor)) :
down == pQL ? pQH : up == pQL ? pQL : median - (median / (1 + up / down))
2 ADAPTIVE SCALING SYSTEM
The script features an intelligent scaling system that automatically adjusts to different market conditions and price levels:
// Calculate adaptive scaling factor based on selected method
scalingFactor = if scalingMethod == "ATR-Based"
math.min(maxScalingFactor, math.max(1.0, minTickSize / (atrValue/avgPrice)))
else if scalingMethod == "Price-Based"
math.min(maxScalingFactor, math.max(1.0, math.sqrt(100 / math.max(avgPrice, 0.01))))
else // Volume-Based
math.min(maxScalingFactor, math.max(1.0, math.sqrt(1000000 / math.max(volume, 100))))
3 MODIFIED RSI CALCULATION
EMARSI uses a specially formulated RSI calculation that works with an adaptive base value to maintain consistency across different price ranges:
// Adaptive RSI Base based on price levels to improve flow
adaptiveRsiBase = useAdaptiveScaling ? rsiBase * scalingFactor : rsiBase
// Calculate RSI components with adaptivity
up = ta.rma(math.max(ta.change(rsiSourceInput), adaptiveRsiBase), emaSlowLength)
down = ta.rma(-math.min(ta.change(rsiSourceInput), adaptiveRsiBase), rsiLengthInput)
// Improved RSI calculation with value constraint
rsi = down == 0 ? 100 : up == 0 ? 0 : 100 - (100 / (1 + up / down))
4 MOVING AVERAGE CROSSOVER SYSTEM
The indicator creates a smooth moving average of the RSI line, enabling a crossover system that generates trading signals:
// Calculate MA of mapped RSI
rsiMA = ma(mappedRsi, emaSlowLength, maTypeInput)
// Strategy entries
if ta.crossover(mappedRsi, rsiMA)
strategy.entry("RSI Long", strategy.long)
if ta.crossunder(mappedRsi, rsiMA)
strategy.entry("RSI Short", strategy.short)
5 VISUAL REFERENCE FRAMEWORK
The script includes visual guides that help interpret the RSI movement within the context of recent price action:
// Calculate pivot high and low
pQH = ta.highest(high, hlLen)
pQL = ta.lowest(low, hlLen)
median = (pQH + pQL) / 2
// Plotting
plot(pQH, "Pivot High", color=color.rgb(82, 228, 102, 90))
plot(pQL, "Pivot Low", color=color.rgb(231, 65, 65, 90))
med = plot(median, style=plot.style_steplinebr, linewidth=1, color=color.rgb(238, 101, 59, 90))
6 DYNAMIC COLOR SYSTEM
The indicator uses color fills to clearly visualize the relationship between the RSI and its moving average:
// Color fills based on RSI vs MA
colUp = mappedRsi > rsiMA ? input.color(color.rgb(128, 255, 0), '', group= 'RSI > EMA', inline= 'up') :
input.color(color.rgb(240, 9, 9, 95), '', group= 'RSI < EMA', inline= 'dn')
colDn = mappedRsi > rsiMA ? input.color(color.rgb(0, 230, 35, 95), '', group= 'RSI > EMA', inline= 'up') :
input.color(color.rgb(255, 47, 0), '', group= 'RSI < EMA', inline= 'dn')
fill(rsiPlot, emarsi, mappedRsi > rsiMA ? pQH : rsiMA, mappedRsi > rsiMA ? rsiMA : pQL, colUp, colDn)
7 REAL TIME PARAMETER MONITORING
A transparent information panel provides real-time feedback on the adaptive parameters being applied:
// Information display
var table infoPanel = table.new(position.top_right, 2, 3, bgcolor=color.rgb(0, 0, 0, 80))
if barstate.islast
table.cell(infoPanel, 0, 0, "Current Scaling Factor", text_color=color.white)
table.cell(infoPanel, 1, 0, str.tostring(scalingFactor, "#.###"), text_color=color.white)
table.cell(infoPanel, 0, 1, "Adaptive RSI Base", text_color=color.white)
table.cell(infoPanel, 1, 1, str.tostring(adaptiveRsiBase, "#.####"), text_color=color.white)
BENEFITS FOR TRADERS
INTUITIVE MOMENTUM VISUALIZATION
By mapping RSI directly onto the price chart, traders can immediately see the relationship between momentum and price without switching between different indicator windows.
ADAPTIVE TO ANY MARKET CONDITION
The three scaling methods (ATR-Based, Price-Based, and Volume-Based) ensure the indicator performs consistently across different market conditions, volatility regimes, and price levels.
PREVENTS EXTREME VALUES
The adaptive scaling system prevents the RSI from generating extreme values that exceed chart boundaries when trading low-priced securities or during high volatility periods.
CLEAR TRADING SIGNALS
The RSI and moving average crossover system provides clear entry signals that are visually reinforced through color changes, making it easy to identify potential trading opportunities.
SUITABLE FOR MULTIPLE TIMEFRAMES
The indicator works effectively across multiple timeframes, from intraday to daily charts, making it versatile for different trading styles and strategies.
TRANSPARENT PARAMETER ADJUSTMENT
The information panel provides real-time feedback on how the adaptive system is adjusting to current market conditions, helping traders understand why the indicator is behaving as it is.
CUSTOMIZABLE VISUALIZATION
Multiple visualization options including Bollinger Bands, different moving average types, and customizable colors allow traders to adapt the indicator to their personal preferences.
CONCLUSION
The EMARSI indicator represents a significant advancement in RSI visualization by directly mapping momentum onto price charts with adaptive scaling. This approach makes momentum shifts more intuitive to identify and helps prevent the scaling issues that commonly affect RSI-based indicators when applied to low-priced securities or volatile markets.

TradZoo - EMA Crossover IndicatorDescription:
This EMA Crossover Trading Strategy is designed to provide precise Buy and Sell signals with confirmation, defined targets, and stop-loss levels, ensuring strong risk management. Additionally, a 30-candle gap rule is implemented to avoid frequent signals and enhance trade accuracy.
📌 Strategy Logic
✅ Exponential Moving Averages (EMAs):
Uses EMA 50 & EMA 200 for trend direction.
Buy signals occur when price action confirms EMA crossovers.
✅ Entry Confirmation:
Buy Signal: Occurs when either the current or previous candle touches the 200 EMA, and the next candle closes above the previous candle’s close.
Sell Signal: Occurs when either the current or previous candle touches the 200 EMA, and the next candle closes below the previous candle’s close.
✅ 30-Candle Gap Rule:
Prevents frequent entries by ensuring at least 30 candles pass before the next trade.
Improves signal quality and prevents excessive trading.
🎯 Target & Stop-Loss Calculation
✅ Buy Position:
Target: 2X the difference between the last candle’s close and the lowest low of the last 2 candles.
Stop Loss: The lowest low of the last 2 candles.
✅ Sell Position:
Target: 2X the difference between the last candle’s close and the highest high of the last 2 candles.
Stop Loss: The highest high of the last 2 candles.
📊 Visual Features
✅ Buy & Sell Signals:
Green Upward Arrow → Buy Signal
Red Downward Arrow → Sell Signal
✅ Target Levels:
Green Dotted Line: Buy Target
Red Dotted Line: Sell Target
✅ Stop Loss Levels:
Dark Red Solid Line: Stop Loss for Buy/Sell
💡 How to Use
🔹 Ideal for trend-following traders using EMAs.
🔹 Works best in volatile & trending markets (avoid sideways ranges).
🔹 Can be combined with RSI, MACD, or price action levels for added confluence.
🔹 Recommended timeframes: 1M, 5M, 15m, 1H, 4H, Daily (for best results).
🚀 Try this strategy and enhance your trading decisions with structured risk management!

EMAsShow up to 5 EMAs on the chart at the same time.
This only shows the current price of the EMA.
You can use any timeframe you like, but it only works for EMAs on higher timeframe.
NOTE: The script will break if you set an EMA to 0 even if it is disabled.

EMA Sniper – Precision Trading with EMA 21/50Title: EMA Sniper – Precision Trading with EMA 21/50
Description:
🚀 EMA Sniper is a powerful trading tool designed to identify trend shifts with precision using the EMA 21/50 crossover, while also displaying Stop Loss (SL) and Take Profit (TP) levels directly on the chart.
🔹 Features:
✅ EMA 21/50 Crossover Signals – Buy signals appear when EMA 21 crosses above EMA 50, and sell signals appear when EMA 21 crosses below EMA 50.
✅ Smart Stop Loss & Take Profit – SL is dynamically placed below/above EMA 50 for optimized risk management, while TP follows a 2:1 risk/reward ratio.
✅ Clear Visual Alerts – The indicator plots SL and TP levels as lines on the chart, along with buy and sell markers for quick decision-making.
✅ Multi-Market & Multi-Timeframe – Works across forex, crypto, stocks, and indices on any timeframe.
🚀 Perfect for traders looking for a structured approach to trend-based trading!
Let me know if you’d like any modifications! 🔥

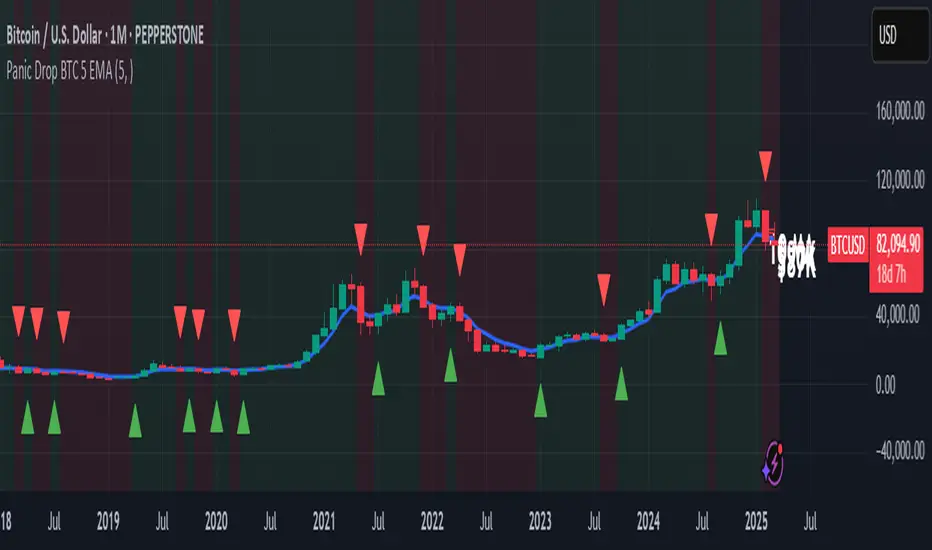
Panic Drop Bitcoin 5 EMA Buy & Sell SignalPanic Drop BTC 5 EMA
What It Does:
This indicator tracks Bitcoin’s price against a 5-period Exponential Moving Average (EMA) to deliver simple buy and sell signals. A green arrow below the candle signals a buy when Bitcoin closes above the 5-EMA, while a red arrow above signals a sell when it closes below. Perfect for spotting Bitcoin’s momentum shifts—whether you’re a newbie, crypto trader, or short on time.
Key Features:
Plots a customizable 5-EMA (default: blue line).
Buy () and Sell () signals on crossovers/crossunders.
Optional background highlight: green (above EMA), red (below).
Alerts for buy/sell triggers.
Fully adjustable: timeframe, colors, signal toggles.
How to Use It:
Add to your BTC/USD chart (works on any timeframe—daily default recommended).
Watch for green arrows (buy) below candles and red arrows (sell) above.
Customize via settings:
Adjust EMA period (default: 5).
Set timeframe (e.g., "D" for daily, "1H" for hourly).
Change colors or toggle signals/background off.
Set alerts: Right-click a signal > "Add Alert" > Select "Buy Signal" or "Sell Signal."
Trade smart: Use signals to catch Bitcoin dips (e.g., buy below $100K) or exits.
Why It’s Great:
Beginners: Clear arrows simplify decisions.
Crypto Traders: 5-EMA catches Bitcoin’s fast moves.
Busy Investors: Signals save time—no deep analysis needed.
Created by Timothy Assi (Panic Drop), eToro’s elite investor. Test it, tweak it, and trade with confidence!
GRIM309 CallPut StrategyThis draws the 5, 10, 20, 50 and 200 EMA lines.
It creates suggestions of when to open and close call positions (GREEN) as well as open and close put positions (RED) it has a early warning system, and in case there is a spike between the last 5 positions it will signal close the position, this is optional (isWarning)
There is also a cooldown period, when set at 2 it means wait a position before initiating another, I did not like the position closing and then opening directly afterwards, you could cooldown for 3 and skip 2 candles or more etc. Set to 1 then it will open/close without cooling down.
Additionally the very bottom shows wether it is in an uptrend or downtrend currently (Yellow triangle)
Moving Average Shift [ChartPrime]Moving Average Shift indicator combines multiple moving average (MA) types with a unique MA Shift Oscillator to help traders visualize trend direction, price deviations, and mean reversion states.
⯁ KEY FEATURES
Customizable Moving Averages: Choose from SMA, EMA, SMMA (RMA), WMA, or VWMA.
Trend-Based Coloring: Candles are dynamically colored based on price position relative to the MA.
MA Shift Oscillator: Identifies price deviations and potential mean reversion zones.
Threshold Filtering: Helps filter mean reversion signals using a user-defined threshold.
Diamond Signals for Mean Reversion: Plots diamonds on the chart when the oscillator crosses back above or below the threshold level.
Oscillator Color Coding: The oscillator has four color states:
Color 1: Above 0 and increasing.
Color 2: Above 0 and decreasing.
Color 3: Below 0 and increasing.
Color 4: Below 0 and decreasing.
⯁ HOW TO USE
Use the indicator to follow the trend based on MA direction and price relation to it.
The MA Shift Oscillator helps identify potential mean reversion points where price may revert toward the MA.
The threshold setting allows traders to filter out weak mean reversion signals and focus on significant shifts.
The four-color oscillator visually indicates trend momentum and potential trend shifts.
⯁ CONCLUSION
The Moving Average Shift indicator is a powerful tool that merges trend-following and mean reversion strategies into one comprehensive system. By allowing traders to select different types of moving averages, it provides flexibility in trend analysis while visually enhancing price action with dynamic candle coloring. The MA Shift Oscillator further strengthens decision-making by detecting deviations and highlighting potential mean reversion points.
Multi-Timeframe EMA [TradeWithRon]Multi-Timeframe EMA Indicator
This indicator displays an Exponential Moving Average (EMA) from a higher timeframe on a lower timeframe chart. The EMA is a type of moving average that gives more weight to recent prices, making it more responsive to price changes compared to a Simple Moving Average (SMA). By overlaying a higher timeframe EMA on a lower timeframe chart, you can gain insights into the broader trend while analyzing price action at a more granular level.
🔶 FEATURES
* 5 MTF EMA with price and timeframe labels
* Smoothing: Alter the smoothness of the back-end EMA calculations.
* VWAP
Why Use EMA
Trend Identification: When the price is above the EMA, it suggests an uptrend, while a price below the EMA indicates a downtrend. The steeper the slope of the EMA, the stronger the trend.
Crossovers : A common strategy is to look for crossovers, such as when a short-term EMA crosses above a long-term EMA, signaling a potential buying opportunity (bullish crossover), or when a short-term EMA crosses below a long-term EMA, signaling a potential selling opportunity (bearish crossover).
Support and Resistance : EMAs can act as dynamic support and resistance levels. In an uptrend, the price may bounce off the EMA as support, while in a downtrend, it can act as resistance.
Convergence and Divergence: Traders look for divergences between price and the EMA to spot potential trend reversals. For example, if price makes a new high but the EMA doesn't, it could signal weakening momentum.
Overall, the EMA helps traders follow the market trend, spot potential reversals, and make more informed trading decisions.
After EMA Crosses you may experience A MSS, CISD, SFP. You can use all of these as confluence for a higher probability trade. This is a good way to capitalize on a trade
Another Case
How I Personally Use It:
Shortest EMA ( Example: 10 EMA ) = Entry
Middle EMA ( Example: 50 EMA ) = Short Term Support / Resistance
Longest EMA ( Example: 100 EMA ) = Long Term Support / Resistance
• WARNING
- If your MAIN chart TimeFrame its lower than ( selected TimeFrame ) the Table will not display signals
- Historical Data Unavailable for this resolution is under 2 minute chart, So you will have to use 2 minute and higher
🔶 Disclaimer
Use with Caution: This indicator is provided for educational and informational purposes only and should not be considered as financial advice. Users should exercise caution and perform their own analysis before making trading decisions based on the indicator's signals.
Not Financial Advice: The information provided by this indicator does not constitute financial advice, and the creator (Tradewithron) shall not be held responsible for any trading losses incurred as a result of using this indicator.
Backtesting Recommended: Traders are encouraged to backtest the indicator thoroughly on historical data before using it in live trading to assess its performance and suitability for their trading strategies.
Risk Management: Trading involves inherent risks, and users should implement proper risk management strategies, including but not limited to stop-loss orders and position sizing, to mitigate potential losses.
No Guarantees: The accuracy and reliability of the indicator's signals cannot be guaranteed, as they are based on historical price data and past performance may not be indicative of future results.

BBVOL SwiftEdgeBBVOL SwiftEdge – Precision Scalping with Volume and Trend Filtering
Optimized for scalping and short-term trading on fast-moving markets (e.g., 1-minute charts), BBVOL SwiftEdge combines Bollinger Bands, Heikin Ashi smoothing, volume momentum, and EMA trend alignment to deliver actionable buy/sell signals with visual trend cues. Ideal for forex, crypto, and stocks.
What Makes BBVOL SwiftEdge Unique?
Unlike traditional Bollinger Bands scripts that focus solely on price volatility, BBVOL SwiftEdge enhances signal precision by:
Using Heikin Ashi to filter out noise and confirm trend direction, reducing false signals in choppy markets.
Incorporating volume analysis to ensure signals align with significant buying or selling pressure (customizable thresholds).
Adding an EMA overlay to keep trades in sync with the short-term trend.
Coloring candlesticks (green for bullish, red for bearish, purple for consolidation) to visually highlight market conditions at a glance.
How Does It Work?
Buy Signal: Triggers when price crosses above the lower Bollinger Band, Heikin Ashi shows bullish momentum (close > open), buy volume exceeds your set threshold (default 30%), and price is above the EMA. A green triangle appears below the candle.
Sell Signal: Triggers when price crosses below the upper Bollinger Band, Heikin Ashi turns bearish (close < open), sell volume exceeds the threshold (default 30%), and price is below the EMA. A red triangle appears above the candle.
Trend Visualization: Candles turn green when price is significantly above the Bollinger Bands’ basis (indicating a bullish trend), red when below (bearish trend), or purple when near the basis (consolidation), based on a customizable threshold (default 10% of BB width).
Risk Management: Each signal calculates a stop-loss (10% beyond the opposite band) and take-profit (opposite band), plotted for reference.
How to Use It
Timeframe: Best on 1-minute to 5-minute charts for scalping; test higher timeframes for swing trading.
Markets: Works well in volatile markets like forex pairs (e.g., EUR/USD), crypto (e.g., BTC/USD), or liquid stocks.
Customization: Adjust Bollinger Bands length (default 10), multiplier (default 1.2), volume thresholds (default 30%), EMA length (default 3), and consolidation threshold (default 0.1%) to match your strategy.
Interpretation: Look for green/red triangles as entry signals, confirmed by candle colors. Purple candles suggest caution—wait for a breakout. Use stop-loss/take-profit levels for trade management.
Underlying Concepts
Bollinger Bands: Measures volatility and identifies overbought/oversold zones.
Heikin Ashi: Smooths price action to emphasize trend direction.
Volume Momentum: Calculates cumulative buy/sell volume percentages to confirm market strength (e.g., buyVolPercent = buyVolume / totalVolume * 100).
EMA: A fast-moving average (default length 3) ensures signals align with the immediate trend.
Chart Setup
The chart displays Bollinger Bands (orange), Heikin Ashi close (green circles), EMA (purple), and volume-scaled lines (lime/red). Signals are marked with triangles, and candle colors reflect trend state. Keep the chart clean by focusing on these outputs for clarity.
