Jensen Alpha RS🧠 Jensen Alpha RS (J-Alpha RS)
Jensen Alpha RS is a quantitative performance evaluation tool designed to compare multiple assets against a benchmark using Jensen’s Alpha — a classic risk-adjusted return metric from modern portfolio theory.
It helps identify which assets have outperformed their benchmark on a risk-adjusted basis and ranks them in real time, with optional gating and visual tools. 📊
✨ Key Features
• 🧩 Multi-Asset Comparison: Evaluate up to four assets simultaneously.
• 🔀 Adaptive Benchmarking: TOTALES mode uses CRYPTOCAP:TOTALES (total crypto market cap ex-stablecoins). Dynamic mode automatically selects the strongest benchmark among BTC, ETH, and TOTALES based on rolling momentum.
• 📐 Jensen’s Alpha Calculation: Uses rolling covariance, variance, and beta to estimate α, showing how much each asset outperformed its benchmark.
• 📈 Z-Score & Consistency Metrics: Z-Score highlights statistical deviations in alpha; Consistency % shows how often α has been positive over a chosen window.
• 🚦 Trend & Zero Gates: Optional filters that require assets to be above EMA (trend) and/or have α > 0 for confirmation.
• 🏆 Leaders Board Table: Displays α, Z, Rank, Consistency %, and Gate ✓/✗ for all assets in a clear visual layout.
• 🔔 Dynamic Alerts: Get notified whenever the top alpha leader changes on confirmed (non-repainting) data.
• 🎨 Visual Enhancements: Smooth α with an SMA or color bars by the current top-performing asset.
🧭 Typical Use Cases
• 🔄 Portfolio Rotation & Relative Strength: Identify which assets consistently outperform their benchmark to optimize capital allocation.
• 🧮 Alpha Persistence Analysis: Gauge whether a trend’s performance advantage is statistically sustainable.
• 🌐 Market Regime Insight: Observe how asset leadership rotates as benchmarks shift across market cycles.
⚙️ Inputs Overview
• 📝 Assets (1–4): Select up to four tickers for evaluation.
• 🧭 Benchmark Mode: Choose between static TOTALES or Dynamic auto-selection.
• 📏 Alpha Settings: Adjustable lookback, smoothing, and consistency windows.
• 🚦 Gates: Optional trend and alpha filters to refine results.
• 🖥️ Display: Enable/disable table and customize colors.
• 🔔 Alerts: Toggle notifications on leadership changes.
🔎 Formula Basis
Jensen’s Alpha (α) is estimated as:
α = E − β × E
where β = Cov(Ra, Rb) / Var(Rb), and Ra/Rb represent asset and benchmark returns, respectively.
A positive α indicates outperformance relative to the risk-adjusted benchmark expectation. ✅
⚠️ Disclaimer
This script is for educational and analytical purposes only.
It is NOT a signal. 🚫📉
It does not constitute financial advice, trading signals, or investment recommendations. 💬
The author is not responsible for any financial losses or trading decisions made based on this indicator. 🙏
Always perform your own analysis and use proper risk management. 🛡️
Educational

Logit RSI [AdaptiveRSI]The traditional 0–100 RSI scale makes statistical overlays, such as Bollinger Bands or even moving averages, technically invalid. This script solves this issue by placing RSI on an unbounded, continuous scale, enabling these tools to work as intended.
The Logit function takes bounded data, such as RSI values ranging from 0 to 100, and maps them onto an unbounded scale ranging from negative infinity (−∞) to positive infinity (+∞).
An RSI reading of 50 becomes 0 on the Logit scale, indicating a balanced market. Readings above 50 map to positive Logit values (price above Wilder’s EMA / RSI above 50), while readings below 50 map to negative values (price below Wilder’s EMA / RSI below 50).
For the detailed formula, which calculates RSI as a scaled distance from Wilder’s EMA, check the RSI
: alternative derivation script.
The main issue with the 0–100 RSI scale is that different lookback periods produce very different distributions of RSI values. The histograms below illustrate how often RSIs of various lengths spend time within each 5-point range.
On RSI(2), the tallest bars appear at the edges (0–5 and 95–100), meaning short-term RSI spends most of its time at the extremes. For longer lookbacks, the bars cluster around the center and rarely reach 70 or 30.
This behavior makes it difficult to generalize the two most common RSI techniques:
Fixed 70/30 thresholds: These overbought and oversold levels only make sense for short- or mid-range lookbacks (around the low teens). For very short periods, RSI spends most of its time above or below these levels, while for long-term lookbacks, RSI rarely reaches them.
Bollinger Bands (±2 standard deviations): When applied directly to RSI, the bands often extend beyond the 0–100 limits (especially for short-term lookbacks) making them mathematically invalid. While the issue is less visible on longer settings, it remains conceptually incorrect.
To address this, we apply the Logit Transform :
Logit RSI = LN(RSI / (100 − RSI))
The transformed data fits a smooth bell-shaped curve, allowing statistical tools like Bollinger Bands to function properly for the first time.
Why Logit RSI Matters:
Makes RSI statistically consistent across all lookback periods.
Greatly improves the visual clarity of short-term RSIs
Allows proper use of volatility tools (like Bollinger Bands) on RSI.
Replaces arbitrary 70/30 levels with data-driven thresholds.
Simplifies RSI interpretation for both short- and long-term analysis.
INPUTS:
RSI Length — set the RSI lookback period used in calculations.
RSI Type — choose between Regular RSI or Logit RSI .
Plot Bollinger Bands — ON/OFF toggle to overlay statistical envelopes around RSI or Logit RSI.
SMA and Standard Deviation Length — defines the lookback period for both the SMA (Bollinger Bands midline) and Standard Deviation calculations.
Standard Deviation Multiplier — controls the width of the Bollinger Bands (e.g., 2.0 for ±2σ).
While simple, the Logit transformation represents an unexplored yet powerful mathematically grounded improvement to the classic RSI.
It offers traders a structured, intuitive, and statistically consistent way to use RSI across all timeframes.
I welcome your feedback, suggestions, and code improvements—especially regarding performance and efficiency. Your insights are greatly appreciated.

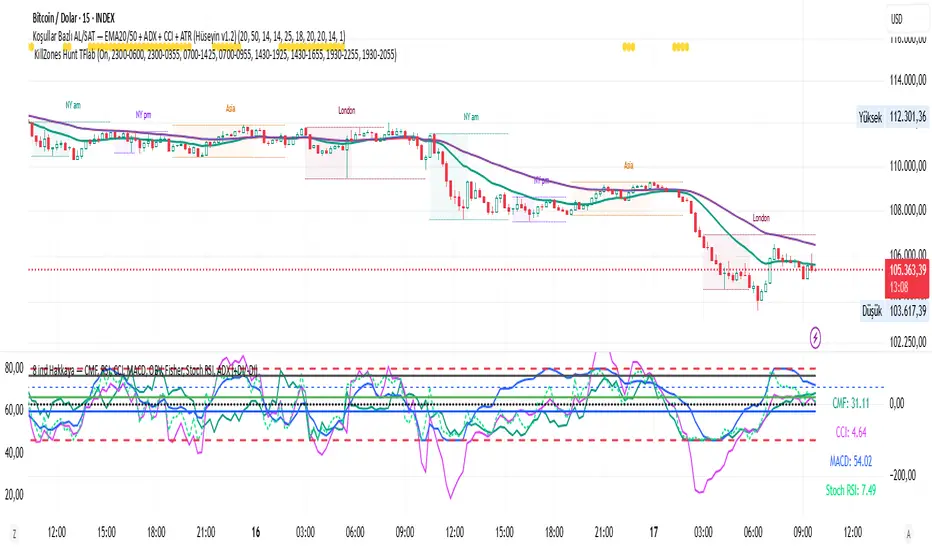
CMF, RSI, CCI, MACD, OBV, Fisher, Stoch RSI, ADX (+DI/-DI)
Stoch RSINine indicators in one, CMF, RSI, CCI, MACD, OBV, Fisher, Stoch RSI, ADX (+DI/-DI) You can use whichever of the nine indicators you want. I use CFM, CCI, MACD, Stoch RSI.

Simplified Percentile ClusteringSimplified Percentile Clustering (SPC) is a clustering system for trend regime analysis.
Instead of relying on heavy iterative algorithms such as k-means, SPC takes a deterministic approach: it uses percentiles and running averages to form cluster centers directly from the data, producing smooth, interpretable market state segmentation that updates live with every bar.
Most clustering algorithms are designed for offline datasets, they require recomputation, multiple iterations, and fixed sample sizes.
SPC borrows from both statistical normalization and distance-based clustering theory , but simplifies them. Percentiles ensure that cluster centers are resistant to outliers , while the running mean provides a stable mid-point reference.
Unlike iterative methods, SPC’s centers evolve smoothly with time, ideal for charts that must update in real time without sudden reclassification noise.
SPC provides a simple yet powerful clustering heuristic that:
Runs continuously in a charting environment,
Remains interpretable and reproducible,
And allows traders to see how close the current market state is to transitioning between regimes.
Clustering by Percentiles
Traditional clustering methods find centers through iteration. SPC defines them deterministically using three simple statistics within a moving window:
Lower percentile (p_low) → captures the lower basin of feature values.
Upper percentile (p_high) → captures the upper basin.
Mean (mid) → represents the central tendency.
From these, SPC computes stable “centers”:
// K = 2 → two regimes (e.g., bullish / bearish)
=
// K = 3 → adds a neutral zone
=
These centers move gradually with the market, forming live regime boundaries without ever needing convergence steps.
Two clusters capture directional bias; three clusters add a neutral ‘range’ state.
Multi-Feature Fusion
While SPC can cluster a single feature such as RSI, CCI, Fisher Transform, DMI, Z-Score, or the price-to-MA ratio (MAR), its real strength lies in feature fusion. Each feature adds a unique lens to the clustering system. By toggling features on or off, traders can test how each dimension contributes to the regime structure.
In “Clusters” mode, SPC measures how far the current bar is from each cluster center across all enabled features, averages these distances, and assigns the bar to the nearest combined center. This effectively creates a multi-dimensional regime map , where each feature contributes equally to defining the overall market state.
The fusion distance is computed as:
dist := (rsi_d * on_off(use_rsi) + cci_d * on_off(use_cci) + fis_d * on_off(use_fis) + dmi_d * on_off(use_dmi) + zsc_d * on_off(use_zsc) + mar_d * on_off(use_mar)) / (on_off(use_rsi) + on_off(use_cci) + on_off(use_fis) + on_off(use_dmi) + on_off(use_zsc) + on_off(use_mar))
Because each feature can be standardized (Z-Score), the distances remain comparable across different scales.
Fusion mode combines multiple standardized features into a single smooth regime signal.
Visualizing Proximity - The Transition Gradient
Most indicators show binary or discrete conditions (e.g., bullish/bearish). SPC goes further, it quantifies how close the current value is to flipping into the next cluster.
It measures the distances to the two nearest cluster centers and interpolates between them:
rel_pos = min_dist / (min_dist + second_min_dist)
real_clust = cluster_val + (second_val - cluster_val) * rel_pos
This real_clust output forms a continuous line that moves smoothly between clusters:
Near 0.0 → firmly within the current regime
Around 0.5 → balanced between clusters (transition zone)
Near 1.0 → about to flip into the next regime
Smooth interpolation reveals when the market is close to a regime change.
How to Tune the Parameters
SPC includes intuitive parameters to adapt sensitivity and stability:
K Clusters (2–3): Defines the number of regimes. K = 2 for trend/range distinction, K = 3 for trend/neutral transitions.
Lookback: Determines the number of past bars used for percentile and mean calculations. Higher = smoother, more stable clusters. Lower = faster reaction to new trends.
Lower / Upper Percentiles: Define what counts as “low” and “high” states. Adjust to widen or tighten cluster ranges.
Shorter lookbacks react quickly to shifts; longer lookbacks smooth the clusters.
Visual Interpretation
In “Clusters” mode, SPC plots:
A colored histogram for each cluster (red, orange, green depending on K)
Horizontal guide lines separating cluster levels
Smooth proximity transitions between states
Each bar’s color also changes based on its assigned cluster, allowing quick recognition of when the market transitions between regimes.
Cluster bands visualize regime structure and transitions at a glance.
Practical Applications
Identify market regimes (bullish, neutral, bearish) in real time
Detect early transition phases before a trend flip occurs
Fuse multiple indicators into a single consistent signal
Engineer interpretable features for machine-learning research
Build adaptive filters or hybrid signals based on cluster proximity
Final Notes
Simplified Percentile Clustering (SPC) provides a balance between mathematical rigor and visual intuition. It replaces complex iterative algorithms with a clear, deterministic logic that any trader can understand, and yet retains the multidimensional insight of a fusion-based clustering system.
Use SPC to study how different indicators align, how regimes evolve, and how transitions emerge in real time. It’s not about predicting; it’s about seeing the structure of the market unfold.
Disclaimer
This indicator is intended for educational and analytical use.
It does not generate buy or sell signals.
Historical regime transitions are not indicative of future performance.
Always validate insights with independent analysis before making trading decisions.

ALISH WEEK LABELS THE ALISH WEEK LABELS
Overview
This indicator programmatically delineates each trading week and encapsulates its realized price range in a live-updating, filled rectangle. A week is defined in America/Toronto time from Monday 00:00 to Friday 16:00. Weekly market open to market close, For every week, the script draws:
a vertical start line at the first bar of Monday 00:00,
a vertical end line at the first bar at/after Friday 16:00, and
a white, semi-transparent box whose top tracks the highest price and whose bottom tracks the lowest price observed between those two temporal boundaries.
The drawing is timeframe-agnostic (M1 → 1D): the box expands in real time while the week is open and freezes at the close boundary.
Time Reference and Session Boundaries
All scheduling decisions are computed with time functions called using the fixed timezone string "America/Toronto", ensuring correct behavior across DST transitions without relying on chart timezone. The start condition is met at the first bar where (dayofweek == Monday && hour == 0 && minute == 0); on higher timeframes where an exact 00:00 bar may not exist, a fallback checks for the first Monday bar using ta.change(dayofweek). The close condition is met on the first bar at or after Friday 16:00 (Toronto), which guarantees deterministic closure on intraday and higher timeframes.
State Model
The indicator maintains minimal persistent state using var globals:
week_open (bool): whether the current weekly session is active.
wk_hi / wk_lo (float): rolling extrema for the active week.
wk_box (box): the graphical rectangle spanning × .
wk_start_line and a transient wk_end_line (line): vertical delimiters at the week’s start and end.
Two dynamic arrays (boxes, vlines) store object handles to support bounded history and deterministic garbage collection.
Update Cycle (Per Bar)
On each bar the script executes the following pipeline:
Start Check: If no week is open and the start condition is satisfied, instantiate wk_box anchored at the current bar_index, prime wk_hi/wk_lo with the bar’s high/low, create the start line, and push both handles to their arrays.
Accrual (while week_open): Update wk_hi/wk_lo using math.max/min with current bar extremes. Propagate those values to the active wk_box via box.set_top/bottom and slide box.set_right to the current bar_index to keep the box flush with live price.
Close Check: If at/after Friday 16:00, finalize the week by freezing the right edge (box.set_right), drawing the end line, pushing its handle, and flipping week_open false.
Retention Pruning: Enforce a hard cap on historical elements by deleting the oldest objects when counts exceed configured limits.
Drawing Semantics
The range container is a filled white rectangle (bgcolor = color.new(color.white, 100 − opacity)), with a solid white border for clear contrast on dark or light themes. Start/end boundaries are full-height vertical white lines (y1=+1e10, y2=−1e10) to guarantee visibility across auto-scaled y-axes. This approach avoids reliance on price-dependent anchors for the lines and is robust to large volatility spikes.
Multi-Timeframe Behavior
Because session logic is driven by wall-clock time in the Toronto zone, the indicator remains consistent across chart resolutions. On coarse timeframes where an exact boundary bar might not exist, the script legally approximates by triggering on the first available bar within or immediately after the boundary (e.g., Friday 16:00 occurs between two 4-hour bars). The box therefore represents the true realized high/low of the bars present in that timeframe, which is the correct visual for that resolution.
Inputs and Defaults
Weeks to keep (show_weeks_back): integer, default 40. Controls retention of historical boxes/lines to avoid UI clutter and resource overhead.
Fill opacity (fill_opacity): integer 0–100, default 88. Controls how solid the white fill appears; border color is fixed pure white for crisp edges.
Time zone is intentionally fixed to "America/Toronto" to match the strategy definition and maintain consistent historical backtesting.
Performance and Limits
Objects are reused only within a week; upon closure, handles are stored and later purged when history limits are exceeded. The script sets generous but safe caps (max_boxes_count/max_lines_count) to accommodate 40 weeks while preserving Editor constraints. Per-bar work is O(1), and pruning loops are bounded by the configured history length, keeping runtime predictable on long histories.
Edge Cases and Guarantees
DST Transitions: Using a fixed IANA time zone ensures Friday 16:00 and Monday 00:00 boundaries shift correctly when DST changes in Toronto.
Weekend Gaps/Holidays: If the market lacks bars exactly at boundaries, the nearest subsequent bar triggers the start/close logic; range statistics still reflect observed prices.
Live vs Historical: During live sessions the box edge advances every bar; when replaying history or backtesting, the same rules apply deterministically.
Scope (Intentional Simplicity)
This tool is strictly a visual framing indicator. It does not compute labels, statistics, alerts, or extended S/R projections. Its single responsibility is to clearly present the week’s realized range in the Toronto session window so you can layer your own execution or analytics on top.

🚀 Ultimate Trading Tool + Strat Method🚀 Ultimate Trading Tool + Strat Method - Complete Breakdown
Let me give you a comprehensive overview of this powerful indicator!
🎯 What This Indicator Does:
This is a professional-grade, all-in-one trading system that combines two proven methodologies:
1️⃣ Technical Analysis System (Original)
Advanced trend detection using multiple EMAs
Momentum analysis with MACD
RSI multi-timeframe analysis
Volume surge detection
Automated trendline drawing
2️⃣ Strat Method (Pattern Recognition)
Inside bars, outside bars, directional bars
Classic patterns: 2-2, 1-2-2
Advanced patterns: 3-1-2, 2-1-2, F2→3
Timeframe continuity filters
📊 How It Generates Signals:
Technical Analysis Signals (Green/Red Triangles):
Buy Signal Triggers When:
✅ Price above EMA 21 & 50 (uptrend)
✅ MACD histogram rising (momentum)
✅ RSI between 30-70 (not overbought/oversold)
✅ Volume surge above 20-period average
✅ Price breaks above resistance trendline
Scoring System:
Trend alignment: +1 point
Momentum: +1 point
RSI favorable: +1 point
Trendline breakout: +2 points
Minimum score required based on sensitivity setting
Strat Method Signals (Blue/Orange Labels):
Pattern Recognition:
2-2 Setup: Down bar → Up bar (or reverse)
1-2-2 Setup: Inside bar → Down bar → Up bar
3-1-2 Setup: Outside bar → Inside bar → Up bar
2-1-2 Setup: Down bar → Inside bar → Up bar
F2→3 Setup: Failed directional bar becomes outside bar
Confirmation Required:
Must break previous bar's high (buy) or low (sell)
Optional timeframe continuity (daily & weekly aligned)
💰 Risk Management Features:
Dynamic Stop Loss & Take Profit:
ATR-Based: Adapts to market volatility
Stop Loss: Entry - (ATR × 1.5) by default
Take Profit: Entry + (ATR × 3.0) by default
Risk:Reward: Customizable 1:2 to 1:5 ratios
Visual Risk Zones:
Colored boxes show risk/reward area
Dark, bold lines for easy identification
Clear entry, stop, and target levels
🎨 What You See On Screen:
Main Signals:
🟢 Green Triangle "BUY" - Technical analysis long signal
🔴 Red Triangle "SELL" - Technical analysis short signal
🎯 Blue Label "STRAT" - Strat method long signal
🎯 Orange Label "STRAT" - Strat method short signal
Trendlines:
Green lines - Support trendlines (bullish)
Red lines - Resistance trendlines (bearish)
Automatically drawn from pivot points
Extended forward to predict future levels
Stop/Target Levels:
Bold crosses at stop loss levels (red color)
Bold crosses at take profit levels (green color)
Line width = 3 for maximum visibility
Trade Zones:
Light green boxes - Long trade risk/reward zone
Light red boxes - Short trade risk/reward zone
Shows potential profit vs risk visually
📊 Information Dashboard (Top Right):
Shows real-time market conditions:
Main Signal: Current technical signal status
Strat Method: Active Strat pattern
Trend: Bullish/Bearish/Neutral
Momentum: Strong/Weak based on MACD
Volume: High/Normal compared to average
TF Continuity: Daily/Weekly alignment
RSI: Current RSI value with color coding
Support/Resistance: Current trendline levels
🔔 Alert System:
Entry Alerts:
Technical Signals:
🚀 BUY SIGNAL TRIGGERED!
Type: Technical Analysis
Entry: 45.23
Stop: 43.87
Target: 48.95
```
**Strat Signals:**
```
🎯 STRAT BUY TRIGGER!
Pattern: 3-1-2
Entry: 45.23
Trigger Level: 44.56
Exit Alerts:
Target hit notifications
Stop loss hit warnings
Helps maintain discipline
⚙️ Customization Options:
Signal Settings:
Sensitivity: High/Medium/Low (controls how many signals)
Volume Filter: Require volume surge or not
Momentum Filter: Require momentum confirmation
Strat Settings:
TF Continuity: Require daily/weekly alignment
Pattern Selection: Enable/disable specific patterns
Confirmation Mode: Show only confirmed triggers
Risk Settings:
ATR Multiplier: Adjust stop/target distance
Risk:Reward: Set preferred ratio
Visual Elements: Show/hide any component
Visual Settings:
Colors: Customize all signal colors
Display Options: Toggle signals, levels, zones
Trendline Length: Adjust pivot detection period
🎯 Best Use Cases:
Day Trading:
Use low sensitivity setting
Enable all Strat patterns
Watch for high volume signals
Quick in/out trades
Swing Trading:
Use medium sensitivity
Require timeframe continuity
Focus on trendline breakouts
Hold for target levels
Position Trading:
Use high sensitivity (fewer signals)
Require strong momentum
Focus on weekly/daily alignment
Larger ATR multipliers
💡 Trading Strategy Tips:
High-Probability Setups:
Double Confirmation: Technical + Strat signal together
Trend Alignment: All timeframes agree
Volume Surge: Institutional participation
Trendline Break: Clear level breakout
Risk Management:
Always use stops - System provides them
Position sizing - Risk 1-2% per trade
Don't chase - Wait for signal confirmation
Take profits - System provides targets
What Makes Signals Strong:
✅ Both technical AND Strat signals fire together
✅ Timeframe continuity (daily & weekly aligned)
✅ Volume surge confirms institutional interest
✅ Multiple indicators align (trend + momentum + RSI)
✅ Clean trendline breakout with no resistance above (or support below)
⚠️ Common Mistakes to Avoid:
Don't ignore stops - System calculates them for a reason
Don't overtrade - Wait for quality setups
Don't disable volume filter - Unless you know what you're doing
Don't use max sensitivity - You'll get too many signals
Don't ignore timeframe continuity - It filters bad trades
🚀 Why This Indicator is Powerful:
Combines Multiple Edge Sources:
Technical analysis (trend, momentum, volume)
Pattern recognition (Strat method)
Risk management (dynamic stops/targets)
Market structure (trendlines, support/resistance)
Professional Features:
No repainting - signals are final when bar closes
Clear risk/reward before entry
Multiple confirmation layers
Adaptable to any market or timeframe
Beginner Friendly:
Clear visual signals
Automatic calculations
Built-in risk management
Comprehensive dashboard
This indicator essentially gives you everything a professional trader uses - trend analysis, momentum, patterns, volume, risk management - all in one clean package!
Any specific aspect you'd like me to explain in more detail? 🎯RetryClaude can make mistakes. Please double-check responses. Sonnet 4.5

Dynamic Volume Based Key Price LevelsDescription
This indicator introduces a volume-based approach to detecting support and resistance zones.
Instead of relying on price swings or pivots, it analyzes where the most trading activity occurred within a selected lookback period, then marks those levels directly on the chart.
The result is a clear visual map of price areas with strong historical participation, which often act as reaction zones in future moves.
How It Works
The script divides the analyzed range into price bins, sums traded volume for each bin, and highlights the strongest levels based on their share of total volume.
It also includes an optional multi-timeframe mode, allowing traders to analyze higher timeframe volume structures on a lower timeframe chart.
Key Features
🔹 Volume-Based Key Levels Detection: Finds statistically meaningful price zones derived from raw volume data.
🔹 Multi-Timeframe Mode: Optionally use higher timeframe volume to identify key market structure levels.
🔹 Visual Customization: Configure colors, line styles, transparency, and label formatting.
🔹 Automatic Ranking: Highlights the strongest to weakest levels using a color gradient.
🔹 Dynamic Updates: Levels adapt automatically as new bars form.
Inputs Overview
Lookback Bars: Number of historical bars used for analysis.
Price Bins: Defines the precision of volume distribution.
Number of Lines: How many key levels to display.
Min Volume %: Filters out less relevant low-volume bins.
Extend Lines: Choose how lines are projected into the future.
Use Higher Timeframe: Pull data from a higher timeframe for broader perspective.
How to Use
Apply the indicator to your chart and adjust the lookback period.
Optionally enable higher timeframe mode for more stable long-term zones.
Observe the horizontal lines — these represent volume-weighted support and resistance areas.
Combine with your existing tools for trend or momentum confirmation.
This tool helps visualize where market participation was strongest, giving traders a clearer view of potential reaction zones for both intraday and swing analysis.
It’s intended as a visual analytical aid, not a signal generator.
⚠️Disclaimer:
This script is provided for educational and informational purposes only. It is not financial advice and should not be considered a recommendation to buy, sell, or hold any financial instrument. Trading involves significant risk of loss and is not suitable for every investor. Users should perform their own due diligence and consult with a licensed financial advisor before making any trading decisions. The author does not guarantee any profits or results from using this script, and assumes no liability for any losses incurred. Use this script at your own risk.
Institutional Orderflow Pro — VWAP, Delta, and Liquidity
Institutional Orderflow Pro is a next-generation order flow analysis indicator designed to help traders identify institutional participation, directional bias, and exhaustion zones in real time.
Unlike traditional volume-based indicators, it merges VWAP dynamics, cumulative delta, relative volume, and liquidity proximity into a single unified dashboard that updates tick-by-tick — without repainting.
The indicator is open-source, transparent, and educational. It aims to provide traders with a clearer read on who controls the market — buyers or sellers — and where liquidity lies.
The indicator combines multiple institutional-grade analytics into one framework:
RVOL (Relative Volume) = Compares current volume against the average of recent bars to identify strong institutional participation.
zΔ (Delta Z-Score) = Normalizes the buying/selling delta to reveal unusually aggressive market behavior.
CVDΔ (Cumulative Volume Delta Change) = Shows which side (buyers/sellers) is dominating this bar’s order flow.
VWAP Direction & Slope = Determines whether price is trading above/below VWAP and whether VWAP is trending or flat.
PD Distance (Prev Day Confluence) = Measures the current price’s distance from previous day’s high, low, close, and VWAP in ATR units — highlighting liquidity zones.
ABS/EXH Detection = Identifies institutional absorption and exhaustion patterns where momentum may reverse.
Bias Computation = Combines VWAP direction + slope to give a simplified regime signal: UP, DOWN, or FLAT.
All metrics are displayed through a color-coded, non-repainting HUD:
🟢 = bullish / favorable conditions
🔴 = bearish / weak conditions
⚫ = neutral / flat
🟡 = absorption (potential trap zone)
🟠 = exhaustion (momentum fading)
| Metric | Signal | Meaning |
| ---------------------- | ------- | ---------------------------------------------- |
| **RVOL ≥ 1.3** | 🟢 | High institutional activity — valid setup zone |
| **zΔ ≥ 1.2 / ≤ -1.2** | 🟢 / 🔴 | Unusual buy/sell aggression |
| **CVDΔ > 0** | 🟢 | Buyers dominate this bar |
| **VWAP dir ↑ / ↓** | 🟢 / 🔴 | Institutional bias long/short |
| **Slope ok = YES** | 🟢 | Trending market |
| **PD dist ≤ 0.35 ATR** | 🟢 | Near key liquidity zones |
| **Bias = UP/DOWN** | 🟢 / 🔴 | Trend-aligned environment |
| **ABS/EXH active** | 🟡 / 🟠 | Caution — possible reversal zone |
How to Use
Confirm Volume Context → RVOL > 1.2
Align with Bias → Take longs only when Bias = UP, shorts only when Bias = DOWN.
Check Slope and VWAP Dir → Ensure trending context (Slope = YES).
Confirm CVD and zΔ → Flow should agree with price direction.
Avoid ABS/EXH Triggers → These signal exhaustion or absorption by large players.
Enter Near PD Zones → Ideal trade zones are within 0.35 ATR of prior-day levels.
This multi-factor confirmation reduces noise and focuses only on high-probability institutional setups.
Originality
This script was written from scratch in Pine v6.
It does not reuse existing public indicators except for standard built-ins (ta.vwap, ta.atr, etc.).
The unique combination of delta z-scoring, VWAP slope filtering, and real-time confluence zones distinguishes it from typical orderflow tools or cumulative delta overlays.
The core innovation is its merged real-time HUD that integrates institutional metrics and natural-language feedback directly on the chart, allowing traders to read market context intuitively rather than decode multiple subplots.
Notes & Disclaimers
This indicator does not repaint.
It’s intended for educational and analytical purposes only — not as financial advice or a guaranteed signal system.
Works best on liquid instruments (Futures, Indices, FX majors).
Avoid non-standard chart types (Heikin Ashi, Renko, etc.) for accurate readings.
Open-source, modifiable, and compatible with Pine v6.
Recommended Use
Apply it with clean charts and standard candles for the best clarity.
Use alongside a basic structure or volume profile to contextualize institutional bias zones.
Author: Dhawal Ranka
Category - Orderflow / VWAP / Institutional Analysis
Version: Pine Script™ v6
License: Open Source (Educational Use)

Metallic Retracement LevelsThere's something that's always bothered me about how traders use Fibonacci retracements. Everyone treats the golden ratio like it's the only game in town, but mathematically speaking, it's completely arbitrary. The golden ratio is just the first member of an infinite family of metallic means, and there's no particular reason why 1.618 should be special for markets when we have the silver ratio at 2.414, the bronze ratio at 3.303, and literally every other metallic mean extending to infinity. We just picked one and decided it was magical.
The metallic means are a sequence of mathematical constants that generalize the golden ratio. They're defined by the equation x² = kx + 1, where k is any positive integer. When k equals 1, you get the golden ratio. When k equals 2, you get the silver ratio. When k equals 3, you get bronze, and so on forever. Each metallic mean generates its own set of ratios through successive powers, just like how the golden ratio gives you 0.618, 0.382, 0.236 and so forth. The silver ratio produces a completely different set of retracement levels, as does bronze, as does any arbitrary metallic number you want to choose.
This indicator calculates these metallic means using the standard alpha and beta formulas. For any metallic number k, alpha equals (k + sqrt(k² + 4)) / 2, and we generate retracement ratios by raising alpha to various negative powers. The script algorithmically generates these levels instead of hardcoding them, which is how it should have been done from the start. It's genuinely silly that most fib tools just hardcode the ratios when the math to generate them is straightforward. Even worse, traditional fib retracements use 0.5 as a level, which isn't even a fibonacci ratio. It's just thrown in there because it seems like it should be important.
The indicator works by first detecting swing points using the Sylvain Zig-Zag . The zig-zag identifies significant price swings by combining percentage change with ATR adjustments, filtering out noise and connecting major pivot points. This is what drives the retracement levels. Once a new swing is confirmed, the script calculates the range between the last two pivot points and generates metallic retracement levels from the most recent swing low or high.
You can adjust which metallic number to use (golden, silver, bronze, or any positive integer), control how many power ratios to display above and below the 1.0 level, and set how many complete retracement cycles you want drawn. The levels extend from the swing point and show you where price might react based on whichever metallic mean you've selected. The zig-zag settings let you tune the sensitivity of swing detection through ATR period, ATR multiplier, percentage reversal, and additional absolute or tick-based reversal values.
What this really demonstrates is that retracement analysis is more flexible than most traders realize. There's no mathematical law that says markets must respect the golden ratio over any other metallic mean. They're all valid mathematical constructs with the same kind of recursive properties. By making this tool, I wanted to highlight that using fibonacci retracements involves an arbitrary choice, and maybe that choice should be more deliberate or at least tested against alternatives. You can experiment with different metallic numbers and see which ones seem to work better for your particular market or timeframe, or just use this to understand that the standard fib levels everyone uses aren't as fundamental as they appear.

RPT Position Sizer🎯 Purpose
This indicator is a position sizing and stop-loss calculator designed to help traders instantly determine:
How many shares/contracts to buy,
How much risk (₹) they are taking per trade,
How much capital will be deployed, and
The precise stop-loss price level based on user-defined parameters.
It displays all key values in a compact on-chart table (bottom-left corner) for quick trade planning.
💡 Use Case
Perfect for discretionary swing traders, systematic position traders, and risk managers who want instant visual feedback of trade sizing metrics directly on the chart — eliminating manual calculations and improving discipline.
⚙️ Key Features
Dynamic Inputs
Trading Capital (₹) — total available capital for trading.
RPT % — risk-per-trade as a percentage of total capital.
SL % — stop-loss distance in percent below CMP (Current Market Price).
CMP Source — can be linked to close, hl2, etc.
Rounding Style — round position size to Nearest, Floor, or Ceil.
Decimals Show — control number formatting precision in the table.
Core Calculations
SL Points: CMP × SL%
SL Price: CMP − SL Points
Risk Amount (₹): Capital × RPT%
Position Size: Risk ÷ SL Points
Capital Used: Position Size × CMP
Clean On-Chart Table Display
Displays:
Trading Capital
RPT %
Risk Amount (₹)
Position Size (shares/contracts)
Capital Required (₹)
Stop-Loss % & SL Price
The table uses a minimalistic white-on-black design with clear labeling and rupee formatting for quick reference.
Data Window Integration
Plots hidden values (Position Size, Risk Amount, SL Points, Capital Used) for use in TradingView’s Data Window—ideal for strategy testing and exporting values.

VWAP + Multi-Condition RSI Signals + FibonacciPlatform / System
Platform: TradingView
Language: Pine Script® v6
Purpose: This script is an overlay indicator for technical analysis on charts. It combines multiple tools: VWAP, RSI signals, and Fibonacci levels.
1️⃣ VWAP (Volume Weighted Average Price)
What it does:
Plots the VWAP line on the chart, which is a weighted average price based on volume.
Can be anchored to different periods: Session, Week, Month, Quarter, Year, Decade, Century, or corporate events like Earnings, Dividends, Splits.
Optionally plots bands above and below VWAP based on standard deviation or a percentage.
Supports up to 3 bands with customizable multipliers.
Will not display if the timeframe is daily or higher and the hideonDWM option is enabled.
Visual on chart: A main VWAP line with optional shaded bands.
2️⃣ RSI (Relative Strength Index) Signals
What it does:
Calculates RSI with a configurable period.
Identifies overbought and oversold zones using user-defined levels.
Generates buy/sell signals based on:
RSI crossing above oversold → Buy
RSI crossing below overbought → Sell
Detects strong signals using divergences:
Bullish divergence: Price makes lower low, RSI makes higher low → Strong Buy
Bearish divergence: Price makes higher high, RSI makes lower high → Strong Sell
Optional momentum signals when RSI crosses 50 after recent overbought/oversold conditions.
Visual on chart:
Triangles for buy/sell
Different color triangles/circles for strong and momentum signals
Background shading in RSI overbought/oversold zones
Alerts: The script can trigger alerts when any of these signals occur.
3️⃣ Fibonacci Levels
What it does:
Calculates Fibonacci retracement and extension levels based on the highest high and lowest low over a configurable lookback period.
Plots standard Fibonacci levels: 0.146, 0.236, 0.382, 0.5, 0.618, 0.786, 1.0
Plots extension levels: 1.272, 1.618, 2.0, 2.618
Helps identify potential support/resistance zones.
Visual on chart: Horizontal lines at each Fibonacci level, shaded with different transparencies.
Summary
This script is essentially a multi-tool trading indicator that combines:
VWAP with dynamic bands for trend analysis and price positioning
RSI signals with divergences for entry/exit points
Fibonacci retracement and extension levels for support/resistance
It is interactive and visual, providing both chart overlays and alert functionality for active trading strategies.
This code is provided for training and educational purposes only. It is not financial advice and should not be used for live trading without proper testing and professional guidance.

Intrinsic Value AnalyzerThe Intrinsic Value Analyzer is an all-in-one valuation tool that automatically calculates the fair value of a stock using industry-standard valuation techniques. It estimates intrinsic value through Discounted Cash Flow (DCF), Enterprise Value to Revenue (EV/REV), Enterprise Value to EBITDA (EV/EBITDA), and Price to Earnings (P/EPS). The model features adjustable parameters and a built-in alert system that notifies investors in real time when valuation multiples reach predefined thresholds. It also includes a comprehensive, color-coded table that compares the company’s historical average growth rates, valuation multiples, and financial ratios with the most recent values, helping investors quickly assess how current values align with historical averages.
The model calculates the historical Compounded Annual Growth Rates (CAGR) and average valuation multiples over the selected Lookback Period. It then projects Revenue, Earnings Before Interest, Taxes, Depreciation, and Amortization (EBITDA), Earnings per Share (EPS), and Free Cash Flow (FCF) for the selected Forecast Period and discounts their future values back to the present using the Weighted Average Cost of Capital (WACC) or the Cost of Equity. By default, the model automatically applies the historical averages displayed in the table as the growth forecasts and target multiples. These assumptions can be modified in the menu by entering custom REV-G, EBITDA-G, EPS-G, and FCF-G growth forecasts, as well as EV/REV, EV/EBITDA, and P/EPS target multiples. When new input values are entered, the model recalculates the fair value in real time, allowing users to see how changes in these assumptions affect the company’s fair value.
DCF = (Sum of (FCF × (1 + FCF-G) ^ t ÷ (1 + WACC) ^ t) for each year t until Forecast Period + ((FCF × (1 + FCF-G) ^ Forecast Period × (1 + LT Growth)) ÷ ((WACC - LT Growth) × (1 + WACC) ^ Forecast Period)) + Cash - Debt - Preferred Equity - Minority Interest) ÷ Shares Outstanding
EV/REV = ((Revenue × (1 + REV-G) ^ Forecast Period × EV/REV Target) ÷ (1 + WACC) ^ Forecast Period + Cash - Debt - Preferred Equity - Minority Interest) ÷ Shares Outstanding
EV/EBITDA = ((EBITDA × (1 + EBITDA-G) ^ Forecast Period × EV/EBITDA Target) ÷ (1 + WACC) ^ Forecast Period + Cash - Debt - Preferred Equity - Minority Interest) ÷ Shares Outstanding
P/EPS = (EPS × (1 + EPS-G) ^ Forecast Period × P/EPS Target) ÷ (1 + Cost of Equity) ^ Forecast Period
The discounted one-year average analyst price target (1Y PT) is also displayed alongside the valuation labels to provide an overview of consensus estimates. For the DCF model, the terminal long-term FCF growth rate (LT Growth) is based on the selected country to reflect expected long-term nominal GDP growth and can be modified in the menu. For metrics involving FCF, users can choose between reported FCF, calculated as Cash From Operations (CFO) - Capital Expenditures (CAPEX), or standardized FCF, calculated as Earnings Before Interest and Taxes (EBIT) × (1 - Average Tax Rate) + Depreciation and Amortization - Change in Net Working Capital - CAPEX. Historical average values displayed in the left column of the table are based on Fiscal Year (FY) data, while the latest values in the right column use the most recent Trailing Twelve Month (TTM) or Fiscal Quarter (FQ) data. The indicator displays color-coded price labels for each fair value estimate, showing the percentage upside or downside from the current price. Green indicates undervaluation, while red indicates overvaluation. The table follows a separate color logic:
REV-G, EBITDA-G, EPS-G, FCF-G = Green indicates positive annual growth when the CAGR is positive. Red indicates negative annual growth when the CAGR is negative.
EV/REV = Green indicates undervaluation when EV/REV ÷ REV-G is below 1. Red indicates overvaluation when EV/REV ÷ REV-G is above 2. Gray indicates fair value.
EV/EBITDA = Green indicates undervaluation when EV/EBITDA ÷ EBITDA-G is below 1. Red indicates overvaluation when EV/EBITDA ÷ EBITDA-G is above 2. Gray indicates fair value.
P/EPS = Green indicates undervaluation when P/EPS ÷ EPS-G is below 1. Red indicates overvaluation when P/EPS ÷ EPS-G is above 2. Gray indicates fair value.
EBITDA% = Green indicates profitable operations when the EBITDA margin is positive. Red indicates unprofitable operations when the EBITDA margin is negative.
FCF% = Green indicates strong cash conversion when FCF/EBITDA > 50%. Red indicates unsustainable FCF when FCF/EBITDA is negative. Gray indicates normal cash conversion.
ROIC = Green indicates value creation when ROIC > WACC. Red indicates value destruction when ROIC is negative. Gray indicates positive but insufficient returns.
ND/EBITDA = Green indicates low leverage when ND/EBITDA is below 1. Red indicates high leverage when ND/EBITDA is above 3. Gray indicates moderate leverage.
YIELD = Green indicates positive shareholder return when Shareholder Yield > 1%. Red indicates negative shareholder return when Shareholder Yield < -1%.
The Return on Invested Capital (ROIC) is calculated as EBIT × (1 - Average Tax Rate) ÷ (Average Debt + Average Equity - Average Cash). Shareholder Yield (YIELD) is calculated as the CAGR of Dividend Yield - Change in Shares Outstanding. The Weighted Average Cost of Capital (WACC) is displayed at the top left of the table and is derived from the current Market Cap (MC), Debt, Cost of Equity, and Cost of Debt. The Cost of Equity is calculated using the Equity Beta, Index Return, and Risk-Free Rate, which are based on the selected country. The Equity Beta (β) is calculated as the 5-year Blume-adjusted beta between the weekly logarithmic returns of the underlying stock and the selected country’s stock market index. For accurate calculations, it is recommended to use the stock ticker listed on the primary exchange corresponding to the company’s main index.
Cost of Debt = (Interest Expense on Debt ÷ Average Debt) × (1 - Average Tax Rate)
Cost of Equity = Risk-Free Rate + Equity Beta (β) × (Index Return - Risk-Free Rate)
WACC = (MC ÷ (MC + Debt)) × Cost of Equity + (Debt ÷ (MC + Debt)) × Cost of Debt
This indicator works best for operationally stable and profitable companies that are primarily valued based on fundamentals rather than speculative growth, such as those in the industrial, consumer, technology, and healthcare sectors. It is less suitable for early-stage, unprofitable, or highly cyclical companies, including energy, real estate, and financial institutions, as these often have irregular cash flows or distorted balance sheets. It is also worth noting that TradingView’s financial data provider, FactSet, standardizes financial data from official company filings to align with a consistent accounting framework. While this improves comparability across companies, industries, and countries, it may also result in differences from officially reported figures.
In summary, the Intrinsic Value Analyzer is a comprehensive valuation tool designed to help long-term investors estimate a company’s fair value while comparing historical averages with the latest values. Fair value estimates are driven by growth forecasts, target multiples, and discount rates, and should always be interpreted within the context of the underlying assumptions. By default, the model applies historical averages and current discount rates, which may not accurately reflect future conditions. Investors are therefore encouraged to adjust inputs in the menu to better understand how changes in these key assumptions influence the company’s fair value.

Seasonality Heatmap [QuantAlgo]🟢 Overview
The Seasonality Heatmap analyzes years of historical data to reveal which months and weekdays have consistently produced gains or losses, displaying results through color-coded tables with statistical metrics like consistency scores (1-10 rating) and positive occurrence rates. By calculating average returns for each calendar month and day-of-week combination, it identifies recognizable seasonal patterns (such as which months or weekdays tend to rally versus decline) and synthesizes this into actionable buy low/sell high timing possibilities for strategic entries and exits. This helps traders and investors spot high-probability seasonal windows where assets have historically shown strength or weakness, enabling them to align positions with recurring bull and bear market patterns.
🟢 How It Works
1. Monthly Heatmap
How % Return is Calculated:
The indicator fetches monthly closing prices (or Open/High/Low based on user selection) and calculates the percentage change from the previous month:
(Current Month Price - Previous Month Price) / Previous Month Price × 100
Each cell in the heatmap represents one month's return in a specific year, creating a multi-year historical view
Colors indicate performance intensity: greener/brighter shades for higher positive returns, redder/brighter shades for larger negative returns
What Averages Mean:
The "Avg %" row displays the arithmetic mean of all historical returns for each calendar month (e.g., averaging all Januaries together, all Februaries together, etc.)
This metric identifies historically recurring patterns by showing which months have tended to rise or fall on average
Positive averages indicate months that have typically trended upward; negative averages indicate historically weaker months
Example: If April shows +18.56% average, it means April has averaged a 18.56% gain across all years analyzed
What Months Up % Mean:
Shows the percentage of historical occurrences where that month had a positive return (closed higher than the previous month)
Calculated as:
(Number of Months with Positive Returns / Total Months) × 100
Values above 50% indicate the month has been positive more often than negative; below 50% indicates more frequent negative months
Example: If October shows "64%", then 64% of all historical Octobers had positive returns
What Consistency Score Means:
A 1-10 rating that measures how predictable and stable a month's returns have been
Calculated using the coefficient of variation (standard deviation / mean) - lower variation = higher consistency
High scores (8-10, green): The month has shown relatively stable behavior with similar outcomes year-to-year
Medium scores (5-7, gray): Moderate consistency with some variability
Low scores (1-4, red): High variability with unpredictable behavior across different years
Example: A consistency score of 8/10 indicates the month has exhibited recognizable patterns with relatively low deviation
What Best Means:
Shows the highest percentage return achieved for that specific month, along with the year it occurred
Reveals the maximum observed upside and identifies outlier years with exceptional performance
Useful for understanding the range of possible outcomes beyond the average
Example: "Best: 2016: +131.90%" means the strongest January in the dataset was in 2016 with an 131.90% gain
What Worst Means:
Shows the most negative percentage return for that specific month, along with the year it occurred
Reveals maximum observed downside and helps understand the range of historical outcomes
Important for risk assessment even in months with positive averages
Example: "Worst: 2022: -26.86%" means the weakest January in the dataset was in 2022 with a 26.86% loss
2. Day-of-Week Heatmap
How % Return is Calculated:
Calculates the percentage change from the previous day's close to the current day's price (based on user's price source selection)
Returns are aggregated by day of the week within each calendar month (e.g., all Mondays in January, all Tuesdays in January, etc.)
Each cell shows the average performance for that specific day-month combination across all historical data
Formula:
(Current Day Price - Previous Day Close) / Previous Day Close × 100
What Averages Mean:
The "Avg %" row at the bottom aggregates all months together to show the overall average return for each weekday
Identifies broad weekly patterns across the entire dataset
Calculated by summing all daily returns for that weekday across all months and dividing by total observations
Example: If Monday shows +0.04%, Mondays have averaged a 0.04% change across all months in the dataset
What Days Up % Mean:
Shows the percentage of historical occurrences where that weekday had a positive return
Calculated as:
(Number of Positive Days / Total Days Observed) × 100
Values above 50% indicate the day has been positive more often than negative; below 50% indicates more frequent negative days
Example: If Fridays show "54%", then 54% of all Fridays in the dataset had positive returns
What Consistency Score Means:
A 1-10 rating measuring how stable that weekday's performance has been across different months
Based on the coefficient of variation of daily returns for that weekday across all 12 months
High scores (8-10, green): The weekday has shown relatively consistent behavior month-to-month
Medium scores (5-7, gray): Moderate consistency with some month-to-month variation
Low scores (1-4, red): High variability across months, with behavior differing significantly by calendar month
Example: A consistency score of 7/10 for Wednesdays means they have performed with moderate consistency throughout the year
What Best Means:
Shows which calendar month had the strongest average performance for that specific weekday
Identifies favorable day-month combinations based on historical data
Format shows the month abbreviation and the average return achieved
Example: "Best: Oct: +0.20%" means Mondays averaged +0.20% during October months in the dataset
What Worst Means:
Shows which calendar month had the weakest average performance for that specific weekday
Identifies historically challenging day-month combinations
Useful for understanding which month-weekday pairings have shown weaker performance
Example: "Worst: Sep: -0.35%" means Tuesdays averaged -0.35% during September months in the dataset
3. Optimal Timing Table/Summary Table
→ Best Month to BUY: Identifies the month with the lowest average return (most negative or least positive historically), representing periods where prices have historically been relatively lower
Based on the observation that buying during historically weaker months may position for subsequent recovery
Shows the month name, its average return, and color-coded performance
Example: If May shows -0.86% as "Best Month to BUY", it means May has historically averaged -0.86% in the analyzed period
→ Best Month to SELL: Identifies the month with the highest average return (most positive historically), representing periods where prices have historically been relatively higher
Based on historical strength patterns in that month
Example: If July shows +1.42% as "Best Month to SELL", it means July has historically averaged +1.42% gains
→ 2nd Best Month to BUY: The second-lowest performing month based on average returns
Provides an alternative timing option based on historical patterns
Offers flexibility for staged entries or when the primary month doesn't align with strategy
Example: Identifies the next-most favorable historical buying period
→ 2nd Best Month to SELL: The second-highest performing month based on average returns
Provides an alternative exit timing based on historical data
Useful for staged profit-taking or multiple exit opportunities
Identifies the secondary historical strength period
Note: The same logic applies to "Best Day to BUY/SELL" and "2nd Best Day to BUY/SELL" rows, which identify weekdays based on average daily performance across all months. Days with lowest averages are marked as buying opportunities (historically weaker days), while days with highest averages are marked for selling (historically stronger days).
🟢 Examples
Example 1: NVIDIA NASDAQ:NVDA - Strong May Pattern with High Consistency
Analyzing NVIDIA from 2015 onwards, the Monthly Heatmap reveals May averaging +15.84% with 82% of months being positive and a consistency score of 8/10 (green). December shows -1.69% average with only 40% of months positive and a low 1/10 consistency score (red). The Optimal Timing table identifies December as "Best Month to BUY" and May as "Best Month to SELL." A trader recognizes this high-probability May strength pattern and considers entering positions in late December when prices have historically been weaker, then taking profits in May when the seasonal tailwind typically peaks. The high consistency score in May (8/10) provides additional confidence that this pattern has been relatively stable year-over-year.
Example 2: Crypto Market Cap CRYPTOCAP:TOTALES - October Rally Pattern
An investor examining total crypto market capitalization notices September averaging -2.42% with 45% of months positive and 5/10 consistency, while October shows a dramatic shift with +16.69% average, 90% of months positive, and an exceptional 9/10 consistency score (blue). The Day-of-Week heatmap reveals Mondays averaging +0.40% with 54% positive days and 9/10 consistency (blue), while Thursdays show only +0.08% with 1/10 consistency (yellow). The investor uses this multi-layered analysis to develop a strategy: enter crypto positions on Thursdays during late September (combining the historically weak month with the less consistent weekday), then hold through October's historically strong period, considering exits on Mondays when intraweek strength has been most consistent.
Example 3: Solana BINANCE:SOLUSDT - Extreme January Seasonality
A cryptocurrency trader analyzing Solana observes an extraordinary January pattern: +59.57% average return with 60% of months positive and 8/10 consistency (teal), while May shows -9.75% average with only 33% of months positive and 6/10 consistency. August also displays strength at +59.50% average with 7/10 consistency. The Optimal Timing table confirms May as "Best Month to BUY" and January as "Best Month to SELL." The Day-of-Week data shows Sundays averaging +0.77% with 8/10 consistency (teal). The trader develops a seasonal rotation strategy: accumulate SOL positions during May weakness, hold through the historically strong January period (which has shown this extreme pattern with reasonable consistency), and specifically target Sunday exits when the weekday data shows the most recognizable strength pattern.

RSI VWAP v1 [JopAlgo]RSI VWAP v1.1 made stronger by volume-aware!
We know there's nothing new and the original RSI already does an excellent job. We're just working on small, practical improvements – here's our take: The same basic idea, clearer display, and a single, specially developed rolling line: a VWAP of the RSI that incorporates volume (participation) into the calculation.
Do you prefer the pure classic?
You can still use Wilder or Cutler engines –
but the star here is the VW-RSI + rolling line.
This RSI also offers the possibility of illustrating a possible
POC (Point of Control - or the HAL or VAL) level.
However, the indicator does NOT plot any of these levels itself.
We have included an illustration in the chart for this!
We hope this version makes your decision-making easier.
What you’ll see
The RSI line with a 50 midline and optional bands: either static 70/30 or adaptive μ±k·σ of the Rolling Line.
One smoothing concept only: the Rolling Line (light blue) = VWAP of RSI.
Shadow shading between RSI and the Rolling Line (green when RSI > line, red when RSI < line).
A lighter tint only on the parts of that shadow that sit above the upper band or below the lower band (quick overbought/oversold context).
Simple divergence lines drawn from RSI pivots (green for regular bullish, red for regular bearish). No labels, no buy/sell text—kept deliberately clean.
What’s new, and why it helps
VW-RSI engine (default):
RSI can be computed from volume-weighted up/down moves, so momentum reflects how much traded when price moved—not just the direction.
Rolling Line (VWAP of RSI) with pure VWAP adaptation:
Low volume: blends toward a faster VWAP so early, thin starts aren’t missed.
Volume spikes: blends toward a slower VWAP so a single heavy bar doesn’t whip the curve.
You can reveal the Base Rolling (pre-adaptation) line to see exactly how much adaptation is happening.
Adaptive bands (optional):
Instead of fixed 70/30, use mean ± k·stdev of the Rolling Line over a lookback. Levels breathe with the market—useful in strong trends where static bounds stay pinned.
Minimal, readable panel:
One smoothing, one story. The shadow tells you who’s in control; the lighter highlight shows stretch beyond your lines.
How to read it (fast)
Bias: RSI above 50 (and a rising Rolling Line) → bullish bias; below 50 → bearish bias.
Trigger: RSI crossing the Rolling Line with the bias (e.g., above 50 and crossing up).
Stretch: Near/above the upper band, avoid chasing; near/below the lower band, avoid panic—prefer a cross back through the line.
Divergence lines: Use as context, not as standalone signals. They often help you wait for the next cross or avoid late entries into exhaustion.
Settings that actually matter
RSI Engine: VW-RSI (default), Wilder, or Cutler.
Rolling Line Length: the VWAP length on RSI (higher = calmer, lower = earlier).
Adaptive behavior (pure VWAP):
Speed-up on Low Volume → blends toward fast VWAP (factor of your length).
Dampen Spikes (volume z-score) → blends toward slow VWAP.
Fast/Slow Factors → how far those fast/slow variants sit from the base length.
Bands: choose Static 70/30 or Adaptive μ±k·σ (set the lookback and k).
Visuals: show/hide Base Rolling (ref), main shadow, and highlight beyond bands.
Signal gating: optional “ignore first bars” per day/session if you dislike open noise.
Starter presets
Scalp (1–5m): RSI 9–12, Rolling 12–18, FastFactor ~0.5, SlowFactor ~2.0, Adaptive on.
Intraday (15m–1H): RSI 10–14, Rolling 18–26, Bands k = 1.0–1.4.
Swing (4H–1D): RSI 14–20, Rolling 26–40, Bands k = 1.2–1.8, Adaptive on.
Where it shines (and limits)
Best: liquid markets where volume structure matters (majors, indices, large caps).
Works elsewhere: even with imperfect volume, the shadow + bands remain useful.
Limits: very thin/illiquid assets reduce the benefit of volume-weighting—lengthen settings if needed.
Attribution & License
Based on the concept and baseline implementation of the “Relative Strength Index” by TradingView (Pine v6 built-in).
Released as Open-source (MPL-2.0). Please keep the license header and attribution intact.
Disclaimer
For educational purposes only; not financial advice. Markets carry risk. Test first, use clear levels, and manage risk. This project is independent and not affiliated with or endorsed by TradingView.

Lorentzian Harmonic Flow - Temporal Market Dynamic Lorentzian Harmonic Flow - Temporal Market Dynamic (⚡LHF)
By: DskyzInvestments
What this is
LHF Pro is a research‑grade analytical instrument that models market time as a compressible medium , extracts directional flow in curved time using heavy‑tailed kernels, and consults a history‑based memory bank for context before synthesizing a final, bounded probabilistic score . It is not a mashup; each subsystem is mathematically coupled to a single clock (time dilation via gamma) and a single lens (Lorentzian heavy‑tailed weighting). This script is dense in logic (and therefore heavy) because it prioritizes rigor, interpretability, and visual clarity.
Intended use
Education and research. This tool expresses state recognition and regime context—not guarantees. It does not place orders. It is fully functional as published and contains no placeholders. Nothing herein is financial advice.
Why this is original and useful
Curved time: Markets do not move at a constant pace. LHF Pro computes a Lorentz‑style gamma (γ) from relative speed so its analytical windows contract when the tape accelerates and relax when it slows.
Heavy‑tailed lens: Lorentzian kernels weight information with fat tails to respect rare but consequential extremes (unlike Gaussian decay).
Memory of regimes: A K‑nearest‑neighbors engine works in a multi‑feature space using Lorentz kernels per dimension and exponential age fade , returning a memory bias (directional expectation) and assurance (confidence mass).
One ecosystem: Squeeze, TCI, flow, acceleration, and memory live on the same clock and blend into a single final_score —visualized and documented on the dashboard.
Cognitive map: A 2D heat map projects memory resonance by age and flow regime, making “where the past is speaking” visible.
Shadow portfolio metaphor: Neighbor outcomes act like tiny hypothetical positions whose weighted average forms an educational pressure gauge (no execution, purely didactic).
Mathematical framework (full transparency)
1) Returns, volatility, and speed‑of‑market
Log return: rₜ = ln(closeₜ / closeₜ₋₁)
Realized vol: rv = stdev(r, vol_len); vol‑of‑vol: burst = |rv − rv |
Speed‑of‑market (analog to c): c = c_multiplier × (EMA(rv) + 0.5 × EMA(burst) + ε)
2) Trend velocity and Lorentz gamma (time dilation)
Trend velocity: v = |close − close | / (vel_len × ATR)
Relative speed: v_rel = v / c
Gamma: γ = 1 / √(1 − v_rel²), stabilized by caps (e.g., ≤10)
Interpretation: γ > 1 compresses market time → use shorter effective windows.
3) Adaptive temporal scale
Adaptive length: L = base_len / γ^power (bounded for safety)
Harmonic horizons: Lₛ = L × short_ratio, Lₘ = L × mid_ratio, Lₗ = L × long_ratio
4) Lorentzian smoothing and Harmonic Flow
Kernel weight per lag i: wᵢ = 1 / (1 + (d/γ)²), d = i/L
Horizon baselines: lw_h = Σ wᵢ·price / Σ wᵢ
Z‑deviation: z_h = (close − lw_h)/ATR
Harmonic Flow (HFL): HFL = (w_short·zₛ + w_mid·zₘ + w_long·zₗ) / (w_short + w_mid + w_long)
5) Flow kinematics
Velocity: HFL_vel = HFL − HFL
Acceleration (curvature): HFL_acc = HFL − 2·HFL + HFL
6) Squeeze and temporal compression
Bollinger width vs Keltner width using L
Squeeze: BB_width < KC_width × squeeze_mult
Temporal Compression Index: TCI = base_len / L; TCI > 1 ⇒ compressed time
7) Entropy (regime complexity)
Shannon‑inspired proxy on |log returns| with numerical safeguards and smoothing. Higher entropy → more chaotic regime.
8) Memory bank and Lorentzian k‑NN
Feature vector (5D):
Outcomes stored: forward returns at H5, H13, H34
Per‑dimension similarity: k(Δ) = 1 / (1 + Δ²), weighted by user’s feature weights
Age fading: weight_age = mem_fade^age_bars
Neighbor score: sᵢ = similarityᵢ × weight_ageᵢ
Memory bias: mem_bias = Σ sᵢ·outcomeᵢ / Σ sᵢ
Assurance: mem_assurance = Σ sᵢ (confidence mass)
Normalization: mem_bias normalized by ATR and clamped into band
Shadow portfolio metaphor: neighbors behave like micro‑positions; their weighted net forward return becomes a continuous, adaptive expectation.
9) Blended score and breakout proxy
Blend factor: α_mem = 0.45 + 0.15 × (γ − 1)
Final score: final_score = (1−α_mem)·tanh(HFL / (flow_thr·1.5)) + α_mem·tanh(mem_bias_norm)
Breakout probability (bounded): energy = cap(TCI−1) + |HFL_acc|×k + cap(γ−1)×k + cap(mem_assurance)×k; breakout_prob = sigmoid(energy). Caps avoid runaway “100%” readings.
Inputs — every control, purpose, mechanics, and tuning
🔮 Lorentz Core
Auto‑Adapt (Vol/Entropy): On = L responds to γ and entropy (breathes with regime), Off = static testing.
Base Length: Calm‑market anchor horizon. Lower (21–28) for fast tapes; higher (55–89+) for slow.
Velocity Window (vel_len): Bars used in v. Shorter = more reactive γ; longer = steadier.
Volatility Window (vol_len): Bars used for rv/burst (c). Shorter = more sensitive c.
Speed‑of‑Market Multiplier (c_multiplier): Raises/lowers c. Lower values → easier γ spikes (more adaptation). Aim for strong trends to peak around γ ≈ 2–4.
Gamma Compression Power: Exponent of γ in L. <1 softens; >1 amplifies adaptation swings.
Max Kernel Span: Upper bound on smoothing loop (quality vs CPU).
🎼 Harmonic Flow
Short/Mid/Long Horizon Ratios: Partition L into fast/medium/slow views. Smaller short_ratio → faster reaction; larger long_ratio → sturdier bias.
Weights (w_short/w_mid/w_long): Governs HFL blend. Higher w_short → nimble; higher w_long → stable.
📈 Signals
Squeeze Strictness: Threshold for BB1 = compressed (coiled spring); <1 = dilated.
v/c: Relative speed; near 1 denotes extreme pacing. Diagnostic only.
Entropy: Regime complexity; high entropy suggests caution, smaller size, or waiting for order to return.
HFL: Curved‑time directional flow; sign and magnitude are the instantaneous bias.
HFL_acc: Curvature; spikes often accompany regime ignition post‑squeeze.
Mem Bias: Directional expectation from historical analogs (ATR‑normalized, bounded). Aligns or conflicts with HFL.
Assurance: Confidence mass from neighbors; higher → more reliable memory bias.
Squeeze: ON/RELEASE/OFF from BB

Volume v4 (Dollar Value) by Koenigsegg📊 Volume v3 (Dollar Value) by Koenigsegg
🎯 Purpose:
Volume v3 (Dollar Value) by Koenigsegg transforms traditional raw-unit volume into dollar-denominated volume, revealing how much money actually flows through each candle.
Instead of measuring how many coins or contracts were traded, this version calculates the total traded value = volume × average price (hlc3), allowing traders to visually assess capital intensity and market participation within each move.
⚙️ Core Features
- Converts raw volume into USD-based traded value for each candle.
- Color-coded bars show bullish (green/teal) vs. bearish (red) activity.
- Built-in SMA and SMMA overlays highlight sustained shifts in value flow.
- Designed for visual clarity to support momentum, exhaustion, and divergence studies.
📖 How to Read It
Rising Dollar Volume — indicates growing market participation and strong capital flow, often aligning with impulsive waves in trend direction.
Falling Dollar Volume — signals waning interest or reduced participation, potentially hinting at correction or exhaustion phases.
Comparing Legs — when price makes new highs/lows but dollar volume weakens, it can reveal divergences between price movement and actual capital commitment.
SMA / SMMA Lines — use them to identify longer-term accumulation or depletion of market activity, separating short bursts from sustained inflows or outflows.
The goal is to visualize the strength of market moves in terms of capital energy, not just tick activity. This distinction helps traders interpret whether a trend is being driven by genuine money flow or low-liquidity drift.
⚠️ Disclaimer
This script is provided for research and educational purposes only.
It does not constitute financial advice, investment recommendations, or trading signals.
Always conduct your own analysis and manage your own risk when trading live markets.
The author accepts no liability for financial losses incurred from use of this tool.
🧠 Credits
Developed and published by Koenigsegg.
Written in Pine Script® v6, fully compliant with TradingView’s House Rules for Pine Scripts.
Licensed under the Mozilla Public License 2.0.
Directional Indicator Crossovers v1[JopAlgo]Directional Indicator Crossovers v1 — the classic DMI, made clearer and easier to act on
We'd like to introduce you to a more relaxed, streamlined version of DI. While it may not seem like it at first glance, we've taken the D+/D- method as a starting point and developed our own version of this indicator: two lines, a smooth green/red field indicating who's in control, and clear crossover alerts for a flip. We deliberately chose the step line representation because it closely matches the candlestick patterns on the chart. Designed to help you react faster—without clutter.
What you’ll see
+DI (green) and −DI (red) using classic Wilder smoothing.
A soft control zone between the lines: green when +DI dominates, red when −DI dominates.
Crossover alerts (no labels, no background flooding)—just the turning points.
Why this helps
Instant bias: the shaded field tells you who’s in control without reading values.
Cleaner execution: minimal visuals keep focus on the handoff (+DI↔−DI) and your price levels.
Actionable by design: built-in alerts fire right at the flip to route into your workflow.
How to read it
Bias: Green zone → buyers lead. Red zone → sellers lead.
Trigger: Consider entries on the DI crossover that aligns with your higher-timeframe context (trend, S/R, OB).
Patience in chop: If flips are frequent in tight ranges, wait for sustained zone dominance or confirm on a higher TF.
Exit/flip: Opposite crossover or a clear loss of dominance.
Settings that matter
DI Length (default 14): Higher = calmer, fewer flips. Lower = faster, more signals.
Visuals: Keep the control zone on for quick reads; hide crossover marks if you prefer pure lines.
Alerts: Enable bullish and bearish DI cross alerts; connect to notifications or webhooks as needed.
Starter presets
Intraday (15m–1H): DI Length 12–14 for quicker handoffs.
Swing (4H–1D): DI Length 14–20 for cleaner signals.
Choppy assets: Nudge length higher to dampen noise.
Where it shines (and limits)
Best: Liquid markets (crypto majors, indices, large caps) where handoffs matter.
Works elsewhere: Still useful on slower pairs; extend length for stability.
Limit: Frequent flips in low-range sessions—pair with HTF bias or structure.
Alerts included
Bullish DI Crossover: +DI crosses above −DI.
Bearish DI Crossover: −DI crosses above +DI.
Attribution & License
Built on the Directional Movement Index concept by J. Welles Wilder Jr. (1978).
Independent Pine v6 implementation (not derived from TradingView’s built-in source).
Released as Open Source (MPL-2.0)—please keep the license header intact.
Disclaimer
For educational purposes only; not financial advice. Trading involves risk. Test first, use clear levels, and manage risk. This project is independent and not affiliated with or endorsed by TradingView.
India VIX Based Nifty/BankNifty Range Calculator (Auto Fetch)VIX-Based Expected Daily Range (Auto Volatility Forecast)
Created by: Harshiv Symposium
📖 Purpose
This indicator automatically fetches the India VIX value and calculates the expected daily price range for major Indian indices such as Nifty and BankNifty.
It helps traders understand how much the market is likely to move today based on current volatility conditions.
Designed for educational and analytical awareness, not for signals or profit-making systems.
⚙️ Core Logic
Expected Daily Move (Range) = (India VIX × Current Index Price) ÷ Multiplier
- Multiplier for Nifty: 1000
- Multiplier for BankNifty: 700
This calculation projects the 1-standard-deviation (≈ 68% probability) and 2-standard-deviation (≈ 95% probability) movement zones for the day.
📊 Example
If India VIX = 15 and Nifty = 25,000:
Expected Move ≈ (15 × 25,000) ÷ 1000 = 375 points
Hence,
- 68% Range: 24,625 – 25,375
- 95% Range: 24,250 – 25,750
This gives traders a realistic idea of daily volatility boundaries.
🧭 Key Features
✅ Auto-Fetch India VIX
No need for manual input — automatically pulls live data from NSE:INDIAVIX.
✅ Dynamic Range Visualization
Plots upper/lower boundaries for 1σ and 2σ probability zones with shaded expected-move area.
✅ Dashboard Panel
Displays:
- Current VIX
- Expected Move (in points and %)
- Upper and Lower Ranges
✅ Smart Alerts
Alerts when price crosses upper or lower volatility range — potential breakout signal.
🎯 How It Helps
Intraday Traders:
Know the likely daily movement (e.g., ±220 pts on Nifty) and plan realistic targets or stops.
Options Traders:
Quickly assess whether it’s a seller-friendly (low VIX, small range) or buyer-friendly (high VIX, large range) session.
Risk Managers:
Use volatility context for stop-loss width and position sizing.
Breakout Traders:
If price breaks beyond the 2σ range → indicates potential volatility expansion.
💡 Interpretation Guide
Condition Market Behavior Strategy Insight
VIX ↓ ( < 14 ) Calm / Range-bound Option Selling Edge
VIX ↑ ( > 20 ) Volatile Sessions Option Buying Edge
Price within Range Stable Market Mean Reversion Setups
Price breaks Range Volatility Expansion Breakout Trades
⚠️ Disclaimer
This indicator is for educational and awareness purposes only.
It does not generate buy/sell signals or guarantee returns.
Always apply your own analysis and risk management.

EMA (5, 10, 20, 50, 100, 150, 200)+VWAP+BBEMA Cluster + VWAP + Bollinger Bands + Alerts + Visual Signals (Fixed)
KP_EMA_Cross_signal KP_EMA_Cross_signal : This signal removes a lot of false signals and will help in day trading.

Liquidity Sweeps 2nd attemptLiquidity Sweeps 2nd attempt
The Liquidity Sweeps indicator detects the presence of liquidity sweeps on the user's chart, while also providing potential areas of support/resistance or entry when Liquidity levels are taken.
In the event of a Liquidity Sweep a Sweep Area is created which may provide further areas of interest.