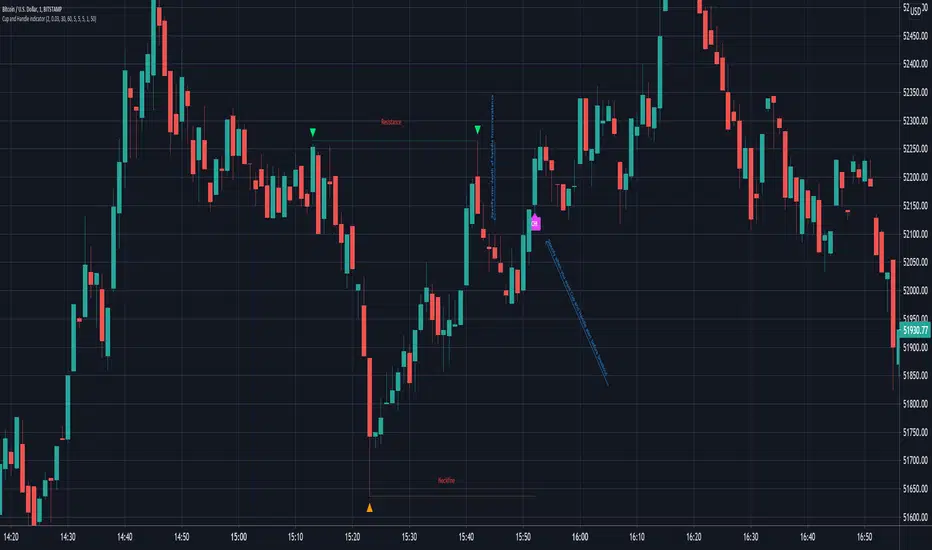
Cup and Handle IndicatorThis is a Cup and Handle Indicator. Features include:
Can set alert at any point after handle starts rising before breakout
Can detect multiple tops before confirming cup and handle pattern, not just double.
Many settings to adjust to meet your exact requirements
The functionality of this indicator is very similar to my double top indicator , and inherits majority of the settings/inputs. Please try that indicator before using this one.
From Wikipedia: In the domain of technical analysis of market prices, a cup and handle or cup with handle formation is a chart pattern consisting of a drop in the price and a rise back up to the original value, followed first by a smaller drop and then a rise past the previous peak. It is interpreted as an indication of bullish sentiment in the market and possible further price increases.
The cup part of the pattern should be fairly shallow, with a rounded or flat "bottom" (not a V-shaped one), and ideally reach to the same price at the upper end of both sides. The drop of the handle part should retrace about 30% to 50% of the rise at the end of the cup. For stock prices, the pattern may span from a few weeks to a few years; but commonly the cup lasts from 1 to 6 months, while the handle should only last for 1 to 4 weeks.
The "cup and handle" formation was defined by William O'Neil"
Key settings to note compared to my double top indicator are highlighted in following image
PM me to obtain access
Best regards.
Double Top
Double Top Double Bottom [MS]Automatic Double Top and Double Bottom pattern scanner for any time frame, any asset.
Simple to use, just add to your chart, and set the size (in the settings) for the patterns you want to find.
• Green patterns are bullish
• Red patterns are bearish
• Alerts are available for when new patterns are displayed
• When a pattern completes (at the neckline), it will change from dotted lines to solid lines.
To scan for multiple sizes of patterns, add the script to your chart multiple times.
Use the link below or PM us to obtain access to this indicator.

Fluffykat's Double Top indicator with alert v1This is a free double top indicator with an alert that has many settings to customize your double top.
From Wikipedia "The double top is a frequent price formation at the end of a bull market. It appears as two consecutive peaks of approximately the same price on a price-versus-time chart of a market. The two peaks are separated by a minimum in price, a valley. The price level of this minimum is called the neck line of the formation. The formation is completed and confirmed when the price falls below the neck line, indicating that further price decline is imminent or highly likely."
The following can be customized:
The left and right bar strengths for both the Right Top (RT) and Left Top (LT). For an explanation on RT/LT bar strength see (pivothigh) tradingview pine script API notes.
The price variance in % between RT / LT
The minimum and maximum allowable separation between RT/LT
Ability to toggle visibility of prices
Best regards.

Cyatophilum Double Top & Bottom [ALERTSETUP]Private Indicator
Version Alpha
The indicator is subject to changes.
This indicator's goal is to help automatically find double top and double bottom patterns.
Its core algorithm uses purely price action and does not use any kind of overbought/oversold oscilator.
To be validated, a double top/bottom must be preceded by a simple top/bottom.
Parallel Channels
To be validated, a double top/bottom must be inside the top/bottom parallel channel. Channels will expire after some time. A channel's range is automatically calculated when changing timeframe or symbol. Channels can be used to trade breakouts after a double top/bottom happened.
Alerts
This indicator allows to create automated alerts in order to receive signals for an event. The available alerts are:
Double Bottom
Double Top
Simple Bottom
Simple Top
Send me a message if you would like to help me test the indicator.

Double Top Pattern IdentifierHello friends,
This script is a powerful, non-repainting detector for the classic Double Top pattern — one of the most widely recognized bearish reversal setups. The indicator automatically identifies and tracks developing 'M'-shaped formations in real-time, confirming valid entries once the neckline is broken and providing complete trade management features. No manual configuration for detection is needed — it works out of the box.
🛠 How It Works
It uses advanced techniques that involve pivot points analysis and do not rely on other indicators, ensuring robustness and adaptability across different market conditions. When a potential Double Top is detected, the indicator marks the pattern points, draws the neckline, and waits for confirmation.
Once confirmed, it generates a 'Short' signal with calculated Take Profit (TP) and Stop Loss (SL) levels.
The script includes a statistics table summarizing performance metrics — such as number of patterns, trade results, bar distances, and top differences — all dynamically updated on your chart.
🔥 Key Features
Pine Script V6 — optimized logic and performance
Works out of the box — no manual configuration required
Non-repainting detection
Fully visualized structure — points, neckline, TP, and SL plotted automatically
Multiple TP/SL modes: R/R ratio, ATR-based, percent, points, pips, ticks, or top-to-neckline distance
Trailing Stop Loss support
Interactive statistics table with pattern count, trade outcomes, profit ratio, and structural measurements
Smart alert system
Customizable alert messages with placeholders (price, ticker, timeframe, etc.)
Clean, updated UI with improved layout and organization
If you'd like access or have any questions, feel free to reach out to me directly via DM.
👋 Good luck and happy trading!
Bezahltes Script

Dav-o meter (public)I decided to make this formerly invite only script public (you can find the invite only version here
If you are part of the invite only you don't need to change scripts. I will push improvements first on the invite only script but in time it will come to this version as well.
I would love to know your ideas and thoughts on how this indicator can be improved, so feel free to give any feedback.
Remember to give it a thumbs up if you like it.
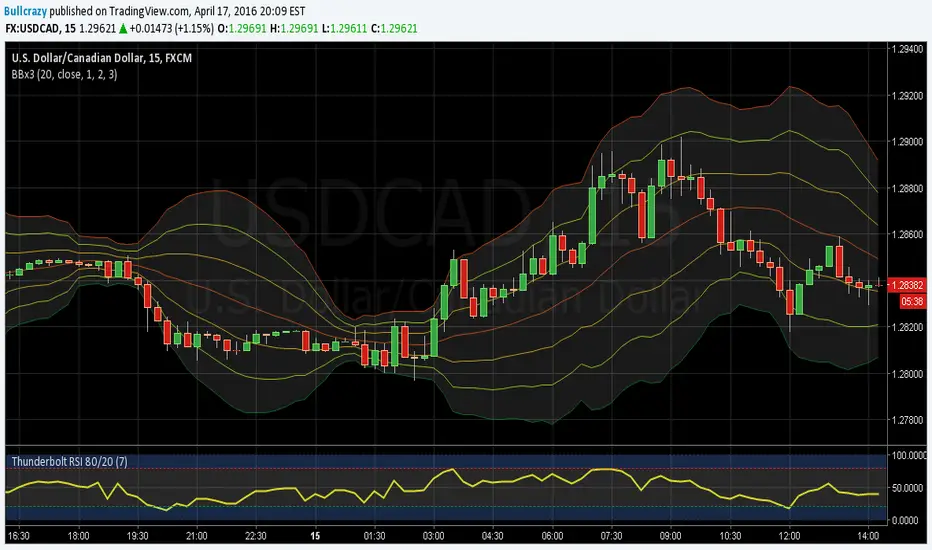
Triple Bollinger BandsI found myself using multiple bollinger bands a lot so I decided to add them all to one script and add the ability to adjust them by 0.2. It has helped me by not taking up as much space in the upper left corner as well as improving my in's and outs of trend continuation trades. If you manage to find a double top at +2 or greater deviation, and with a bearish divergence on the RSI as shown in this picture, GO SHORT SON! This was a fast and easy 35 - 40 pips and if you used your fibonacci for an exit you had little doubt of the final result and could have even been prepared for an immediate reversal knowing you were then at an oversold -2.8 deviation. I could go on and on........