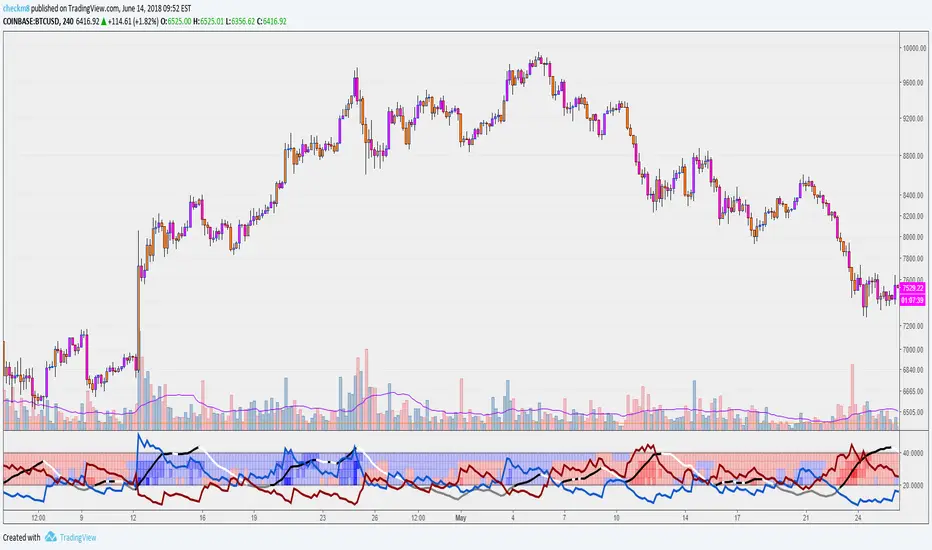
improved DmiThis is a new indicator that make the normal DMI better
insread of the ADX I put a volume indicator that have been transformed to be on regular scripts
with this it much more easy to spot the true buy and sell points by the DMI
have fun
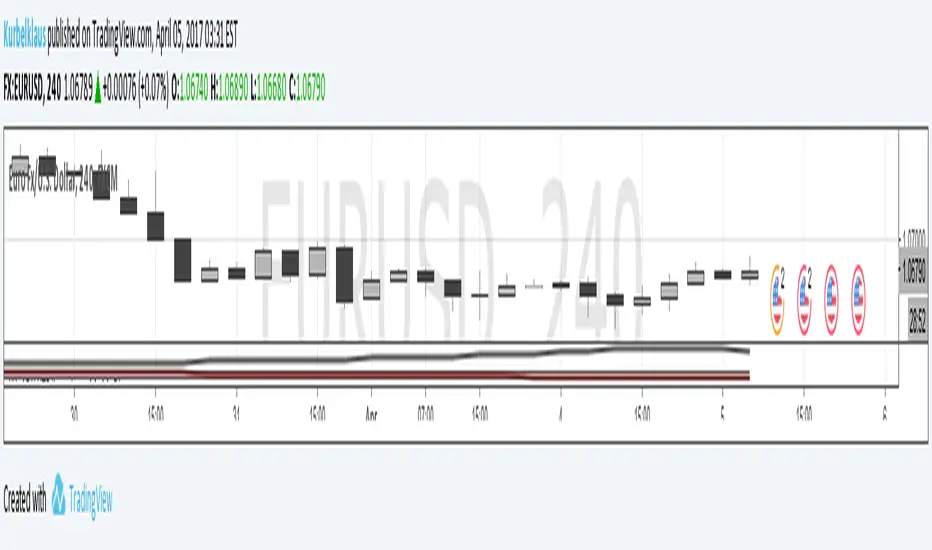
DMI


[RS]Volume Rsidmi This indicator has the following:
1. volume rsi based on Ricardo Santos great work
2.DMI
3.fib candle
the buy points are based on volume break of rsi (not rsi) filter by DMI and the candle fib based on fibo points
sell point the same just in reverse
this indicator give you volume based on rsi to gether with other stuff so the buy points seems to be more accurate and it not repainting.
I hope you will like it

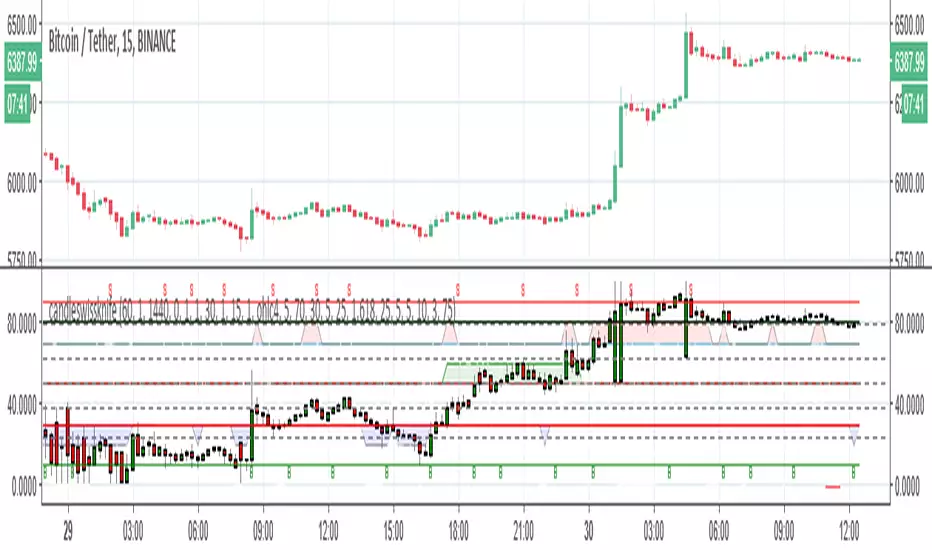
candleswissknifethere are two system to buy and sell in this indicator
system 1 is based on long ema and short ema with heiken candle and macd filter (green=buy and red=sell) line bellow the candles)
system 2 is based on fib candle and fast rsi and fast adx crossing (blue=buy line and gray=sell line bellow candle)
B and S are points of stoch rsi crossing
inside there are points of divergence based on ATR and rsi
ADX coded with DIAn easier to read implementation of ADX and DI, with colour indicating direction of trend, oscillator indicating strength of trend, and below threshold shown with a lack of colour (black).

swissknife system all in oneSO how this system work
1. B and S top and button are stoch cross points
2.the area highlighted in blue and red are zone where RSI DMI and ATR are in agreement
3. The candles are based on fibonaci so if the candle are below 10 is low fib and if above 90 its high fib
so how to find best buy points
1. search for B points the fall in blue area =RSI low and D- high
2.sell points =s that fall in red area =high rsi + D+ high
3. the candle based on fib so it easy to see if the points potential buy and sell fall in high or low fib
4. potential buy and sell points can also be found on base of cross of D- and D+ adding adx make it easy
in this version no alert but in next version I try to put something on it :)

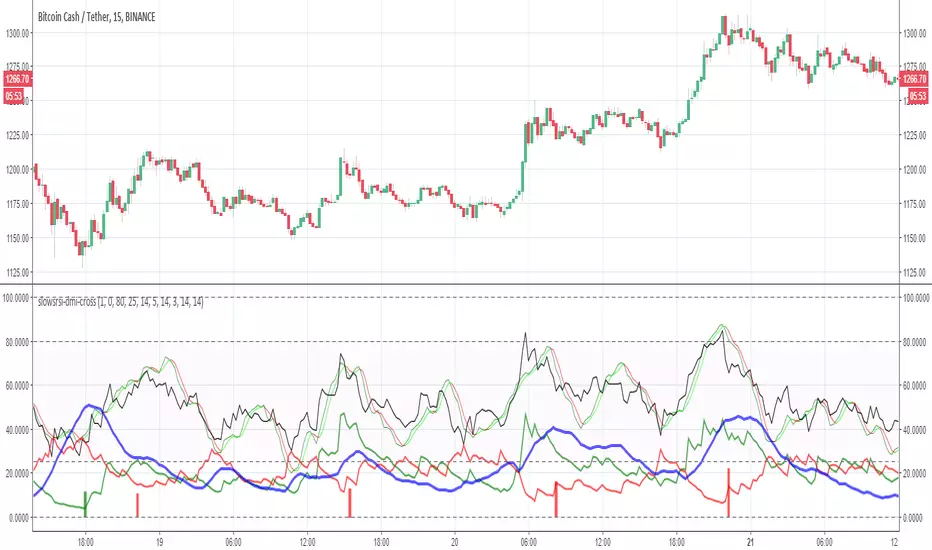
slowsrsi-dmi-crossThis model is based on buy and sell points according to rsi +DMI and the cross up of slow stoch
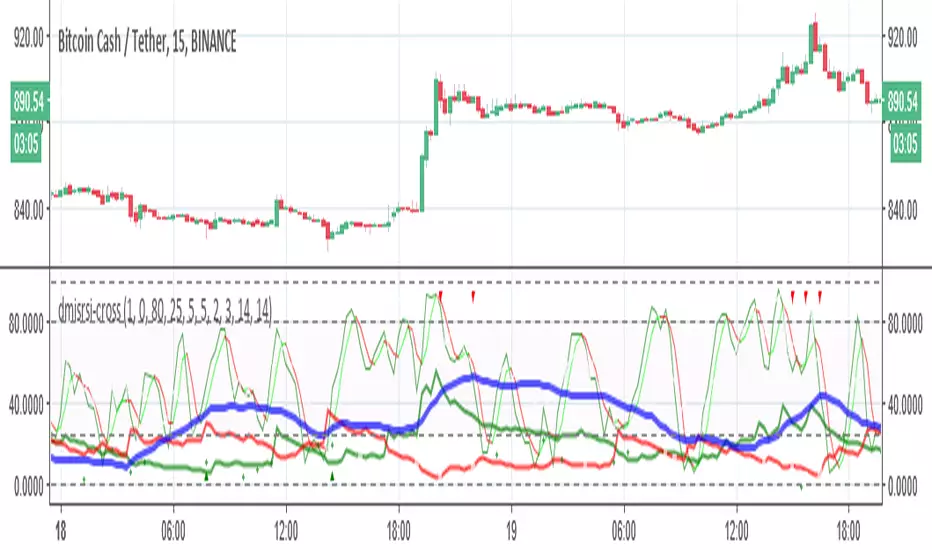
dmi-srsi-crossthis indicator show you the best buy points and sell points on a combination of DMI and SRSI cross up or down represented in green or red triangular dots
dmi-srsi-candleThe indicator has 3 part
1. buy sell pints based on rsi and stoch and DMI = green red trinagukar
2. crossing up of srsi =green cross points
3. fibonaci candels= below 10 best buy ,above 90 =best sell according to candles

DMI-RSI-candlesthis system is based on RSI+DMI and special candle based on fibonacci levels, best buy poiny is RSI + indicated in green triangle, DMI above 30 (red line) and low fib level ( bellow 30 better bellow 10) ..have fun

MTF ADX and DMI Grid with RSIHello and welcome to my latest revision of my ADX and DMI series.
This indicator features the Average Directional Index (ADX) and the Directional Moving Index (DMI), with a multi-timeframe (MTF) grid that shows you the dominant DMI on the select timeframes. There are four grid rows, allowing you to select four different timeframes to show in the study. In addition to this, the colors displayed in the grid will reflect RSI levels, when the RSIs on the select timeframes exceed 70 or 80, or fall below 30 or 20.
For example, if one of your select timeframes is 4h, the standard settings will display a blue block in the relative row of the grid if the +DMI is above the -DMI on the 4h timeframe. If the RSI exceeds 70, the shade of blue will become darker, and become even darker if the 4h RSI exceeds 80. This will apply for the inverse case, where if the -DMI is dominant, the grid will display a darker shade of red as the 4h RSI falls below 30 and 20.
The ADX is the line in the oscillator that changes between black, white, and gray. ADX will be black when it is rising, white when it is falling, and gray when it is below the key level value (default set to 20). When ADX is below 20, you can assume the dominant DMI is irrelevant as there is no real trend strength. You can change your set key value in the oscillator settings, as well as all the colors, and so on.
If you are not familiar with the ADX and DMI indicator, a useful guide can be found below:
1) An ADX reading below 20 signifies that there is no prevailing trend in play. This means that, regardless of DMI dominance, there is no real strength. This is a good measure for sideways price action.
2) If +DMI is above -DMI, this means that a bullish trend is in play, and vice versa (where a -DMI dominance shows a bearish trend in play). Make sure to pay attention to the value of ADX, as this will show the significance of DMI dominance.
3) The strongest possible position you can have is one where the DMIs have a crossover on an ADX that is perking or sloping upwards.
4) You should be exiting your positions at the peak of the ADX , shown by the color changes, as this is often the furthest extent of the dominant trend. Once the ADX tips, the trend weakens and is less likely to see continuation. NOTE: Divergences are possible, where the ADX may be falling, but the dominant trend sees continuation. This simply means that the dominant trend is weakening, but still going.
5) Speculating on DMI crossovers is dangerous, especially on larger timeframes. Be careful when doing so if you are not familiar with the calculations behind the DMIs and if you are not familiar with how movements on lower timeframes translate to larger timeframes.
Additional resources to learn about ADX & DMI:
1) seekingalpha.com
2) stockcharts.com
Previous versions:
1)
2)
Happy trading and feel free to reach out with any question, suggestions, or concerns!
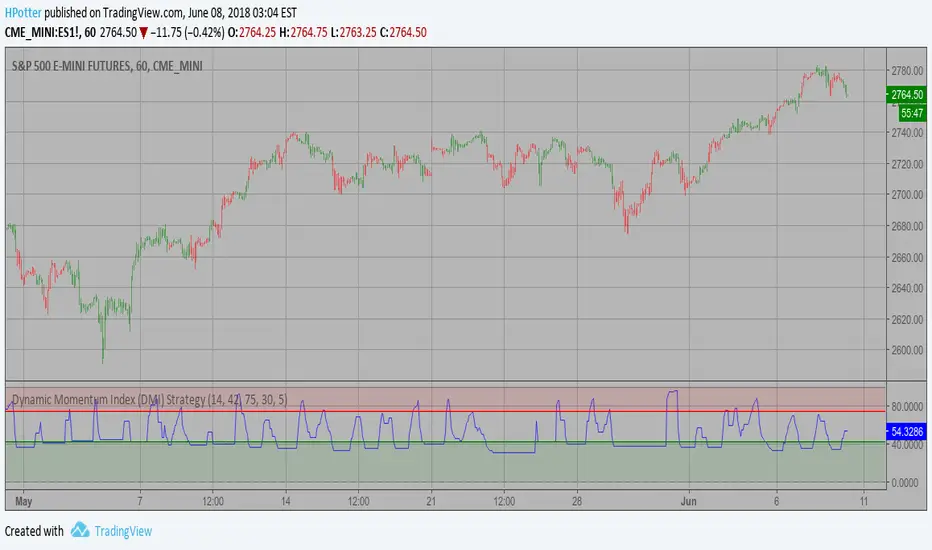
Dynamic Momentum Index (DMI) Backtest This indicator plots Dynamic Momentum Index indicator. The Dynamic Momentum
Index (DMI) was developed by Tushar Chande and Stanley Kroll. The indicator
is covered in detail in their book The New Technical Trader.
The DMI is identical to Welles Wilder`s Relative Strength Index except the
number of periods is variable rather than fixed. The variability of the time
periods used in the DMI is controlled by the recent volatility of prices.
The more volatile the prices, the more sensitive the DMI is to price changes.
In other words, the DMI will use more time periods during quiet markets, and
less during active markets. The maximum time periods the DMI can reach is 30
and the minimum is 3. This calculation method is similar to the Variable
Moving Average, also developed by Tushar Chande.
The advantage of using a variable length time period when calculating the RSI
is that it overcomes the negative effects of smoothing, which often obscure short-term moves.
The volatility index used in controlling the time periods in the DMI is based
on a calculation using a five period standard deviation and a ten period average
of the standard deviation.
You can change long to short in the Input Settings
WARNING:
- For purpose educate only
- This script to change bars colors.

Dynamic Momentum Index (DMI) Strategy This indicator plots Dynamic Momentum Index indicator. The Dynamic Momentum
Index (DMI) was developed by Tushar Chande and Stanley Kroll. The indicator
is covered in detail in their book The New Technical Trader.
The DMI is identical to Welles Wilder`s Relative Strength Index except the
number of periods is variable rather than fixed. The variability of the time
periods used in the DMI is controlled by the recent volatility of prices.
The more volatile the prices, the more sensitive the DMI is to price changes.
In other words, the DMI will use more time periods during quiet markets, and
less during active markets. The maximum time periods the DMI can reach is 30
and the minimum is 3. This calculation method is similar to the Variable
Moving Average, also developed by Tushar Chande.
The advantage of using a variable length time period when calculating the RSI
is that it overcomes the negative effects of smoothing, which often obscure short-term moves.
The volatility index used in controlling the time periods in the DMI is based
on a calculation using a five period standard deviation and a ten period average
of the standard deviation.
WARNING:
- This script to change bars colors.
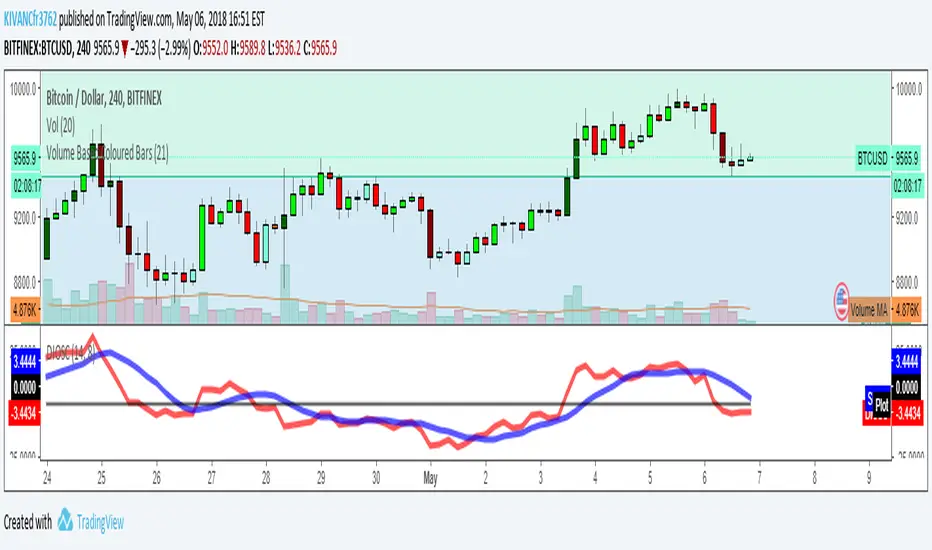
Directional Movement Oscillator by KIVANÇ fr3762Directional Movement Oscillator is simply the difference of Di+ and Di- which helps traders to see the crosses of BUY/SELL signals more effectively.
Di+ crosses above Di- when indicator crosses above 0 which can be considered as a BUY signal.
and conversely Di+ crosses below Di- when indicator crosses below 0 which can be considered as a SELL signal.
Additionally I put a second (OPTIONAL) line (Signal line) which is a 8 bar SMA ( Simple Moving Average ) of DMOSC to confirm signals for further assistance.
Users can add the second optional line (Signal Line) by checking the box : Show SMA line? on the INPUTS section of the indicator SETTINGS menu.
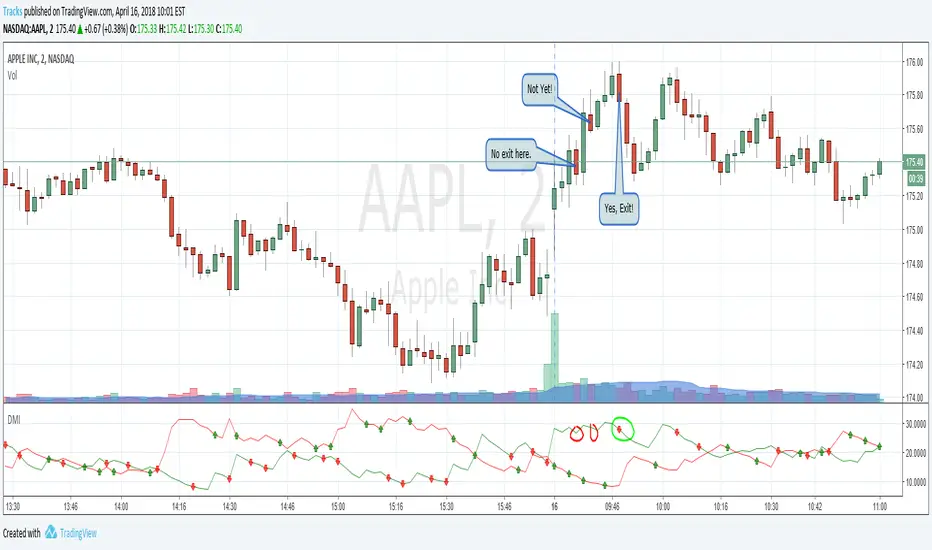
Directional Movement Index ConfirmationThis indicator helps determine the exit point of a play. Lots of green candles making you money? Got one red candle and now you're worried if this is the top? Check this indicator! A red arrow helps confirm that bearish pressure is rising while bull pressure is declining, and this may be your chance to exit. Works the opposite way for short plays, giving a green candle to help confirm the bottom.
This indicator was written to help educate members over at OptionsPlayers.com
DMI StochasticModification of DMI Stochastic indicator created by USGEARS, as requested by another user. This version just colors columns along with the indicator arrow.

checkm8's ADX & DMI v2 with MTF Godmode CrossoversHello & welcome to my updated version of the ADX & DMI indicator.
The average directional index and directional moving indices are a godsend and I think you should incorporate it into your trading.
Here's a quick how-to:
A detailed guide is available in my first version:
Additional edits:
My indicator paints the background of the indicator green when +DMI is above -DMI and red when -DMI is above +DMI. In addition to this, the background will paint darker green when the RSI on the timeframe exceeds 70 and even darker when the RSI exceeds 80, in a +DMI dominance. The background will paint darker red when the RSI on the timeframe falls below 30 and even darker when the RSI falls below 20, in a -DMI dominance.
The indicator also displays multi-timeframe (MTF) crossovers on Godmode MACDs, plotted on the ADX line. If the dots are teal, it means that the shorter-term MA crossed above the longer-term MA (bullish), and if it is fuchsia, the shorter-term MA crossed below the longer-term MA (bearish).
Additional notes:
Additional edits:
1) Speculating on DMI crossovers is dangerous, especially on larger timeframes. Be careful when doing so if you are not familiar with the calculations behind the DMIs and if you are not familiar with how movements on lower timeframes translate to larger timeframes.
Additional resources to learn about ADX & DMI:
1) seekingalpha.com
2) stockcharts.com
Special thanks:
-xSilas, for the development of the Godmode calculations used in my indicator
-dent77x, for being a thinkpool and emotional support
-kristarling, for help with the coding

ADX + DMI v.checkm8Hello & welcome to my custom version of the ADX & DMI indicator.
The average directional index and directional moving indices are a godsend and I think you should incorporate it into your trading.
Here's a quick how-to:
The ADX , despite its name, is a directional index but only represents the strength of the dominant trend, which is marked by the DMIs ( +DMI and -DMI ). To interpret this, a rising ADX signifies that the dominant trend is gaining strength or momentum, while a falling ADX represents the weakening of the dominant trend. My indicator paints the ADX black if it is rising (trend gaining strength) and white if it is falling (trend losing strength). The ADX also has a critical level of 20, which signifies whether or not a trend actually exists. For example, if the ADX is above 20, there is a trend in effect, but if it is below 20 - there is no definite trend in play, even if the price may be rising or falling. On my indicator, the ADX turns grey when it is below 20 to signify the irrelevance of the dominant trend at such points. To better explain this, it does not matter which DMI dominates when the ADX is below 20, as it can be interpreted as a very weak move.
There are two DMIs, represented by +DMI (blue), which represents bullish momentum, and -DMI (red), which represent bearish momentum. If the +DMI dominates the -DMI , a bullish trend is most likely at play, and if the -DMI dominates the +DMI , a bearish trend most likely prevails. The ADX must be considered in this, as a +DMI dominance over -DMI when ADX is below 20 could be interpreted as "chop", with no clear directional signals, while the same dominance on a rising ADX will represent a strong momentum in favor of the dominant DMI.
The aim of the indicator is to identify trend reversals and give signals to newly developing trends. Crossovers are a key element, as they dictate which DMI dominates the playing field.
Additional notes:
1) The strongest possible position you can have is one where the DMIs have a crossover on an ADX that is perking or sloping upwards.
2) You should be exiting your positions at the peak of the ADX , shown by the color changes, as this is often the furthest extent of the dominant trend. Once the ADX tips, the trend weakens and is less likely to see continuation. NOTE: Divergences are possible, where the ADX may be falling, but the dominant trend sees continuation. This simply means that the dominant trend is weakening, but still going.
3) The indicator has green and red bars to show which trend dominates. If the +DMI is above -DMI , the area until the next crossover will be green, while a -DMI dominance over +DMI will show a red area until the crossover.
4) If you have any questions, feel free to reach out and ask me!

DMI strategykr.tradingview.com
Time of purchase : After the triangle under the Candle, Buy it if cross Just before the high on the day. and Consider the down trend and Whether the color of the candle is green and lime.
DMI+ADX를 이용한 전략입니다. +DI가 -DI를 상향돌파하면 캔들 아래 삼각형이 생기며 봉 캔들이 그린이면 +DI > -DI 일때이며 진정한 상승은 ADX도 20보다 클때인 형광색 캔들일때 입니다.
매수시점은 당일 즉 블루라인 범위내에서 고점을 캔들아래 삼각형 생기고 캔들색이 그린이나 형광색일때 돌파하면 매수입니다. 그리고 하향추세선이 위에있으면 참고하셔야합니다. 올라갈 공간이 있는지 확인해야합니다.

Dav-o meter (public)I decided to make this formerly invite only script public (you can find the invite only version here
If you are part of the invite only you don't need to change scripts. I will push improvements first on the invite only script but in time it will come to this version as well.
I would love to know your ideas and thoughts on how this indicator can be improved, so feel free to give any feedback.
Remember to give it a thumbs up if you like it.
[naoligo] Simple ADXI'm publishing this indicator just for study purposes, because the result is exactly the same as DMI without the smoothing factor. It is exactly the same as ADX Wilder from MT5.
I was looking for the algorithm all over and it was a pain to find the right formula, meaning: one that would match with the built-in ones. After several study and comparison, I still didn't find the algorithm that match with the MT5's built-in simple ADX ...
Enjoy!

KK_Average Directional Index (ADX) Higher TFHey guys,
sometimes you just want to plot an Indicator value from a higher Timeframe on your Chart. For most Indicators this is pretty straightforward however there is one Indicator that has been giving me quite a headache while trying to do this: The Average Directional Index . Anyway after going through almost 200 versions of this script I finally found a solution that works and thought I would share this with you, since I'm sure some of you have encountered the same problem.
How it works
Go to your desired Instrument/Timeframe and add the Script
Under Settings in the field for "Higher ADX TF" put the Timeframe-code you want to pull the ADX Values from.
- Codes: Monthly - M, Weekly W, Daily - D
- Codes Intraday: The amount of hours in minutes, e.g. if you want to pull values from the 4h-Chart the code is 240 (60 for 1h, 15 for 15m ...)
In some cases (see below) the calculation might not be correct. So make sure the values are correct:
a) Write down the latest ADX of the higher TF while you are on the lower TF
b) Switch the Resolution to the higher TF
c) Compare the value you have just written down to the next to last value. They should be the same.
d) Switch back the Resolution to the lower TF and you're good to go.
Limitations
You can only pull values from higher Timeframes, e.g. you're on a 4h Chart, so you can only pull values from the Daily, Weekly and Monthly Chart. You can't pull values from the 1h Chart.
You can only pull values from Timeframes, where the higher Timeframe Close always has a corresponding Close on the lower Timeframe, e.g. you can't pull values from the 3h Chart when you are on a 2h Chart. This should be pretty rare.
The Script needs a certain amount of Data from the Higher TF before the calculated values are correct. I have tested this on several Instruments and the Script usually needs approximately 100 Bars on the higher Timeframe (often less) for the values to be correct (error < 1%).
So when the difference between your lower Timeframe and you higher Timeframe is large, e.g. you want to pull the Daily ADX value on a 15m-Chart, the calculation can be wrong. This can lead to errors in 2 Cases:
a) Backtesting: When you go over old data and get close to the last available Bar the Data will be wrong. This will limit the amount of data you can backtest.
b) Live values: When the difference between the two Timeframes is too large, it is possible that even live values are wrong, e.g. this will be the case when you are trying to pull the Daily ADX value on a 5 minute Chart. Always check if the calculation works with your desired combination of Timeframes before using it (see above).
I hope this is useful for you and whish all of you successful trading!
Best regards
Kurbelklaus