Hidden SMT Divergence ICT 01 [TradingFinder] HSMT SMC Technique🔵 Introduction
Hidden SMT Divergence, an advanced concept within the Smart Money Technique (SMT), identifies discrepancies between correlated assets by focusing on their closing prices.
Unlike the standard SMT Divergence, which uses high and low prices for analysis, Hidden SMT Divergence uncovers subtle signals by examining divergences based on the assets' closing values.
These divergences often highlight potential reversals or trend continuations, making this technique a valuable tool for traders aiming to anticipate market movements.
This approach applies across various markets and asset classes, including :
Commodities : CAPITALCOM:GOLD vs. CAPITALCOM:SILVER or BLACKBULL:BRENT vs. BLACKBULL:WTI .
Indices : NASDAQ:NDX vs. TVC:SPX vs. FX:US30 .
FOREX : FX:EURUSD vs. OANDA:GBPUSD vs. TVC:DXY (US Dollar Index).
Cryptocurrencies : BITSTAMP:BTCUSD vs. COINBASE:ETHUSD vs. KUCOIN:SOLUSDT vs. CRYPTOCAP:TOTAL3 .
Volatility Measures : FOREXCOM:XAUUSD vs. TVC:VIX (Volatility Index).
By identifying divergences within these asset groups, traders can gain actionable insights into potential market reversals or shifts in trend direction. Hidden SMT Divergence is particularly effective for pinpointing subtle market signals that traditional methods may overlook.
Bullish Hidden SMT Divergence : This divergence emerges when one asset forms a higher low, while the correlated asset creates a lower low in terms of their closing prices. It often signals weakening downward momentum and a potential reversal to the upside.
Bearish Hidden SMT Divergence : This occurs when one asset establishes a higher high, while the correlated asset forms a lower high based on their closing prices. It typically reflects declining upward momentum and a probable shift to the downside.
🔵 How to Use
The Hidden SMT Divergence indicator provides traders with a systematic approach to identify market reversals or trend continuations through divergences in closing prices between two correlated assets.
🟣 Bullish Hidden SMT Divergence
Bullish Hidden SMT Divergence occurs when the closing price of the primary asset forms a higher low, while the correlated asset creates a lower low. This pattern indicates weakening downward momentum and signals a potential reversal to the upside.
After identifying the divergence, confirm it using additional tools like support levels, volume trends, or indicators such as RSI and MACD. Enter a buy position as the price shows signs of reversal near support zones, ensuring proper risk management by placing a stop-loss below the support level.
Bearish Hidden SMT Divergence
Bearish Hidden SMT Divergence is identified when the closing price of the primary asset forms a higher high, while the correlated asset creates a lower high. This divergence suggests a weakening uptrend and a likely reversal to the downside.
Validate the signal by examining resistance levels, declining volume, or complementary indicators. Consider entering a sell position as the price starts declining from resistance levels, and set a stop-loss above the resistance zone to limit potential losses.
🔵 Setting
Second Symbol : Select the secondary asset to compare with the primary asset. By default, "XAUUSD" (Gold) is used, but it can be customized to any stock, cryptocurrency, or currency pair.
Divergence Fractal Periods : Defines the number of past candles considered for identifying divergences. The default value is 2, but traders can adjust it for greater precision.
Bullish Divergence Line : Displays a dashed line connecting the points of bullish divergence.
Bearish Divergence Line : Shows a similar line for bearish divergence points.
Bullish Divergence Label : Marks areas of bullish divergence with a "+SMT" label.
Bearish Divergence Label : Highlights bearish divergences with a "-SMT" label.
Chart Type : Choose between Line or Candle charts for enhanced visualization.
🔵 Conclusion
Hidden SMT Divergence offers traders a refined method for identifying market reversals by analyzing closing price discrepancies between correlated assets. Its ability to uncover subtle divergences makes it an essential tool for traders who aim to stay ahead of market trends.
By integrating this technique with other technical analysis tools and sound risk management, traders can enhance their decision-making process and capitalize on market opportunities with greater confidence.
Hidden SMT Divergence’s focus on closing prices ensures more precise signals, helping traders refine their strategies across various markets, including Forex, commodities, indices, and cryptocurrencies.
Its open-source nature allows for customization and verification, providing transparency and flexibility to suit diverse trading needs. Hidden SMT Divergence stands as a powerful addition to the arsenal of any trader seeking to unlock hidden opportunities in dynamic financial markets.
Divergences

SMT Divergence ICT 01 [TradingFinder] Smart Money Technique🔵 Introduction
SMT Divergence (short for Smart Money Technique Divergence) is a trading technique in the ICT Concepts methodology that focuses on identifying divergences between two positively correlated assets in financial markets.
These divergences occur when two assets that should move in the same direction move in opposite directions. Identifying these divergences can help traders spot potential reversal points and trend changes.
Bullish and Bearish divergences are clearly visible when an asset forms a new high or low, and the correlated asset fails to do so. This technique is applicable in markets like Forex, stocks, and cryptocurrencies, and can be used as a valid signal for deciding when to enter or exit trades.
Bullish SMT Divergence : This type of divergence occurs when one asset forms a higher low while the correlated asset forms a lower low. This divergence is typically a sign of weakness in the downtrend and can act as a signal for a trend reversal to the upside.
Bearish SMT Divergence : This type of divergence occurs when one asset forms a higher high while the correlated asset forms a lower high. This divergence usually indicates weakness in the uptrend and can act as a signal for a trend reversal to the downside.
🔵 How to Use
SMT Divergence is an analytical technique that identifies divergences between two correlated assets in financial markets.
This technique is used when two assets that should move in the same direction move in opposite directions.
Identifying these divergences can help you pinpoint reversal points and trend changes in the market.
🟣 Bullish SMT Divergence
This divergence occurs when one asset forms a higher low while the correlated asset forms a lower low. This divergence indicates weakness in the downtrend and can signal a potential price reversal to the upside.
In this case, when the correlated asset is forming a lower low, and the main asset is moving lower but the correlated asset fails to continue the downward trend, there is a high probability of a trend reversal to the upside.
🟣 Bearish SMT Divergence
Bearish divergence occurs when one asset forms a higher high while the correlated asset forms a lower high. This type of divergence indicates weakness in the uptrend and can signal a potential trend reversal to the downside.
When the correlated asset fails to make a new high, this divergence may be a sign of a trend reversal to the downside.
🟣 Confirming Signals with Correlation
To improve the accuracy of the signals, use assets with strong correlation. Forex pairs like OANDA:EURUSD and OANDA:GBPUSD , or cryptocurrencies like COINBASE:BTCUSD and COINBASE:ETHUSD , or commodities such as gold ( FX:XAUUSD ) and silver ( FX:XAGUSD ) typically have significant correlation. Identifying divergences between these assets can provide a strong signal for a trend change.
🔵 Settings
Second Symbol : This setting allows you to select another asset for comparison with the primary asset. By default, "XAUUSD" (Gold) is set as the second symbol, but you can change it to any currency pair, stock, or cryptocurrency. For example, you can choose currency pairs like EUR/USD or GBP/USD to identify divergences between these two assets.
Divergence Fractal Periods : This parameter defines the number of past candles to consider when identifying divergences. The default value is 2, but you can change it to suit your preferences. This setting allows you to detect divergences more accurately by selecting a greater number of candles.
Bullish Divergence Line : Displays a line showing bullish divergence from the lows.
Bearish Divergence Line : Displays a line showing bearish divergence from the highs.
Bullish Divergence Label : Displays the "+SMT" label for bullish divergences.
Bearish Divergence Label : Displays the "-SMT" label for bearish divergences.
🔵 Conclusion
SMT Divergence is an effective tool for identifying trend changes and reversal points in financial markets based on identifying divergences between two correlated assets. This technique helps traders receive more accurate signals for market entry and exit by analyzing bullish and bearish divergences.
Identifying these divergences can provide opportunities to capitalize on trend changes in Forex, stocks, and cryptocurrency markets. Using SMT Divergence along with risk management and confirming signals with other technical analysis tools can improve the accuracy of trading decisions and reduce risks from sudden market changes.

Divergence Indicator Multi [TradingFinder] MACD AO RSI DIV Chart🔵 Introduction
🟣 What is Divergence in Financial Markets?
Divergence in technical analysis happens when the price of a stock moves in a direction opposite to certain indicators. This is a crucial concept in financial markets as it can signal either a trend reversal or a continuation of the current correction in the trend. Understanding divergence helps traders and analysts make more informed decisions.
🟣 Positive Regular Divergence (RD+)
A positive regular divergence occurs at the end of a downtrend, where two price lows form. This divergence appears when the price chart shows a new low, but the indicator does not follow, signaling potential buying opportunities.
Positive divergence indicates increased buying pressure and reduced selling pressure, making it a useful signal for forecasting price increases.
🟣 Negative Regular Divergence (RD-)
A negative regular divergence is seen during an uptrend when two price highs form. The price chart records a new high, but the indicator does not reflect this change, suggesting that a market downturn is likely.
This type of divergence shows strong selling pressure and weaker buying activity, which can help identify selling opportunities.
Both positive and negative divergences are powerful tools for identifying potential trend reversals and key support and resistance levels. For example, when an indicator trends upward while the price moves downward, this creates divergence, warning traders to reconsider their investment strategy.
🟣 Different Types of Divergence in Trading
1. Regular Divergence :
o Positive Regular Divergence (RD+)
o Negative Regular Divergence (RD-)
2. Hidden Divergence :
o Positive Hidden Divergence (HD+)
o Negative Hidden Divergence (HD-)
3.Time Divergence.
Note : This guide focuses specifically on Regular Divergence.
🟣 What is Regular Divergence?
Regular Divergence, often referred to as convergence, occurs when price action and indicators show conflicting patterns, usually signaling the end of a trend. Detecting regular divergence helps traders anticipate potential trend reversals or the formation of reversal patterns.
🔵 How to Use
To optimize the detection of divergence, you can adjust the Fractal Period to specify the length of time for identifying divergence patterns.
Additionally, with the Divergence Detection Method, you can select oscillators like the MACD, RSI, or AO to base divergence detection on.
Divergence in MACD :
MACD divergence occurs when the price chart forms an opposite pattern compared to the MACD line, indicating a potential price reversal.
Divergence in RSI :
In a downtrend, if the price chart forms two consecutive lows with the second lower than the first, but the RSI shows two lows with the second higher, this indicates positive regular divergence, which is a buy signal.
On the other hand, during an uptrend, if the price forms two highs with the second higher than the first, but the RSI shows the second high lower, this points to negative regular divergence, indicating a sell signal.
Divergence in AO (Awesome Oscillator) :
The AO indicator calculates histograms using the difference between 5-period and 34-period simple moving averages. It compares peaks and troughs of these histograms with price movements, detecting divergence and plotting lines and arrows to signal divergence.
🔵 Table
The following table breaks down the main features of the oscillator. It covers four critical categories: Exist, Consecutive, Divergence Quality, and Change Phase Indicator.
Exist : If divergence is detected, a "+" will appear in this row.
Consecutive: Shows the number of consecutive divergences that have formed in a short period.
Divergence Quality : Evaluates the quality of the divergence based on the number of occurrences. One is labeled "Normal," two are "Good," and three or more are considered "Strong."
Change Phase Indicator : If a phase change is detected between two oscillation peaks, this is marked in the table.

All In One Divergences Indicator - By CryptoEasonThis indicator displays divergences for multiple indicators on the chart. It includes divergences for volume, CCI, MACD, OBV, CMF, RSI, MFI, and maybe more in the future.
Below is an explanation of how divergences for these indicators are displayed:
1. Volume
I use volume to assess the strength of demand and supply. The way Volume divergences are calculated is similar to OBV.
Bearish Divergence: The price reaches a new high, but demand starts to weaken.
Bullish Divergence: The price reaches a new low, but supply starts to weaken.
2. CCI
Bearish Divergence: The price reaches a new high, but CCI forms a lower high, and the previous CCI peak is > 200.
Bullish Divergence: The price reaches a new low, but CCI forms a higher low, and the previous CCI low is < -200.
3. MACD
Bearish Divergence: The price reaches a new high, but the MACD lines cross at a lower point.
Bullish Divergence: The price reaches a new low, but the MACD lines cross at a higher point.
4. OBV
Bearish Divergence: The price reaches a new high, but OBV forms a lower high.
Bullish Divergence: The price reaches a new low, but OBV forms a higher low.
5. CMF
Bearish Divergence: The price reaches a new high, but CMF forms a lower high.
Bullish Divergence: The price reaches a new low, but CMF forms a higher low.
6. RSI
Bearish Divergence: The price reaches a new high, but RSI forms a lower high, and the previous RSI peak is > 70.
Bullish Divergence: The price reaches a new low, but RSI forms a higher low, and the previous RSI low is < 30.
7. MFI
Bearish Divergence: The price reaches a new high, but MFI forms a lower high, and the previous MFI peak is > 80.
Bullish Divergence: The price reaches a new low, but MFI forms a higher low, and the previous MFI low is < 20.
This indicator provides a sub-chart that displays seven indicators: Volume, CCI, MACD, OBV, CMF, RSI, and MFI.
When you find a divergence in the chart, I recommend using the sub-chart to check the real-time status of each indicator. This is important and is the way I use this indicator. Whenever a divergence signal appears, check the actual status of all the indicators with divergences.
Reminders:
1.Having too many divergence signals is not always better. Personally, I typically use divergences from four indicators: Volume, CCI, MACD, and OBV, and sometimes I add RSI. I recommend that you use divergence signals only from the indicators you are familiar with. If you're not familiar with a particular indicator, you can disable its divergence signals in the settings.
2.Some indicators are volume-related, such as OBV, Volume, MFI, and CMF. Therefore, the chart you're using should reflect the main trading volume of the market. For example, in the Bitcoin market, I recommend using the COINBASE:BTCUSD chart.
3.The divergence signals for MACD are displayed separately in this indicator. This is because the way MACD divergences are calculated is more complex. It requires the identification of the highs and lows of two MACD line crossovers, which is different from simply identifying the highs and lows of other indicators. Hence, MACD divergences are displayed separately in this indicator.
Note:
Although this indicator currently only shows divergences for seven indicators, I may add more divergence indicators in the future. If you would like to see divergence signals for a particular indicator included, or if you have any feature requests that are not currently offered, feel free to leave a comment and let me know.
============== 中文說明 (Chinese Introduction) ==============
這個指標是一個能在圖表上顯示多個指標背離的指標。
包括:成交量、CCI、MACD、OBV、CMF、RSI、MFI 等多個指標的背離。
以下說明這幾個指標背離的顯示方式:
1、成交量
我用成交量來判斷需求與供應強弱,它的背離判斷方式與OBV類似。
頂背離:價格創新高、但需求卻開始衰竭
底背離:價格創新低,但供應卻開始衰竭
2、CCI
頂背離:價格創新高、但CCI卻更低,且前一個高點 CCI > 200
底背離:價格創新低,但CCI卻更高,且前一個低點 CCI < -200
3、MACD
頂背離:價格創新高、但MACD快慢線交叉創下低點
底背離:價格創新低,但MACD 快慢線交叉雙下高點
4、OBV
頂背離:價格創新高、但OBV卻更低
底背離:價格創新低,但OBV卻更高
5、CMF
頂背離:價格創新高、但CMF卻更低
底背離:價格創新低,但CMF卻更高
6、RSI
頂背離:價格創新高、但RSI卻更低,且前一個高點 RSI > 70
底背離:價格創新低,但RSI卻更高,且前一個低點 RSI < 30
7、MFI
頂背離:價格創新高、但MFI卻更低,且前一個高點 MFI > 80
底背離:價格創新低,但MFI卻更高,且前一個低點 MFI < 20
該指標提供了副圖表,副圖表一共可顯示七個指標:成交量、CCI、MACD、OBV、CMF、RSI、MFI 。
當你發現當前價格出現背離時,我建議使用副圖表來一一檢查指標的真實情況,這很重要,這也是我使用這指標的方式,每當背離訊號出現時,檢查所有背離指標的真實情況。
提醒:
1、背離顯示並不是越多越好,我個人通常只使用 成交量、CCI、MACD、OBV 等四個指標的背離,偶爾會加上 RSI。我也建議你應該只使用自己熟悉的指標的背離,如果你不是很熟悉某個指標,那麼你可以在設定中取消顯示該指標的背離。
2、某些指標與成交量有關,例如OBV、Volume、MFI、CMF 等等,所以你使用的圖表應該要能反應市場的主要成交量,例如在比特幣市場裡,建議以 COINBASE:BTCUSD 圖表為主。
3、MACD 的背離訊號在這個指標裡是個別顯示的,因為MACD的背離判斷方式比較複雜,它需要判斷兩次快慢線交叉的高低點,跟其他指標只需要判斷高低點出現的值不太一樣,所以MACD背離在這個指標裡是單獨顯示的。
註:
雖然目前這個指標只有顯示七個指標的背離,但是未來我可能會加入更多指標的背離。如果你希望某個指標的背離訊號出現在這隻指標中,或是你想要某個功能但是目前這指標沒有提供,歡迎留言讓我知道。

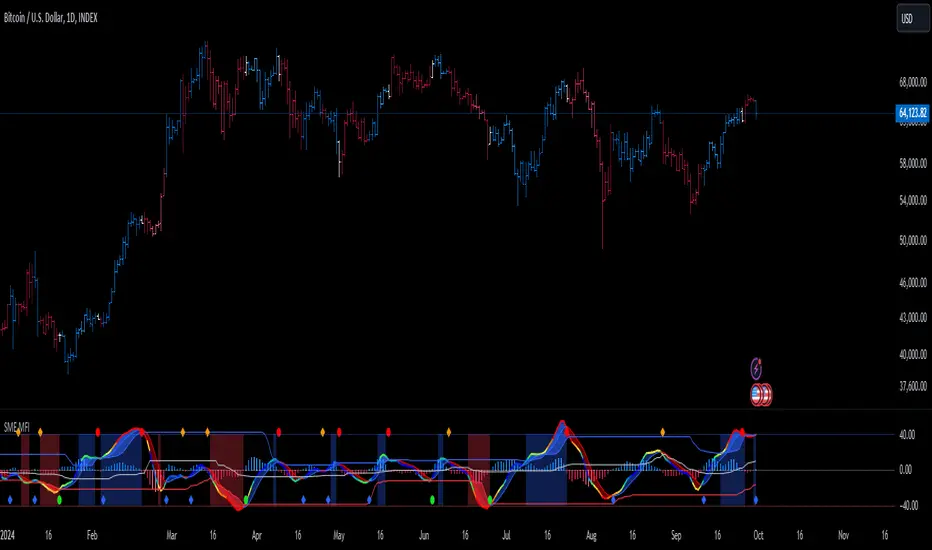
SMI Ergodic Indicator/Oscillator of Money Flow Index▮ Introduction
The Stochastic Momentum Index Ergodic (SMII) indicator is a technical analysis tool designed to predict trend reversals in the price of an asset.
It functions as a momentum oscillator, measuring the ratio of the smoothed price change to the smoothed absolute price change over a given number of previous periods.
The Ergodic SMI is based on the True Strength Index (TSI) and integrates a signal line, which is an exponential moving average (EMA) of the SMI indicator itself.
The Ergodic SMI oscillator provides a clearer picture of market trends than the traditional stochastic oscillator by incorporating the concept of 'ergodicity', which helps remove market noise.
On ther other hand, MFI (Money Flow Index) is a technical analysis indicator used to measure the inflow of money into an asset and thus help identify buying and selling pressure in a given financial instrument.
When these two indicators are combined, they can provide a more comprehensive view of price direction and market strength.
▮ Motivation: why another indicator?
By combining SMII with MFI, we can gain even more insights into the market.
One way to do this is to use the MFI as an input to the SMII, rather than just using price.
This means we are measuring momentum based on buying and selling pressure rather than just price.
Furthermore, there is the possibility of making several fine adjustments to both the calculation and visualization parameters that are not present in other indicators.
▮ What to look for
When using the SMII MFI indicator, there are a few things to look out for.
First, look at the SMII signal line.
When the line crosses above -40, it is considered a buy signal, while the crossing below +40 is considered a sell signal.
Also, pay attention to divergences between the SMII and the price.
If price is rising but the SMII is showing negative divergence, it could indicate that momentum is waning and a reversal could be in the offing.
Likewise, if price is falling but the SMII is showing positive divergence, this could indicate that momentum is building and a reversal could also be in the offing.
Divergences can be considered in both indicator and/or histogram.
Examples:
▮ Notes
The indicator presented here offers both the 'SMII' and the 'SMIO', that is, the 'Stochastic Momentum Index Ergodic Indicator' together with the 'Stochastic Momentum Index Ergodic Oscillator' (histogram), as per the documentation described in reference links.
So it is important to highlight the differences in relation to my other indicator, the 'Stochastic Momentum Index (SMI) of Money Flow Index (MFI)':
This last one is purely based on the SMI , which is implemented using SMA smoothing for the relative range and the high/low range.
Although they may seem the same in some situations, the calculation is actually different. The TSI tends to be more responsive at the expense of being noisier, while the SMI tends to be smoother. Which of these two indicators is best depends on the situation, the context, and the analyst's personal preference.
Please refer to reference links to more info.
▮ References
SMI documentation
SMII documentation
SMIO documentation
MFI documentation
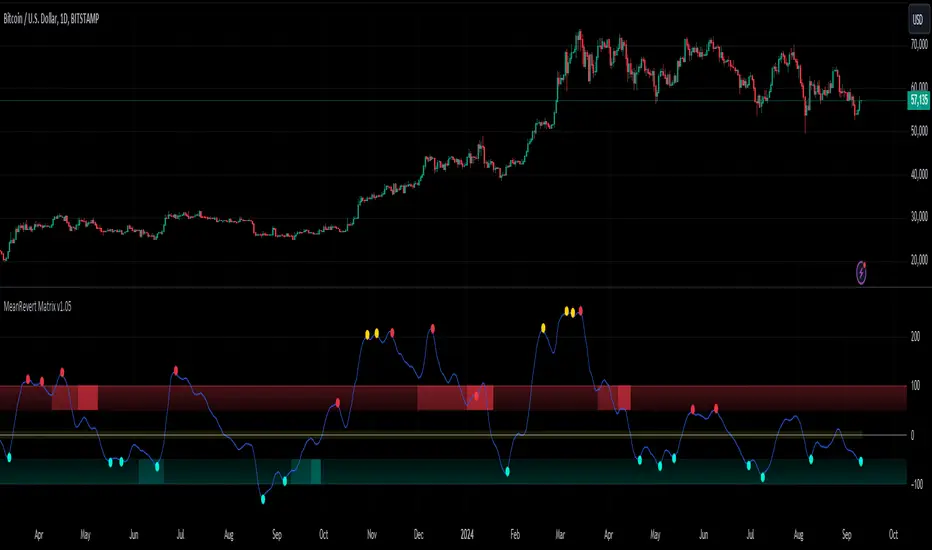
MeanRevert Matrix [StabTrading]MeanRevert Matrix is a sophisticated trading tool designed to detect when prices significantly deviate from their historical averages, signalling potential market trends and reversals.
Leveraging complex algorithms that incorporate human emotions and mean reversion theory, this indicator is the first stage in a comprehensive system for identifying market entry points. Its versatility allows it to be applied across all charts and timeframes, providing traders with clear visual cues for trend analysis and decision-making.
This indicator is purposefully straightforward, allowing traders to observe how the different algorithms work in confluence. The MeanRevert Matrix can be customized to fit individual trading styles, particularly in terms of aggressiveness, making it adaptable to various market conditions. Working in tandem with the FloWave Oscillator, it offers an additional layer of confluence, ensuring that trading signals are more reliable.
💡 Features
Reversal Zones - These zones are integral to the MeanRevert Matrix, highlighting areas where trader emotions and money flow suggest potential longer-term reversals. The lighter shaded zones indicate early-stage reversals, while darker shades signal stronger reversal potential. This feature is designed to help traders anticipate market shifts and prepare for them accordingly.
Localized Mean Reversion Signals - These signals are triggered when the price deviates significantly from the mean, unaffected by longer-term price movements. This localized algorithm helps traders focus on short-term market fluctuations without being influenced by broader trends.
Yellow Signals - These signals identify isolated overbought or oversold conditions. While they often indicate reversal points, they can also signal the beginning of accelerated buying or selling, giving traders early warning of potential market shifts.
Trading Style Customization - The MeanRevert Matrix allows traders to tailor their strategy by adjusting the indicator’s aggressiveness. A more aggressive setting will produce more frequent reversal signals, offering flexibility based on the trader’s risk tolerance and market outlook.
Noise Eliminator - This feature helps traders filter out market noise or manipulation by increasing the noise value. By removing unwanted or misleading signals, it ensures that traders are acting on the most reliable data.
📈 Implementing the System
Step 1 - Begin by observing the localized blue trend to identify reversal points below the mean. Green or red signals within this trend indicate that the price remains within the current market parameters, suggesting that a reversal may occur more quickly. Yellow signals, however, indicate that the trend is likely to continue, so it’s advisable to wait for clearer reversal zones to develop. To avoid misleading signals, consider using higher noise values.
Step 2 - Wait for the reversal zone algorithm to indicate a potential market reversal by showing either light or dark red/green colour. A lighter zone suggests that the overall trend is beginning to reverse, while a darker zone indicates a higher likelihood of reversal.
Step 3 - Once a reversal zone is identified, monitor the trend line for signals that the price is moving significantly away from the mean. This indicates a strong localized price movement that is poised for a reversal. At this stage, you can reduce the noise value and increase the aggressiveness of the trading style to capture more reversal signals.
🛠️ Usage/Practice
In the example above, the indicator is set with neutral aggression for buy signals and lower aggression for sell signals, reflecting the current bull market cycle
Red Reversal Zone - A bearish reversal zone emerges, followed by a darker bearish zone, indicating an increased probability of a trend reversal. The red signals show price reversion from the localized mean, but the absence of yellow signals suggests the reversion isn't abnormally aggressive, making this a good area to consider a short position.
Strong Reversal Opportunity - Similar to point 1, but this time a green signal appears within the bullish dark green zone, highlighting a strong reversal potential. Subsequent red signals suggest opportunities to take profits as the trend faces resistance.
Opportunity to Strengthen Long Position - Once again, the indicator shows a bullish reversal zone without yellow signals. This suggests an area of increased resistance at this price point, offering traders another chance to increase their long positions before the market enters the long bull cycle.
Excessive Buying Pressure - The price has deviated significantly from the mean, triggering a yellow signal. This indicates excessive buying pressure, suggesting the trend is likely to continue upward. Although not an immediate bearish area, the red sell signals suggest it could be a time to conservatively take partial profits.
Trend Weakening - As the trend slows down, bearish zones appear, indicating potential reversal points. As the market shows signs of losing upward momentum, this suggests an opportunity to reduce their long exposure or enter a short trade and take advantage of the correction in the bull cycle.
Potential for Additional Long Position - Despite the earlier sell signals, the overall uptrend remains strong. This presents an opportunity either to add to the long position or to take profits from a previous sell position. The strength of the upward trend suggests that the market may continue higher.
Abnormal Upward Momentum - Similar to points 4 and 5, the yellow signals indicate abnormal price action with aggressive upward momentum. As the trend corrects to a normal range, the price hitting a resistance level is confirmed by the appearance of red reversal zones, suggesting a potential pullback.
Sideways Market Signals - In a sideways market, the indicator shows signals that remain within the normal mean reversion range. These signals are not abnormal and suggest potential entry points for trades within a sideways market, indicating periods where the market lacks strong directional momentum.
🔶 Conclusion
With its seamless integration into various charts and timeframes, the MeanRevert Matrix stands as a reliable and adaptable tool, essential for navigating the complexities of modern markets. By following the implementation guidelines and leveraging its features, traders have the potential to effectively anticipate market movements and optimize their entry and exit points.
We developed this indicator to help traders enhance their understanding of market trends and achieve their trading objectives with greater precision.
FloWave Oscillator [StabTrading]The FloWave Oscillator is a powerful trading tool designed to identify market trends and reversals by analysing reversal zones based on momentum and fear algorithms.
Serving as the first stage in a comprehensive trading system, it is intentionally straightforward, allowing traders to clearly see potential entry points across all charts and timeframes.
By inputting their own market sentiment, traders can customize the algorithm to align with their trading style. This flexibility helps traders navigate complex market environments with greater precision, whether they are seeking to capitalize on short-term opportunities or ride longer-term trends.
💡 Features
Reversal Zones - The FloWave Oscillator identifies key reversal zones driven by momentum and fear dynamics. Lighter green zones signal the initial stages of a potential reversal, while darker green zones indicate that a trend flip is imminent.
Trading Style Customization - The indicator allows traders to adjust their trading style with sensitivity settings ranging from Very Aggressive to Very Conservative. This flexibility lets traders tailor the indicator to their preferred time horizon—whether they seek to scalp short-term opportunities or capture long-term reversals.
🔥 Sensitivity Settings
Very Aggressive/Aggressive - These settings increase the indicator's sensitivity, generating more frequent signals, ideal for traders focused on short-term gains or those navigating choppy markets.
Neutral - Offers a balanced approach, combining both aggressive and conservative elements. It's a starting point for traders to evaluate performance before adjusting to more specific styles.
Conservative/Very Conservative - These settings reduce signal frequency, focusing on stronger, more reliable reversals. Best suited for long-term traders aiming to minimize risk and avoid premature market entries or exits.
🛠️ Usage/Practice
In the above example we’ll analysis how the indicator accurately predicts both the tops and bottoms of a market cycle.
Top of the Bull Market - The trendline initially shows two light red reversal zones, signalling a potential weakening in the upward momentum. As the trend progresses, a dark red zone emerges, confirming that a more substantial trend reversal to the downside is likely. This sequence provides an early warning, allowing traders to prepare for a possible market shift.
First Bull Signal - In the following phase, the indicator mirrors the previous action but in the opposite direction, identifying a reversal towards the upside. This behaviour demonstrates the indicator's ability to adapt to changing market conditions.
Bottom of the Bear Market - As the market continues its downward trajectory, the indicator presents two dark green reversal zones, highlighting areas where the selling pressure may be easing. These dark green zones offer three distinct opportunities to dollar-cost average (DCA) into the asset, allowing traders to build or enhance their positions during the end of the bear cycle. The indicator’s sensitivity in this phase ensures that traders can navigate the bearish market with confidence.
Continuation of Bull Cycle - In this segment, the indicator does not display any dark green reversal zones, implying that the uptrend remains robust. The absence of these zones suggests that the upward momentum is likely to continue, providing traders with another opportunity to add to their long positions. This scenario underscores the indicator’s capacity to identify when a trend is strong enough to warrant additional investment.
Potential Correction in an Uptrend - A light red zone appears, signalling a possible correction within the ongoing uptrend. However, the absence of a dark red zone indicates that the correction may be minor and that the overall trend is still upward. Traders might view this as a conservative point to take some profits off the table, managing risk while staying aligned with the broader bull market.
Bearish Signal - Eventually, a dark red reversal zone emerges, indicating that the trend has lost its upward momentum. This signal serves as a strong indicator that the uptrend may be concluding, prompting traders to consider exiting their positions or taking a more defensive stance. As the market enters a sideways phase, the trader can switch to a more aggressive trading style, seeking opportunities to scalp within the range while navigating the flat market conditions.
In this example, we demonstrate how to identify scalp trading opportunities by combining the Very Conservative and Very Aggressive settings. The key strategy is to use the Very Conservative trend to confirm the validity of reversal zones identified by the Very Aggressive setting.
The VC trend doesn’t indicate a buy reversal zone, but it shows an upward divergence. This suggests that the reversal buy zone on the VA chart is a potential entry point due to the supportive VC trend.
Multiple sell zones appear on the VA chart, but the VC trend shows a strong and steady uptrend. This suggests that we should wait for confirmation from the VC trend before considering a sell position, as the market is still moving upward strongly.
The VA chart shows several buy zones, but the VC trend indicates a strong downtrend, and no buy zone appears on the conservative setting. This suggests waiting for the next VA buy zone, confirmed by an upward divergence on the VC trend, before entering a trade.
Similar to Point 3 but in the opposite direction, the VA chart shows sell zones, but the VC trend indicates caution. The strategy would be to wait for confirmation from the VC trend before making a move.
🔶Conclusion
When used in conjunction with other indicators like the MeanRevert Matrix, the FloWave Oscillator becomes an integral part of a comprehensive trading system. It helps traders make informed decisions by providing clear signals that are aligned with the current market sentiment and broader economic trends. By following the implementation guidelines and adjusting the indicator settings as market conditions change, traders can effectively enhance their trading performance.

DEMA Adaptive DMI [BackQuant]DEMA Adaptive DMI
PLEASE Read the following, knowing what an indicator does at its core before adding it into a system is pivotal. The core concepts can allow you to include it in a logical and sound manner.
Conceptual Foundation and Innovation
The DEMA Adaptive DMI blends the Double Exponential Moving Average (DEMA) with the Directional Movement Index (DMI) to offer a unique approach to trend-following. By applying DEMA to the high and low prices, this indicator refines the traditional DMI calculation, enhancing its responsiveness to price changes. This results in a more adaptive and timely measure of market trends and momentum, providing traders with a more refined tool for capturing directional movements in the market.
Technical Composition and Calculation
At its core, the DEMA Adaptive DMI calculates the DEMA for both the high and low prices over a user-defined period. This dual application of DEMA serves to smooth out price fluctuations while retaining sensitivity to market movements. The DMI is then derived from the changes in these DEMA values, producing a set of plus and minus directional indicators that reflect the prevailing trend. Additionally, an Average Directional Index (ADX) is computed to measure the strength of the trend, with the entire process being dynamically adjusted based on the DEMA calculations.
DEMA Application:
The DEMA is applied to both high and low prices to reduce lag and provide a smoother representation of price action.
Directional Movement Calculation: The DMI is calculated using the smoothed price changes, resulting in plus and minus indicators that accurately reflect market trends.
ADX Calculation:
The ADX is computed to quantify the strength of the trend, offering traders insight into whether the market is trending strongly or is in a phase of consolidation.
Features and User Inputs The DEMA Adaptive DMI offers a range of customizable options to suit different trading styles and market conditions:
DEMA Calculation Period: Users can set the period for the DEMA calculation, allowing for adjustments based on the desired sensitivity.
DMI Length: The length of the DMI calculation can be adjusted, providing flexibility in how trends are measured.
ADX Smoothing Period: The smoothing period for the ADX can be customized to fine-tune the trend strength measurement.
Divergence Detection: Optional divergence detection features allow traders to spot potential reversals based on the DMI and price action.
Visualization options include static high and low levels to mark extreme DMI thresholds, the ability to color bars according to trend direction, and background hues to highlight overbought and oversold conditions.
Practical Applications
The DEMA Adaptive DMI is particularly effective in markets where trend strength and direction are crucial for successful trading. Traders can leverage this indicator to:
Identify Trend Reversals:
Detect potential trend reversals by monitoring the DMI and ADX in conjunction with divergence signals.
Trend Confirmation:
Use the DEMA-based DMI to confirm the strength and direction of a trend, aiding in the timing of entries and exits.
Strategic Positioning:
The indicator's responsiveness allows traders to position themselves effectively in fast-moving markets, reducing the risk of late entries or exits.
Advantages and Strategic Value
By integrating the DEMA with the DMI, this indicator provides a more adaptive and timely measure of market trends. The reduced lag from the DEMA ensures that traders receive signals that are closely aligned with current market conditions, while the dynamic DMI calculation offers a more accurate representation of trend direction and strength. This makes the DEMA Adaptive DMI a valuable tool for traders looking to enhance their trend-following strategies with a focus on precision and adaptability.
Summary and Usage Tips
The DEMA Adaptive DMI is a sophisticated trend-following indicator that combines the benefits of DEMA and DMI into a single, powerful tool. Traders are encouraged to incorporate this indicator into their trading systems for a more nuanced and responsive approach to trend detection and confirmation. Whether used for identifying trend reversals, confirming trend strength, or strategically positioning in the market, the DEMA Adaptive DMI offers a versatile and reliable solution for trend-following strategies.
Thus following all of the key points here are some sample backtests on the 1D Chart
Disclaimer: Backtests are based off past results, and are not indicative of the future.
INDEX:BTCUSD
INDEX:ETHUSD
BINANCE:SOLUSD

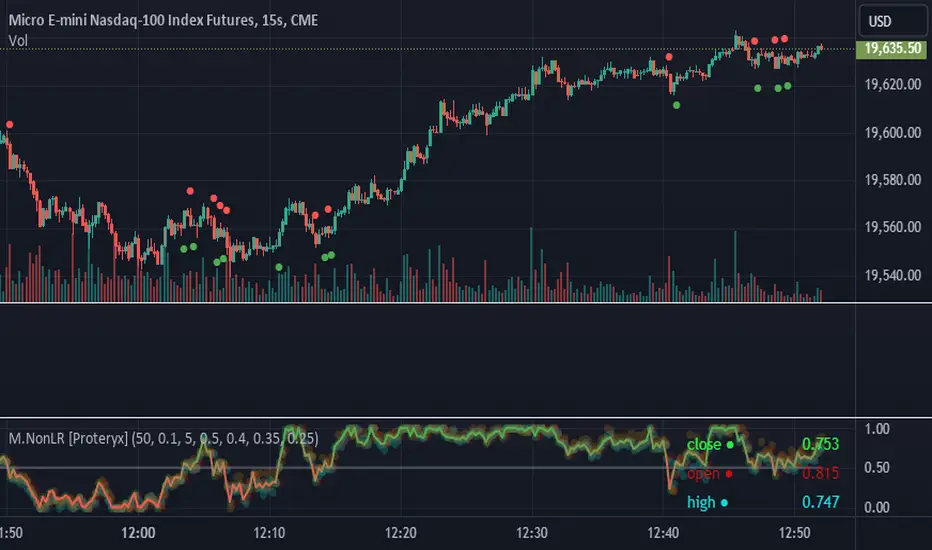
Multi-Non-Lin-Reg [Proteryx]This indicator is designed to perform multiple non-linear regression analysis using four independent variables: close, open, high, and low prices. Here's a breakdown of its components and functionalities:
Inputs:
Users can adjust several parameters:
Normalization Data Length: Length of data used for normalization.
Learning Rate: Rate at which the algorithm learns from errors.
Smooth?: Option to smooth the output.
Smooth Length: Length of smoothing if enabled.
Define start coefficients: Initial coefficients for the regression equation.
Data Normalization:
The script normalizes input data to a range between 0 and 1 using the highest and lowest values within a specified length.
Non-linear Regression:
It calculates the regression equation using the input coefficients and normalized data. The equation used is a weighted sum of the independent variables, with coefficients adjusted iteratively using gradient descent to minimize errors.
Error Calculation:
The script computes the error between the actual and predicted values.
Gradient Descent: The coefficients are updated iteratively using gradient descent to minimize the error.
Visualization:
Plotting of normalized input data (close, open, high, low).
The indicator provides visualization of normalized data values (close, open, high, low) in the form of circular markers on the chart, allowing users to easily observe the relative positions of these values in relation to each other and the regression line.
Plotting of the regression line.
Color gradient on the regression line based on its value and bar colors.
Display of normalized input data and predicted value in a table.
Signals for crossovers with a midline (0.5).
Interpretation:
Users can interpret the regression line and its crossovers with the midline (0.5) as signals for potential buy or sell opportunities.
This indicator helps users analyze the relationship between multiple variables and make trading decisions based on the regression analysis. Adjusting the coefficients and parameters can fine-tune the model's performance according to specific market conditions.
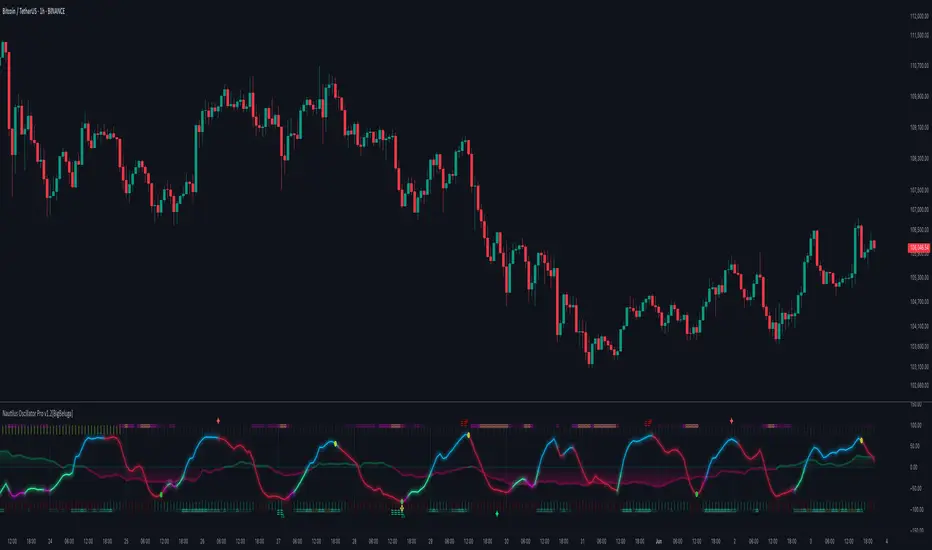
Nautilus Oscillator [BigBeluga]NAUTILUS OSCILLATOR
The Nautilus Oscillator by BigBeluga is an advanced technical analysis tool designed to help traders identify trend direction, strength, and potential reversal points in the market. This versatile indicator combines multiple analytical elements to provide a comprehensive view of market conditions.
Why It’s Unique:
The Nautilus Oscillator is unique too, its blend of multiple technical analysis tools into a single, coherent indicator.
By smoothing with a unique and highly valued in signal processing filter, and incorporating dynamic thresholds, this oscillator offers a more refined and adaptable approach to identifying trading signals.
The filter is designed to have as flat a frequency response as possible in the passband. This means that within the range of frequencies it allows through, minimizes distortion and maintains the true shape of the signal more accurately than many other types of filters.
The addition of a trend filter and divergence detection further enhances its capability, making it a versatile tool for both trend-following and reversal strategies. The built-in dashboard and clean chart management features provide traders with a streamlined, informative, and visually appealing trading experience. This makes the Nautilus Oscillator not just a tool for analysis but a comprehensive trading system in itself.
🔵 KEY FEATURES
● Main Oscillator Line
Smoothly transitions between bullish (green) and bearish (purple) colors
Helps visualize mean-reversion, market trend, and momentum
● Histogram
Displayed below the main oscillator line
Represents the rate of change of the main oscillator
Acts as a leading indicator, often showing changes faster than the main oscillator line
Can be viewed as a predictive element, potentially indicating future movements of the main oscillator
Histogram crossover signals (small dots) can indicate short-term momentum shifts
Useful for early detection of potential trend changes or momentum shifts
● Confluence Arrows
Arrows displayed above and below the oscillator
Provide additional confluence signals that work in conjunction with the histogram
Act as supplementary indicators to confirm the main oscillator signals
Help in identifying stronger, more reliable trading opportunities when aligned with other indicator elements
● Trend Filter
Displayed as horizontal lines above and below the oscillator
Upper lines (above the oscillator): Indicate an uptrend
Lower lines (below the oscillator): Indicate a downtrend
Three lines appear when a strong trend is present
Only one line is displayed when there's no trend
Color-coded for easy identification (typically green for up, purple for down)
Color intensity indicates the strength of the trend. More intensive color indicates stronger trend
Provides a clear visual representation of the overall market trend
Helps traders align their strategies with the broader market direction
● Overbought/Oversold Thresholds
Can be set to static levels or dynamically adjust based on market volatility
Helps identify potential reversal points in the market
● Signals
Strong signals: Displayed as circles on both the oscillator and main chart (optional)
Simple signals: Shown as X marks on both the oscillator and main chart (optional)
Histogram crossover signals: Small dots on the histogram
● Stop Levels
Optional feature that plots potential stop-loss levels for strong signals
Based on the Market volatility for adaptability to different market conditions
● Divergences
Identifies and displays bullish and bearish divergences between price and the oscillator
Helps spot potential trend reversals
● Dashboard
Provides at-a-glance information about current market conditions
Displays trend direction, last signal, histogram direction, threshold mode, and divergence status
🔵 HOW TO USE
● Trend Identification
Use the main oscillator line color and position, along with the trend filter lines, to determine the overall market trend
● Entry Signals
Strong signals (circles) suggest potential entry points in the direction of the trend
Simple signals (X marks) can be used for more frequent, but potentially less reliable, entry opportunities
Histogram crossover signals (dots) can indicate changes faster than the main oscillator line
Look for alignment with confluence arrows for stronger entry signals
● Exit Signals
Use the overbought/oversold thresholds as potential enter and exit points
Stop levels (if enabled) provide dynamic exit points for risk management
● Reversal Identification
Watch for divergences between price and the oscillator for potential trend reversals
Pay attention to the histogram direction for early signs of momentum shifts
Notice changes in the trend filter lines (from three lines to one, or vice versa)
● Confirmation
Use the dashboard to quickly confirm the current market state and indicator readings
Combine signals from different elements (main line, histogram, trend filter, confluence arrows) for stronger confirmation
🔵 CUSTOMIZATION
The Nautilus Oscillator offers several customization options to suit different trading styles:
Adjust the main oscillator length
Set static or dynamic overbought/oversold thresholds
Enable/disable and customize stop levels
Toggle divergence display and adjust its parameters
Show/hide the information dashboard
Display simple signals on the main chart
By fine-tuning these settings, traders can adapt the Nautilus Oscillator to various market conditions and personal trading strategies.
The Nautilus Oscillator provides a multi-faceted approach to market analysis, combining trend identification, momentum assessment, and reversal detection in one comprehensive tool. Its visual cues and customizable features make it suitable for both novice and experienced traders across various timeframes and markets. The integration of multiple analytical elements – including the predictive histogram, confluence arrows, and adaptive trend filter – offers traders a rich set of data points to inform their trading decisions.
Bezahltes Script
Prime Oscillators Pro + [ChartPrime]Prime Oscillators Pro Plus
The Prime Oscillator is a powerful technical analysis tool designed to provide traders with a multi-faceted view of market trends and potential price movements. By integrating several key components, each with unique analytical capabilities, the Prime Oscillator offers a robust mechanism for evaluating market conditions, predicting trends, and identifying potential trading opportunities. Here's a detailed breakdown of why each component is unique and brings varying approaches into market analysis:
Money Flow Tracker
The Money Flow Tracker measures the flow of money into and out of a security over a specific period of time. It combines both price and volume data to provide insights into the buying and selling pressure of an asset. Employing low lag filtering methods; this confluence of readings allows for in theory; a more reliable oscillator.
This feature allows for:
Early Trend Detection: By highlighting periods of positive (green) and negative (red) volume, traders can anticipate shifts in market sentiment before they become apparent in price action.
Volume Matrix
The lower volume oscillator shows whether money is flowing into or out of the market. Green suggests uptrend and buyers are in control whereas red represents a majority of sellers. By incorporating smoothed volume analysis, it distinguishes between bullish and bearish volumes, providing an early indication of potential trend reversals.
Top and Bottom Power Bars
These lines represent confirmation of trends based on the convergence of seven different conditions, with brightness indicating the strength of the trend. Brighter lines suggest strong trends, while dimmer lines indicate weaker trends.
Trend Strength Identification; By visually representing the strength of a trend, traders can gauge the confidence of the market in a particular direction.
Overbought/Oversold Conditions: Bright lines in overbought or oversold zones signal potential reversal points, helping traders avoid entering positions at extreme highs or lows.
Volume-Inspired Signals
The volume inspired signals inspired signals are used to determine overbought and oversold conditions, adding another layer of analysis to the oscillator.
Price Fairness Assessment: The signals help traders assess whether the current price is above or below the average price, adjusted for volume, indicating potential reversal zones.
Improved Timing: By using these signals, traders can improve the timing of their entries and exits, ensuring they are aligned with the broader market consensus.
The True 7
The middle ranking system evaluates the strength of a move and the overall trend, offering a numeric or visual representation of trend strength. It can also indicate when a trend is starting to reverse, providing leading signals for potential market shifts. This allows for traders to understand how strong the trend is and their trade and also forecast potential reversals in market activity. For example if a trader were in a long position and the ranking system starts to show a weakening trend the trader may want to exit their position. This is a unique piece of confluence lacking in other tools where market performance is boiled down to a rank rather than value.
Reversal signals: These are in essence a contrarian signal predicting the reversal of the market and the oscillator.
The Peak Seekers are blue dots that analyze multiple indicators to deduce more accurately and confluence within divergences. Settings here are auto optimized depending on the user selected timeframe.
Main Oscillator
The main oscillator is designed to be a low lag identifier of market moves. Using low lag smoothing approaches, a green and red color further indicates a trend. This is fantastic when used in confluence with other features in this toolkit.
This system quantifies the strength of a trend, helping traders understand the market's momentum and the potential sustainability of a move.
MVP Oscillator
The second mode in this toolkit; the MVP Oscillator analyses volume at a deeper level.
The Main Ribbon
This oscillator analyses market trends and produces a blue and purple ribbon. A blue ribbon suggests the market is moving upwards and a purple ribbon suggests the market is moving downwards. This plot can be used classically and a user can easily use this for divergence identification. In this mode however divergences are not the main feature and would need to be manually identified.
Ranging between -100 and 100; this oscillator, when below 0, suggests the market is bearish and moving downwards. When above 0 the market is in a bullish state. Looking for confluence here is key. For example if the oscillator is below 0 and we see purple appearing on the ribbon; this could be a stronger sign the market will continue to move downwards. However; if it's below 0 and the oscillator turns blue; this could indicate indecision in the market.
The Green Bars
The main other component on the MVP oscillator are the overextended green bars that appear when a market reversal is due.
Green bars suggesting the market will soon reverse
When the green bars appear the user can infer that the market may bounce around this region making it once again excellent when used in confluence with other tools from ChartPrime. Looking for these bars can indicate when a trader might want to be looking for some dynamic positions. Consider these a warning sign.
Signals
The MVP oscillator also has signals. These appear when the oscillator becomes overextended and displays arrows. These can serve as classical buy or sell signals when used in confluence with other indicators.
Looking for confluence with these signals can be a powerful idea. For example; in the image above we see a buy signal with green bars. This suggests the market is due a reversal and that reversal will most likely be a bullish one.
Summary
The Prime Oscillator combines these components to create a powerful and comprehensive tool for technical analysis. Each element plays a crucial role in offering a nuanced view of the market, from early trend detection and volume confirmation to trend strength measurement and overbought/oversold signals. By using the Prime Oscillator, traders can gain a deeper understanding of market dynamics, make more informed trading decisions, and enhance their overall trading strategy.
Bezahltes Script

Market Cipher B by WeloTradesMarket Cipher B by WeloTrades: Detailed Script Description
//Overview//
"Market Cipher B by WeloTrades" is an advanced trading tool that combines multiple technical indicators to provide a comprehensive market analysis framework. By integrating WaveTrend, RSI, and MoneyFlow indicators, this script helps traders to better identify market trends, potential reversals, and trading opportunities. The script is designed to offer a holistic view of the market by combining the strengths of these individual indicators.
//Key Features and Originality//
WaveTrend Analysis:
WaveTrend Channel (WT1 and WT2): The core of this script is the WaveTrend indicator, which uses the smoothed average of typical price to identify overbought and oversold conditions. WT1 and WT2 are calculated to track market momentum and cyclical price movements.
Major Divergences (🐮/🐻): The script detects and highlights major bullish and bearish divergences automatically, providing traders with visual cues for potential reversals. This helps in making informed decisions based on divergence patterns.
Relative Strength Index (RSI):
RSI Levels: RSI is used to measure the speed and change of price movements, with specific levels indicating overbought and oversold conditions.
Customizable Levels: Users can configure the overbought and oversold thresholds, allowing for a tailored analysis based on individual trading strategies.
MoneyFlow Indicator:
Fast and Slow MoneyFlow: This indicator tracks the flow of capital into and out of the market, offering insights into the underlying market strength. It includes configurable periods and multipliers for both fast and slow MoneyFlow.
Vertical Positioning: The script allows users to adjust the vertical position of MoneyFlow plots to maintain a clear and uncluttered chart.
Stochastic RSI:
Stochastic RSI Levels: This combines the RSI and Stochastic indicators to provide a momentum oscillator that is sensitive to price changes. It is used to identify overbought and oversold conditions within a specified period.
Customizable Levels: Traders can set specific levels for more precise analysis.
//How It Works//
The script integrates these indicators through advanced algorithms, creating a synergistic effect that enhances market analysis. Here’s a detailed explanation of the underlying concepts and calculations:
WaveTrend Indicator:
Calculation: WaveTrend is based on the typical price (average of high, low, and close) smoothed over a specified channel length. WT1 and WT2 are derived from this typical price and further smoothed using the Average Channel Length. The difference between WT1 and WT2 indicates momentum, helping to identify cyclical market trends.
RSI (Relative Strength Index):
Calculation: RSI calculates the average gains and losses over a specified period to measure the speed and change of price movements. It oscillates between 0 and 100, with levels set to identify overbought (>70) and oversold (<30) conditions.
MoneyFlow Indicator:
Calculation: MoneyFlow is derived by multiplying price changes by volume and smoothing the results over specified periods. Fast MoneyFlow reacts quickly to price changes, while Slow MoneyFlow offers a broader view of capital movement trends.
Stochastic RSI:
Calculation: Stochastic RSI is computed by applying the Stochastic formula to RSI values, which highlights the RSI’s relative position within its range over a given period. This helps in identifying momentum shifts more precisely.
//How to Use the Script//
Display Settings:
Users can enable or disable various components like WaveTrend OB & OS levels, MoneyFlow plots, and divergence alerts through checkboxes.
Example: Turn on "Show Major Divergence" to see major bullish and bearish divergence signals directly on the chart.
Adjust Channel Settings:
Customize the data source, channel length, and smoothing periods in the "WaveTrend Channel SETTINGS" group.
Example: Set the "Channel Length" to 10 for a more responsive WaveTrend line or adjust the "Average Channel Length" to 21 for smoother trends.
Set Overbought & Oversold Levels:
Configure levels for WaveTrend, RSI, and Stochastic RSI in their respective settings groups.
Example: Set the WaveTrend Overbought Level to 60 and Oversold Level to -60 to define critical thresholds.
Money Flow Settings:
Adjust the periods and multipliers for Fast and Slow MoneyFlow indicators, and set their vertical positions for better visualization.
Example: Set the Fast Money Flow Period to 9 and Slow Money Flow Period to 12 to capture both short-term and long-term capital movements.
//Justification for Combining Indicators//
Enhanced Market Analysis:
Combining WaveTrend, RSI, and MoneyFlow provides a more comprehensive view of market conditions. Each indicator brings a unique perspective, making the analysis more robust.
WaveTrend identifies cyclical trends, RSI measures momentum, and MoneyFlow tracks capital movement. Together, they provide a multi-dimensional analysis of the market.
Improved Decision-Making:
By integrating these indicators, the script helps traders make more informed decisions. For example, a bullish divergence detected by WaveTrend might be validated by an RSI moving out of oversold territory and supported by increasing MoneyFlow.
Customization and Flexibility:
The script offers extensive customization options, allowing traders to tailor it to their specific needs and strategies. This flexibility makes it suitable for different trading styles and timeframes.
//Conclusion//
The indicator stands out due to its innovative combination of WaveTrend, RSI, and MoneyFlow indicators, offering a well-rounded tool for market analysis. By understanding how each component works and how they complement each other, traders can leverage this script to enhance their market analysis and trading strategies, making more informed and confident decisions.
Remember to always backtest the indicator first before implying it to your strategy.

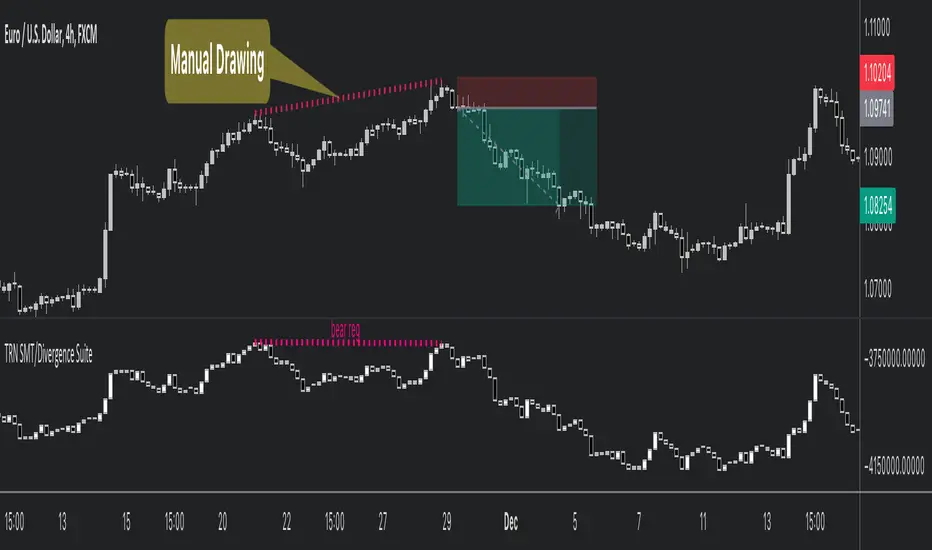
SMT/Divergence Suite (any Indicator)Hello Traders!
The TRN SMT/Divergence Suite detects divergences for any given indicator, even custom ones and divergences any two given instruments (SMT – smart money technique/tool). The indicator finds with unrivaled precision bullish and bearish as well as regular and hidden divergences. The main difference compared to other SMT/divergences indicators is that this indicator finds rigorously the extreme peaks of each swing, both in price and in the corresponding indicator/instrument. This precision is unmatched and therefore this is one of the best SMT/divergences detectors. The indicator helps traders to identify potential changes in trend before they occur.
Feature List
Works with any given custom oscillators or indicator
SMT (Smart Money Technique)/Divergence detecting for any given instruments
11 different build-in oscillators (incl. Cumulative Delta)
Customizable look and feel
The TRN SMT/Divergence Suite works with any given indicator, even custom ones. In addition, there are 11 built-in indicators. We have chosen a selection of different momentum, trend following and volume oscillators that gives you maximum flexibility. Most noticeable is the cumulative delta indicator, which works astonishingly well as a divergence indicator.
Following is the full list of the build in indicators/oscillators:
Awesome Oscillator (AO)
Commodity Channel Index (CCI)
Cumulative Delta Volume (CDV)
Chaikin Money Flow (CMF)
Moving Average Convergence Divergence (MACD)
Money Flow Index (MFI)
Momentum
On Balance Volume (OBV)
Relative Strength Index (RSI)
Stochastic
Williams Percentage Range (W%R)
The divergences are colored with vivid lines and labels. Bullish divergences are distinguished with luminous blue lines, while bearish divergences are denoted by striking red lines. Upon detecting a divergence, the colored lines act as a visual indicator for traders, signaling an imminent possibility of a trend reversal. In response, traders can leverage this valuable insight to make informed decisions in their trading activities.
Choose Your Custom Divergence Indicator
Handpick your custom indicator, and the TRN SMT/Divergence Suite will hunt for divergences in your preferred market and timeframe. Importantly, you must add the indicator to your chart. Afterwards, simply go to the “Parameters” section in the indicator settings and choose "External Indicator/SMT". If the custom indicator has one reference value, then choose this value in the “External Indicator/SMT (High)” field. If there are high and low values (e.g. candles), then you also must set the “External Indicator Low/SMT” field.
In the provided graphic, we've chosen the stochastic RSI as our example, and as you can see, the TRN SMT/Divergence Suite instantly identifies and plots bullish and bearish divergences on your chart.
Make sure that the TRN SMT/Divergence Suite is in the same panel as the custom divergence indicator and that both indicators are pinned to the same scale of your chart.
Smart Money Technique (SMT)/Divergence detecting in Relation to other Instruments
Smart Money Technique/Tool (SMT) means the divergence detection between two related instruments. The TRN SMT/Divergence Suite finds divergences in relation to other instruments, e.g. NQ vs. ES or BTCUSDT vs. ETHUSDT. Just add another instrument to the chart. As representation style you can choose lines or candles/bars. Afterwards, simply go to the “Parameters” section in the indicator settings and choose "External Indicator/SMT". If the second instrument is represented as line, then choose this value in the “External Indicator/SMT (High)” field. If there are high and low values (e.g. candles/bars), then you also must set the “External Indicator/SMT Low” field.
The detection of SMTs can help traders to decide whether the trend continues, or a reversal is imminent. E.g. if the NQ makes a new higher high but the ES fails to do so and makes a new lower high, then the TRN SMT/Divergence Suite shows a divergence. As a result, the probability is high that the trend will not continue, and the trader can make an informed decision about what to do next.
How to set Parameters for Divergence Indicators
To begin, access the indicator settings. Look for the "Parameters" section where you can fine-tune Parameters 1-3. The default settings are already optimized for the oscillators AO, RSI, CDV, W%R, MFI and Stochastic. For other divergence indicators, you might want to adjust the settings to your liking. The parameter order is the same as in the corresponding divergence indicator.
What are Divergences?
When the price of an asset moves in one direction, but its indicators move in the opposite direction, this is called a divergence. Divergences can be a powerful signal that a trend reversal is about to occur.
There are two types of regular divergences: bullish and bearish. A bullish divergence occurs when the price of an asset makes a lower low, but its indicators make a higher low. This can be a sign that the asset is oversold and that a reversal is imminent. A bearish divergence, on the other hand, occurs when the price of an asset makes a higher high, but its indicators (such as Relative Strength Index - RSI) make a lower high. This can be a sign that the asset is overbought and that a reversal is imminent.
Next to regular divergences there are hidden divergences. These divergences occur when the price of an asset moves in the opposite direction of an indicator, suggesting a possible shift in the underlying trend. In trading, hidden bearish and hidden bullish divergences are patterns that traders often look for on price charts to identify potential trend reversals or continuation patterns.
Conclusion
While signals from TRN SMT/Divergence Suite can be informative, it is important to recognize that their reliability may vary. Bearish and bullish divergences are not foolproof indicators and should be used in conjunction with other analysis techniques and risk management strategies.
Risk Disclaimer
The content, tools, scripts, articles, and educational resources offered by TRN Trading are intended solely for informational and educational purposes. Remember, past performance does not ensure future outcomes.
MACD 4C with DivergenceMACD 4C Indicator with Divergence
This indicator, named MACD 4C, enhances the traditional MACD (Moving Average Convergence Divergence) by providing a visually intuitive representation with four distinct colors for the histogram bars. It offers a clear interpretation of market momentum and potential trend reversals.
Key Features:
Customizable Parameters: Users can adjust the fast and slow moving average periods along with the signal smoothing parameter to tailor the indicator to their preferred trading style and market conditions.
Four-color Histogram: The histogram bars are color-coded for easy interpretation. Lime and green bars indicate increasing bullish momentum, while maroon and red bars signify increasing bearish momentum.
Bullish and Bearish Divergence Detection: The indicator identifies bullish and bearish divergences between the MACD histogram and price action. Bullish divergence occurs when the price makes a lower low while the MACD histogram forms a higher low, indicating potential bullish reversal. Conversely, bearish divergence occurs when the price makes a higher high while the MACD histogram forms a lower high, suggesting a potential bearish reversal.
How to Use:
Trend Confirmation: Monitor the color of the histogram bars. A series of green (or lime) bars suggests a strengthening bullish trend, while a series of red (or maroon) bars indicates a strengthening bearish trend.
Divergence Identification: Watch for divergences between the MACD histogram and price action. Bullish divergence may signal a potential bullish reversal, while bearish divergence may indicate a potential bearish reversal. These signals can be used in conjunction with other technical analysis tools to confirm trade entries and exits.
The MACD 4C indicator was developed by user vkno422 You can find the original author and their work on their TradingView profile: www.tradingview.com

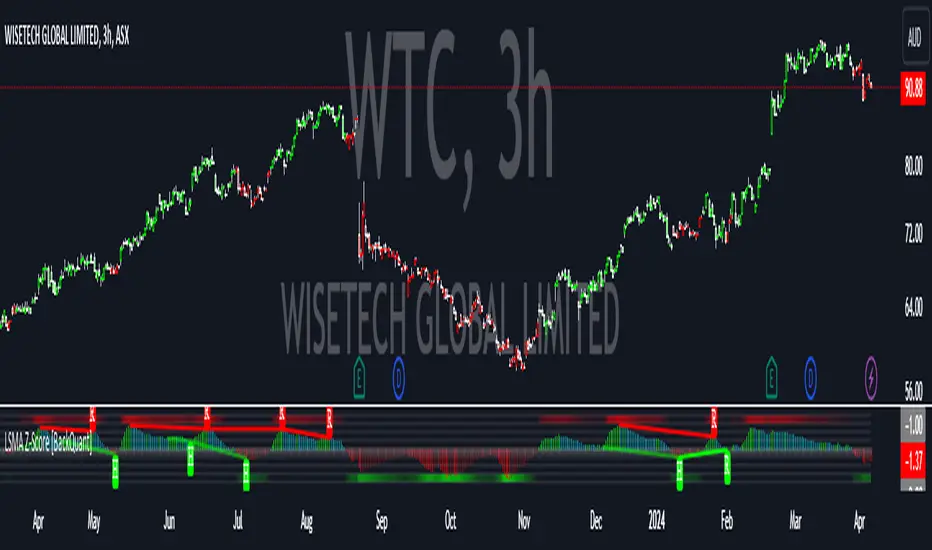
LSMA Z-Score [BackQuant]LSMA Z-Score
Main Features and Use in the Trading Strategy
- The indicator normalizes the LSMA into a detrended Z-Score, creating an oscillator with standard deviation levels to indicate trend strength.
- Adaptive coloring highlights the rate of change and potential reversals, with different colors for positive and negative changes above and below the midline.
- Extreme levels with adaptive coloring indicate the probability of a reversion, providing strategic entry or exit points.
- Alert conditions for crossing the midline or significant shifts in trend direction enhance its utility within a trading strategy.
1. What is an LSMA?
The Least Squares Moving Average (LSMA) is a technical indicator that smoothens price data to help identify trends. It uses the least squares regression method to fit a straight line through the selected price points over a specified period. This approach minimizes the sum of the squares of the distances between the line and the price points, providing a more statistically grounded moving average that can adapt more smoothly to price changes.
2. What is a Z-Score?
A Z-Score is a statistical measurement that describes a value's relationship to the mean of a group of values, measured in terms of standard deviations from the mean. If a Z-Score is 0, it indicates that the data point's score is identical to the mean score. A Z-Score helps in understanding if a data point is typical for a given data set or if it is atypical. In finance, a Z-Score is often used to measure how far a piece of data is from the average of a set, which can be helpful in identifying outliers or unusual data points.
3. Why Turning LSMA into a Z-Score is Innovative and Its Benefits
Converting LSMA into a Z-Score is innovative because it combines the trend identification capabilities of the LSMA with the statistical significance testing of Z-Scores. This transformation normalizes the LSMA, creating a detrended oscillator that oscillates around a mean (zero line), with standard deviation levels to show trend strength. This method offers several benefits:
Enhanced Trend Detection:
- By normalizing the LSMA, traders can more easily identify when the price is deviating significantly from its trend, which can signal potential trading opportunities.
Standardization:
- The Z-Score transformation allows for comparisons across different assets or time frames, as the score is standardized.
Objective Measurement of Trend Strength:
- The use of standard deviation levels provides an objective measure of trend strength and volatility.
4. How It Can Be Used in the Context of a Trading System
This indicator can serve as a versatile tool within a trading system for a range of things:
Trend Confirmation:
- A positive Z-Score can confirm an uptrend, while a negative Z-Score can confirm a downtrend, providing traders with signals to enter or exit trades.
Oversold/Overbought Conditions:
- Extreme Z-Score levels can indicate overbought or oversold conditions, suggesting potential reversals or pullbacks.
Volatility Assessment:
- The standard deviation levels can help traders assess market volatility, with wider bands indicating higher volatility.
5. How It Can Be Used for Trend Following
For trend following strategies, this indicator can be particularly useful:
Trend Strength Indicator:
- By monitoring the Z-Score's distance from zero, traders can gauge the strength of the current trend, with larger absolute values indicating stronger trends.
Directional Bias:
- Positive Z-Scores can be used to establish a bullish bias, while negative Z-Scores can establish a bearish bias, guiding trend following entries and exits.
Color-Coding for Trend Changes :
- The adaptive coloring of the indicator based on the rate of change and extreme levels provides visual cues for potential trend reversals or continuations.
Thus following all of the key points here are some sample backtests on the 1D Chart
Disclaimer: Backtests are based off past results, and are not indicative of the future.
This is using the Midline Crossover:
INDEX:BTCUSD
INDEX:ETHUSD
BINANCE:SOLUSD
Momentum Concepts [AlgoAlpha]🚀 Introducing the Momentum Concepts™ , a robust multi-layered momentum analysis tool developed by AlgoAlpha . This All-in-One indicator offers a comprehensive approach to understanding market momentum, empowering traders with hyper customizable features to tailor their analysis to their specific trading strategies.
Designed with efficiency and compactness in mind, the script shows momentum regimes on three time horizons: The short-term ( Fast Oscillator ), medium-term ( Scalper's Momentum ) and long-term ( Momentum Impulse Oscillator and Hidden Liquidity Flow ). Additionally, the script also includes reversal signals for traders who prefer to trade contrarian/mean-reversion strategies. By utilizing a blend of advanced algorithms and customizable parameters, Momentum Concepts™ provides traders with a vast array of trading strategies ranging from high frequency scalping to timing better entries on long-term swing and investing positions.
Let's delve into the key features and functionalities of this versatile indicator:
🎯Key Features (summary):
Customizable Fast Oscillator: Tailor the fast oscillator to your preferences with adjustable settings for type, source, trend identification(signal processing) method, length, and more.
Divergence Detection: Identify potential trend reversals with ease using built-in divergence detection for both bullish and bearish signals.
Momentum Impulse Oscillator: Gain deeper insights into trending/ranging markets and underlying market bias with a dedicated oscillator, featuring adjustable trend impulse thresholds.
Scalper's Momentum: Utilize a specialized momentum indicator designed for scalping strategies, featuring agility in signal detection with noise reduction and customizable smoothing parameters.
Hidden Liquidity Flow Analysis: Assess hidden liquidity flows within the market, highlighting excess liquidity and potential squeeze situations.
Trend Confluence Indicator: Evaluate the overall momentum direction with dynamically colored zones, aggregating signals from Momentum Concepts™ components for a holistic view.
User-Friendly Interface: The indicator is presented in a clear and intuitive manner, making it accessible for traders of all experience levels.
All-Rounded Alerts: The indicator comes with a comprehensive alerts extension in a separate script, allowing you to stay informed of important market movements even when away from your trading platform.
🎯Key Features (in-depth):
The Fast Oscillator within Momentum Concepts™ comprises four components designed to provide insights into short-term momentum dynamics:
🔱Price Volume Swings :
This confirmation component uses our proprietary Price Volume Algorithm to analyze price action and volume to identify buying and selling pressure, aiding traders in spotting short-term swings for potential trading opportunities.
⚜️Price Volume Waves :
This leading component also uses our proprietary Price Volume Algorithm but differs from the Price Volume Swings by capturing dominant wave patterns instead. This indicator breaks down price and volume data into a wave-like plot which enables leading insights into market momentum due to the relatively predicable nature of sine-like waves. Leading components such as this and the Alpha Wave are best used with other confirmation components within the Momentum Concepts™ .
🌊Alpha Wave :
The Alpha Wave is a leading non-volume alternative to the Price Volume Waves . It reflects market momentum by analyzing price action only instead of using volume data, resulting in a normalized wave-like plot similar to that of the Price Volume Waves , offering a leading perspective on potential market momentum shifts. Leading components such as this and the Price Volume Waves are best used with other confirmation components within the Momentum Concepts™ .
🐲Dragon RSI :
The Dragon RSI is a confirmation component that determines market momentum by analyzing the directional movement of the Relative Strength Index (RSI). By doing so, users are able to visually identify the current short term trend of the market as well as identify overbought and oversold conditions.
Reversal Signals :
All the Fast Oscillator components come with reversal signals that are based on the respective components being either oversold or overbought.
Divergences :
All the Fast Oscillator components come with bullish and bearish divergences. Divergences within the Fast Oscillator components of Momentum Concepts ™ offer crucial signals for trend shifts. 🔱 Price Volume Swings and ⚜️ Price Volume Waves detect weakening buying or selling pressure, signalling potential reversals or continuations. 🌊 Alpha Wave and 🐲 Dragon RSI identify divergences between momentum and price, aiding traders in anticipating market movements. Leveraging these divergences enhances analysis, aiding traders in formulating meaningful analysis.
Customizable Signal Processing Methods :
All the Fast Oscillator components come with customizable signal processing methods to identify trends on the Fast Oscillator , they include (but not limited to) methods such as Heiken Ashi, and a vast selection of Moving Averages.
Diminishing Momentum Warning :
All the Fast Oscillator components come with a diminishing momentum warning that represents a reducing momentum on the Fast Oscillator . This can act as a take profit signal or as a precautionary warning that the price is about to change direction soon even though the Fast Oscillator has not detected it yet.
Dynamically Colored Reversal Zones :
Last but not least, the dynamic coloring of the reversal zones for Fast Oscillator can be customised based on either the reversal probability of the Fast Oscillator or based on the overall trend confluence of all the components within the Momentum Concepts™ indicator.
The Momentum Impulse Oscillator in Momentum Concepts™ offers crucial insights into long-term momentum trends, aiding traders in identifying the underlying momentum regime and differentiating between trending and consolidating markets.
Underlying Momentum Bias
By default, the Momentum Impulse Oscillator is set to show the longer term trend of price action, this can be used to set the directional bias for the markets and prevent users from trading against the trend.
Trending/Ranging Detection
The Momentum Impulse Oscillator comes with the option to enable trending thresholds, when the Momentum Impulse Oscillator is beyond these thresholds, it indicates a trending market, when Momentum Impulse Oscillator is within the thresholds, it indicates a consolidating/ranging market.
The Scalper's Momentum within Momentum Concepts™ furnishes traders with nuanced signals ideal for short to medium-term trading strategies. It efficiently displays both the medium-term momentum and any emerging divergences towards the opposing direction.
Medium-Term Momentum
The Scalper's Momentum is designed to fill the analysis gap between the Fast Oscillator and the Momentum Impulse Oscillator . Showing momentum insights over the medium-term.
Momentum Convergence-Divergence
The Scalper's Momentum is also capable of showing momentum convergences and divergences, which can be used as take-profit and/or confirmation signals to other components within Momentum Concepts™ .
The Hidden Liquidity Flow component of Momentum Concepts™ is designed to uncover underlying liquidity dynamics. This feature enables traders to anticipate potential price movements based on changes in liquidity flow, enhancing their ability to make informed trading decisions.
Underlying Liquidity Dynamics
The Hidden Liquidity Flow shows the underlying liquidity flow of the market, a positive liquidity flow indicates that liquidity is entering the market and increasing the probability of bullish price action, the opposite is true for negative liquidity flows.
Excess Liquidity Flow
The Hidden Liquidity Flow also indicates when there is an abnormal amount of liquidity flowing through the market, this can indicate the potential for volatility and explosive price action.
🎯Usage Examples:
Now that we have gone through the components and features of Momentum Concepts™ in detail, we'll walk you through the usage examples and strategies that you can utilise to navigate the markets.
Scalping
Using the Scalper's Momentum and the Fast Oscillator as an example, users can first use the Scalper's Momentum as a directional bias and the Fast Oscillator as a means of timing a more precise entry. Take profits can be based on either the Diminishing Momentum Warnings or the Fast Oscillator flipping signals or the Scalper's Momentum flipping signals.
Buying the Dip/Shorting the Pump
Using the Momentum Impulse Oscillator and the Fast Oscillator as an example, users will need to first determine the underlying trend with the Momentum Impulse Oscillator , after which they can use the Fast Oscillator for entry signals into the trend. Take profits can be based on either the Diminishing Momentum Warnings or the Fast Oscillator flipping signals
Reversal Trading
Using the Momentum Impulse Oscillator on a timeframe roughly 3-4 times greater than the chart's timeframe and the Fast Oscillator as an example, users will need to first ensure that the Momentum Impulse Oscillator signals a ranging market on a higher timeframe, divergence signals from the Fast Oscillator can then be used as entries. Take profits can be based on either the Diminishing Momentum Warnings or the Fast Oscillator flipping signals or the Fast Oscillator reaching the zero line.
(These are just examples for reference, the Momentum Concepts™ offers significantly more possibilities for customisation and fine tuning of your trading strategy.)
🎯Conclusion:
In conclusion, Momentum Concepts™ stands as a versatile and powerful tool for traders seeking to decode the intricacies of market momentum across multiple time horizons. With its comprehensive suite of customizable features, including the Fast Oscillator , Scalper's Momentum , Momentum Impulse Oscillator , and Hidden Liquidity Flow , traders can gain deep insights into market dynamics and make well-informed trading decisions. Whether executing high-frequency scalping strategies or timing entries for longer-term positions, Momentum Concepts™ equips traders with the tools they need to navigate diverse market conditions with confidence. By harnessing the power of momentum analysis, this indicator empowers traders to stay ahead of the curve and capitalize on emerging opportunities in the ever-evolving financial markets.
Bezahltes Script

Momentum Velocity [BackQuant]Momentum Velocity
Main Features:
- Momentum Based Oscillator
- Divergences
- Overbought and Oversold Conditions based off a VZO
- Alert Conditions
- Ability to make Adaptive
- Big User input menu for customisation
The Momentum Velocity indicator is based on the principle of momentum , which is a measure of the rate of change or the speed at which prices move over a specified time period. The underlying assumption of momentum trading is that assets that have performed well in the recent past will continue to perform well in the near future, and conversely, assets that have performed poorly will continue to perform poorly. This concept is widely accepted and empirically supported in financial literature, making the Momentum Velocity indicator empirically sound for several reasons:
Empirical Evidence on Momentum
Academic Research: A foundational piece of research that supports the momentum strategy is Jegadeesh and Titman's study, "Returns to Buying Winners and Selling Losers: Implications for Stock Market Efficiency," published in the Journal of Finance in 1993. The authors find that strategies which buy stocks that have performed well in the past and sell stocks that have performed poorly generate significantly higher than expected returns over 3- to 12-month holding periods. This study is one of many that empirically validate the momentum effect in stock returns.
Behavioural Finance Theories:
Behavioural finance provides explanations for the momentum effect that go beyond the efficient market hypothesis. Theories such as investor herding, overreaction and under reaction to news, and the disposition effect can cause price trends to continue. The momentum strategy exploits these behavioural biases by assuming that prices will continue to move in their current direction for some time.
Global Evidence:
The momentum effect is not limited to specific markets or asset classes. Studies have documented momentum profits across various countries, markets, and asset types (stocks, bonds, commodities, and currencies). For instance, Asness, Moskowitz, and Pedersen in their paper, "Value and Momentum Everywhere," published in the Journal of Finance in 2013, show that momentum strategies can yield positive returns in different international markets.
Risk Factors:
Some researchers argue that the returns to momentum strategies are compensation for bearing certain risks. However, the empirical evidence suggests that momentum returns are difficult to explain by traditional risk factors alone, adding to the strategy’s attractiveness. The factor model of Carhart (1997), which adds a momentum factor to the Fama and French three-factor model, highlights the importance of momentum as a distinct source of returns.
Empirical Evidence Application
The Momentum Velocity indicator applies these empirical insights by quantitatively measuring the speed and direction of price movements over a given period, adjusting for recent market conditions through adaptive filtering, and normalizing the results to identify potential trading signals. By doing so, it provides traders with a tool that not only captures the essence of the momentum anomaly but also enhances it with modern technical analysis techniques for real-time market application.
Trading Application
Due to the robustness of momentum, traders are able to use this as a confluence metric into their system on any timeframe. Providing robust signals, that by extention are adaptive to the market. This is also further enabled by using adaptive filtering.
Conclusion
In summary, the empirical soundness of the Momentum Velocity indicator is grounded in the well-documented momentum effect observed in financial markets. By leveraging historical price data to predict future price movements, it aligns with both academic research and observed market behavior, making it a potentially valuable tool for traders seeking to exploit momentum-based trading opportunities.
User Inputs:
Calculation Source: Choose the price component (e.g., close) to base calculations on.
Lookback Period: Define the period over which momentum and normalization are calculated.
Use Adaptive Filtering?: Toggle the use of DEMA for more responsive momentum calculation.
Adaptive Lookback Period: Set the period for the adaptive filter when enabled.
Show Momentum Moving Average?: Option to display a moving average of the plotosc for trend smoothing.
MA Period: Specify the period for the momentum moving average.
Show Static High and Low Levels: Display predefined levels indicating extreme momentum thresholds.
Color Bars According to Trend?: Color price bars based on the momentum direction for quick visual reference.
Show Overbought and Oversold Signals: Highlight extreme volume conditions as potential buy/sell signals.
Signal Calculation Period: Set the period for calculating volume-based signals.
Show Detected Divergences?: Enable or disable the visualization of bullish and bearish divergences.
How it can be used in the context of a Trading System
Momentum and momentum divergences are pivotal concepts in trading systems, offering traders insights into the strength and potential reversal points of market trends. Momentum, a measure of the rate of price changes, helps traders identify the velocity of market movements, allowing them to ride the wave of prevailing trends for profits. When momentum divergences occur—where price movement and momentum indicators move in opposite directions—they signal a weakening of the current trend and potential for reversal. Traders can use these signals to adjust their positions, entering or exiting trades based on the anticipation of trend changes. Incorporating momentum and its divergences into a trading system provides a dynamic strategy that leverages the market's natural cycles of trend strength and exhaustion, aiming to capitalize on both continuation and reversal opportunities for enhanced trading outcomes.
We have also added a volume based component for traders to use as a point of confluence. It is shown on the chart giving background hues for overbought and oversold signals.
Thus following all of the key points here are some sample backtests on the 1D Chart
Disclaimer: Backtests are based off past results, and are not indicative of the future.
INDEX:BTCUSD
INDEX:ETHUSD
BINANCE:SOLUSD
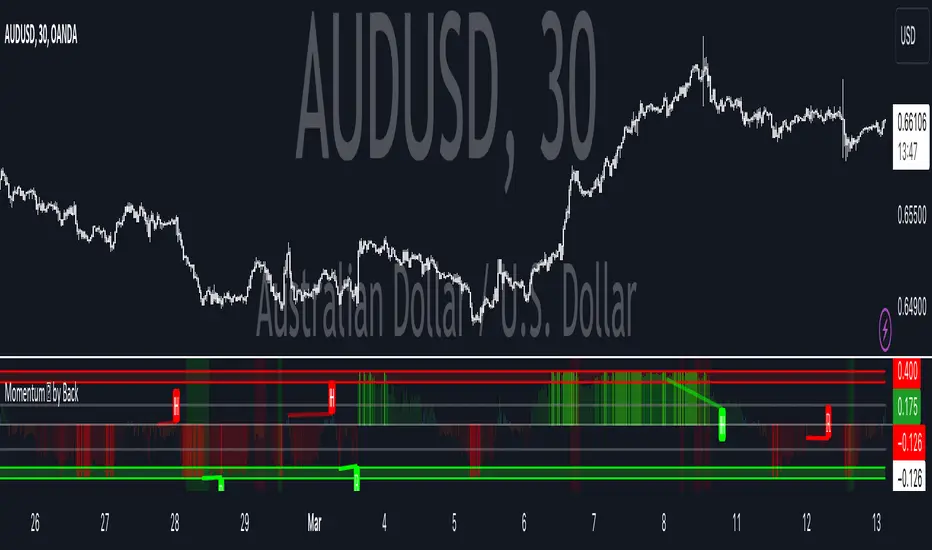
Divergence Toolkit (Real-Time)The Divergence Toolkit is designed to automatically detect divergences between the price of an underlying asset and any other @TradingView built-in or community-built indicator or script. This algorithm provides a comprehensive solution for identifying both regular and hidden divergences, empowering traders with valuable insights into potential trend reversals.
🔲 Methodology
Divergences occur when there is a disagreement between the price action of an asset and the corresponding indicator. Let's review the conditions for regular and hidden divergences.
Regular divergences indicate a potential reversal in the current trend.
Regular Bullish Divergence
Price Action - Forms a lower low.
Indicator - Forms a higher low.
Interpretation - Suggests that while the price is making new lows, the indicator is showing increasing strength, signaling a potential upward reversal.
Regular Bearish Divergence
Price Action - Forms a higher high.
Indicator - Forms a lower high.
Interpretation - Indicates that despite the price making new highs, the indicator is weakening, hinting at a potential downward reversal.
Hidden divergences indicate a potential continuation of the existing trend.
Hidden Bullish Divergence
Price Action - Forms a higher low.
Indicator - Forms a lower low.
Interpretation - Suggests that even though the price is retracing, the indicator shows increasing strength, indicating a potential continuation of the upward trend.
Hidden Bearish Divergence
Price Action - Forms a lower high.
Indicator - Forms a higher high.
Interpretation - Indicates that despite a retracement in price, the indicator is still strong, signaling a potential continuation of the downward trend.
In both regular and hidden divergences, the key is to observe the relationship between the price action and the indicator. Divergences can provide valuable insights into potential trend reversals or continuations.
The methodology employed in this script involves the detection of divergences through conditional price levels rather than relying on detected pivots. Traditionally, divergences are created by identifying pivots in both the underlying asset and the oscillator. However, this script employs a trailing stop on the oscillator to detect potential swings, providing a real-time approach to identifying divergences, you may find more info about it here (SuperTrend Toolkit) . We detect swings or pivots simply by testing for crosses between the indicator and its trailing stop.
type oscillator
float o = Oscillator Value
float s = Trailing Stop Value
oscillator osc = oscillator.new()
bool l = ta.crossunder(osc.o, osc.s) => Utilized as a formed high
bool h = ta.crossover (osc.o, osc.s) => Utilized as a formed low
// Note: these conditions alone could cause repainting when they are met but canceled at a later time before the bar closes. Hence, we wait for a confirmed bar.
// The script also includes the option to immediately alert when the conditions are met, if you choose so.
By testing for conditional price levels, the script achieves similar outcomes without the delays associated with pivot-based methods.
type bar
float o = open
float h = high
float l = low
float c = close
bar b = bar.new()
bool hi = b.h < b.h => A higher price level has been created
bool lo = b.l > b.l => A lower price level has been created
// Note: These conditions do not check for certain price swings hence they may seldom result in inaccurate detection.
🔲 Setup Guide
A simple example on one of my public scripts, Standardized MACD
🔲 Utility
We may auto-detect divergences to spot trend reversals & continuations.
🔲 Settings
Source - Choose an oscillator source of which to base the Toolkit on.
Zeroing - The Mid-Line value of the oscillator, for example RSI & MFI use 50.
Sensitivity - Calibrates the sensitivity of which Divergencies are detected, higher values result in more detections but less accuracy.
Lifetime - Maximum timespan to detect a Divergence.
Repaint - Switched on, the script will trigger Divergencies as they happen in Real-Time, could cause repainting when the conditions are met but canceled at a later time before bar closes.
🔲 Alerts
Bearish Divergence
Bullish Divergence
Bearish Hidden Divergence
Bullish Hidden Divergence
As well as the option to trigger 'any alert' call.
The Divergence Toolkit provides traders with a dynamic tool for spotting potential trend reversals and continuations. Its innovative approach to real-time divergence detection enhances the timeliness of identifying market opportunities.

Wiseball RSI Super Advanced Divergences | EssentialThis indicator is a cutting-edge tool designed to elevate your trading strategy by identifying both regular and hidden RSI divergences with unparalleled precision. Moreover, this indicator uniquely offers the capability to visualize divergences as they are forming ("anticipated"), a feature that stands out for its originality and innovation.
Unique Features and How They Work:
This tool distinguishes itself by leveraging its Divergences Detection System (DDS), which incorporates advanced algorithms to analyze market movements and oscillator behavior beyond the capabilities of existing open-source scripts. Here's a brief overview of what makes DDS uniquely effective:
Anticipated and Projected Divergences: DDS goes beyond mere detection of existing divergences. It offers insights into divergences that are currently forming and even projects potential future divergences by analyzing current trends and oscillator levels. This forward-looking feature empowers traders to anticipate market movements, offering a strategic advantage.
Comprehensive Pivot Analysis: Unlike typical divergence indicators, such as the "RSI Divergence Indicator," which only identifies divergences between two consecutive pivots, DDS is engineered to analyze as many previous pivots as the user's configuration allows (duration min/max). This capability ensures that no potential trend or extended divergence is overlooked, providing a more thorough market analysis.
Multiple Divergences Detection: Our system is capable of detecting multiple divergences within the same timeframe. For instance, it can identify a significant bearish divergence alongside a minor bullish divergence, offering a nuanced view of market dynamics that other indicators might miss.
Extensive Customization Options: DDS provides an array of configuration settings, allowing traders to tailor the detection system to their specific needs. Whether adjusting for sensitivity, timeframes, or specific divergence types, these customization options ensure that the tool can adapt to various trading strategies and preferences.
Our commitment to continuous development means that we regularly update the script based on user feedback, ensuring that it remains at the forefront of trading technology.
How to Use This Script:
Setup: Search for "Wiseball RSI Super Advanced Divergences" in the TradingView indicator library. Easily add the script to your TradingView chart and adjust the settings according to your trading preferences.
Analysis: The script automatically identifies divergences and highlights them on your chart, using color-coded lines and patterns for easy interpretation.
Action: Customize alerts to notify you of new divergences, enabling timely trading decisions based on the script's analysis.
Note: This indicator is best used on a dark background, as it has been optimized for this.
Divergence Style Coding:
Bullish Regular Divergence: Green
Bullish Hidden Divergence: Blue
Bearish Regular Divergence: Red
Bearish Hidden Divergence: Orange
Confirmed Divergence: Solid opaque line
Anticipated Divergence: Dotted line in the type's color
Projected Divergence: Dashed line in the type's color
Understand Technical and practical limitations:
This indicator is designed to facilitate ease of use, correspond to standard practices, and cover your essential needs. DDS options are limited to the essentials for simplicity and ease of use. Moreover, these limitations allow for reduced calculation time and a smooth display.
It is limited to displaying 100 divergences, and the number of bars analyzed is fixed at 960. Use the replay mode to view past divergences.
Divergences sharing the same endpoint are limited to the divergence with the longest duration.
Divergences of the same type that cross or share the same time space are filtered to display only one.
The maximum duration of divergences is set to 120 bars.
Anticipated divergences but not projected ones.
Note: As with all trading tools, it's crucial to use this indicator in conjunction with other indicators and fundamental analysis to validate your trading decisions. Our tools are designed to provide you with valuable insights, not to predict the future. Always conduct your research and trade responsibly.

Divergence Signal [TradingFinder] RSI & MACD Reversal On Swing🔵 Introduction
Sometimes in analyzing price charts using indicators, you may observe a discrepancy. For instance, while the price of stocks, currencies, or commodities is increasing, the indicator shows a decrease. Such a phenomenon in technical analysis is termed "divergence." Divergences are categorized into three types based on their formation and the prediction they make about the continuation of the price trend: "Regular Divergence," "Hidden Divergence," and "Time Divergence."
🟣 Important :
• This indicator exclusively identifies regular divergences since its primary function is to detect reversal points.
• This indicator identifies divergences using three indicators: "Moving Average Convergence Divergence" (MACD), "Relative Strength Index" (RSI), and "Awesome Oscillator" (AO). The user can choose each of these indicators in the settings using the "Divergence Detection Method" dropdown menu for identifying divergences. These settings are by default set to the MACD mode.
🔵Types of Divergence
Divergences, as mentioned, offer different predictions about the continuation of price trends. Hence, they have various types. We will focus on explaining regular divergences based on this indicator.
🟣 Regular Divergence(RD) :
Regular divergence is a situation arising from contradictory behavior between the indicator and the price chart at the end of a trend. By identifying regular divergences, we anticipate a change in trend direction resembling a reversal pattern.
Regular divergence has two types based on the trend and prediction:
Negative Regular Divergence (RD-) :
This type occurs between two price peaks at the end of an uptrend. Despite forming a new high, the indicator fails to recognize it, indicating a negative regular divergence. The likelihood of a subsequent downtrend is high. Negative divergence suggests strong selling pressure and weak buying power, portraying an unfavorable future for the stock.
Positive Regular Divergence (RD+) :
In contrast, positive regular divergence happens at the end of a downtrend and between two price troughs. As depicted in the chart, although the price forms a new low, the indicator doesn't acknowledge it. Positive regular divergence indicates robust buying pressure and weak selling power. Upon identifying positive divergence in the chart, we expect a price increase for the stock under review
🔵 How to Use
Information from the indicator is displayed in two ways: Table and Label.
🟣 Table : The table displays information about the latest divergence. This includes the type of divergence, existence or absence of divergence, consecutive divergences, divergence quality, and change in indicator phase.
Type Divergence : Indicates the type of divergence, which can be either "Bullish Divergence" or "Bearish Divergence."
Exist : Indicates the presence of divergence with a "+" sign and absence with a "-" sign. A green color is used for bullish divergence and red for bearish divergence.
Consecutive : Shows the number of consecutive divergences. For example, if there are 3 consecutive divergences, the number 3 is displayed.
Divergence Quality : Displays the quality of the divergence based on the number of consecutive divergences. If there is 1 divergence, the quality is "Normal"; for 2 divergences, it's "Good"; and for 3 or more divergences, it's "Strong."
Change Phase Indicator : Indicates whether a phase change in the indicator has occurred with "+" for yes and "-" for no.
🟣 Label : Unlike the table, which only shows information about the latest divergence, labels display information about each divergence at the point where it occurs. The information includes the type of divergence, detection method, divergence quality, consecutive divergences, and change in phase indicator. The selected method of detection is also displayed. For example, if the chosen method is the "AO" indicator, the label will show "Method: AO."
🔵 Settings
Fractal Period : Determines the period of swings. The minimum and default value is 2.
Divergence Detect Method : Selects the indicator (MACD, RSI, or AO) used for detecting divergences. The default indicator is MACD.
Show Fractal : Chooses whether to display fractals or not. The default is "No."
Show Table : Determines whether to display the table or not. The default is "Yes."
Show Label : Chooses whether to display labels or not. The default is "Yes."
Label Size : Adjusts the size of the labels from "Tiny" to "Large."

Squeeze Momentum DeluxeThe Squeeze Momentum Deluxe is a comprehensive trading toolkit built with features of momentum, volatility, and price action. This script offers a suite for both mean reversion and trend-following analysis. Developed based on the original TTM Squeeze implementation by @LazyBear, this indicator introduces several innovative components to enhance your trading insights.
🔲 Components and Features
Momentum Oscillator - as rooted in the TTM Squeeze, quantifies the relationship between price and its extremes over a defined period. By normalizing the calculation, the values become comparable throughout time and across securities, allowing for a nuanced assessment of Bullish and Bearish momentum. Furthermore, by presenting it as a ribbon with a signal line we gain additional information about the direction of price swings.
Squeeze Bars - The original squeeze concept is based on the relationship between the Bollinger Bands and Keltner Channel , once the BB resides inside the KC a squeeze occurs. By understanding their fundamentals a new form of calculation can be inferred.
method bb(float src, simple int len, simple float mult) => method kc(float src, simple int len, simple float mult) =>
float basis = ta.sma (src, len) float basis = ta.sma (src, len)
float dev = ta.stdev(src, len) float rng = ta.atr ( len)
float upper = basis + dev * mult float upper = basis + rng * mult
float lower = basis - dev * mult float lower = basis - rng * mult
Both BB and KC are constructed upon a moving average with the addition of Standard Deviation and Average True Range respectively. Therefore, the calculation can be transformed to when the Stdev is lower than the ATR a squeeze occurs.
method sqz(float src, simple int len) =>
float dev = ta.stdev(src, len)
float atr = ta.atr ( len)
dev < atr ? true : false
This indicator uses three different thresholds for the ATR to gain three levels of price "Squeeze" for further analysis.
Directional Flux- This component measures the overall direction of price volatility, offering insights into trend sentiment. Presented as waves in the background, it includes an OverFlux feature to signal extreme market bias in a particular direction which can signal either exhaustion or vital continuation. Additionally, the user can choose if to base the calculation on Heikin-Ashi Candles to bias the tool toward trend assessment.
Confluence Gauges - Placed at the top and bottom of the indicator, these gauges measure confluence in the relationship between the Momentum Oscillator and Directional Flux. They provide traders with an easily interpretable visual aid for detecting market sentiment. Reversal doritos displayed alongside them contribute to mean reversion analysis.
Divergences (Real-Time) - Equipped with a custom algorithm, the indicator detects real-time divergences between price and the oscillator. This dynamic feature enhances your ability to spot potential trend reversals as they occur.
🔲 Settings
Directional Flux Length - Adjusts the period of which the background volatility waves operate on.
Trend Bias - Bases the calculation of the Flux to HA candles to bias its behavior toward the trend of price action.
Squeeze Momentum Length - Calibrates the length of the main oscillator ribbon as well as the period for the squeeze algorithm.
Signal - Controls the width of the ribbon. Lower values result in faster responsiveness at the cost of premature positives.
Divergence Sensitivity - Adjusts a threshold to limit the amount of divergences detected based on strength. Higher values result in less detections, stronger structure.
🔲 Alerts
Sell Signal
Buy Signal
Bullish Momentum
Bearish Momentum
Bullish Flux
Bearish Flux
Bullish Swing
Bearish Swing
Strong Bull Gauge
Strong Bear Gauge
Weak Bull Gauge
Weak Bear Gauge
High Squeeze
Normal Squeeze
Low Squeeze
Bullish Divergence
Bearish Divergence
As well as the option to trigger 'any alert' call.
The Squeeze Momentum Deluxe is a comprehensive tool that goes beyond traditional momentum indicators, offering a rich set of features to elevate your trading strategy. I recommend using toolkit alongside other indicators to have a wide variety of confluence to therefore gain higher probabilistic and better informed decisions.

ATR Adaptive RSI OscillatorThe " ATR Adaptive RSI Oscillator " is a versatile technical analysis tool designed to help traders make informed decisions in dynamic market conditions. It combines the Relative Strength Index (RSI) with the Average True Range (ATR) to provide adaptive and responsive insights into price trends.
Key Features :
Adaptive RSI Periods : The indicator introduces the concept of adaptive RSI periods based on the ATR (Average True Range) of the market. When enabled, it dynamically adjusts the RSI calculation period, offering longer periods during high volatility and shorter periods during low volatility. This adaptability enhances the accuracy of RSI signals across varying market conditions.
Volume-Based Smoothing : The indicator includes a smoothing feature that computes a time-decayed weighted moving average of RSI values over the last two bars, using volume-based weights. This approach offers a time-sensitive smoothing effect, reducing noise for a clearer view of trend strength compared to the standard RSI.
Divergence Detection : Traders can enable divergence detection to identify potential reversal points in the market. The indicator highlights regular bullish and bearish divergences, providing valuable insights into market sentiment shifts.
Customizable Parameters : Traders have the flexibility to customize various parameters, including RSI length, adaptive mode, ATR length, and divergence settings, to tailor the indicator to their trading strategy.
Overbought and Oversold Levels : The indicator includes overbought (OB) and oversold (OS) boundary lines that can be adjusted to suit individual preferences. These levels help traders identify potential reversal zones.
The "ATR Adaptive RSI Oscillator" is a powerful tool for traders seeking to adapt their trading strategies to changing market dynamics. Whether you're a trend follower or a contrarian trader, this indicator provides valuable insights to support your decision-making process.
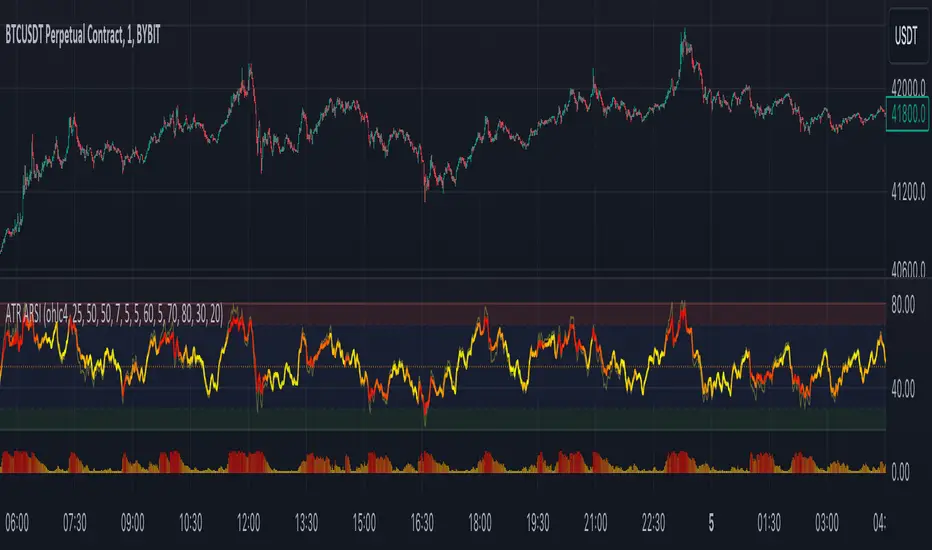
RSI + Divergences + Alerts [MisterMoTA]The indicator RSI + Divergences + Alerts by MisterMoTA is an RSI indicator that fills the RSI and RSI moving average with 4 different colors (growing up, falling up, falling down and rising down colors), users can customize colors from dashboard , also can be disabled the fill if the user want a standard RSI.
The dafault value of RSI is 14 and value of the moving average is 50 ( a dynamic 50 rsi line is better for trend identification than a standard 50 line) and users can change the values from indicator settings.
For detecting the divergences displayed in the indicator, I integrated in our script the default Divergences indicator from Tradingview, users can display, hide and change colors for regular and hidden divergences.
RSI indicator display also trend conditions for RSI and RSI MA, the RSI MA angle is calculated using ATR value, the slope of the RSI Noving Average can help to identify trend conditions too.
The script comes with 12 different alerts, if need different alerts please let me know in the comments and will update the script with your request:
Alert for Regular Bullish Divergence
Alert for Regular Bearish Divergence
Alert for Hidden Bullish Divergence
Alert for Hidden Bearish Divergence
Alert for RSI Overbought
Alert for RSI Extreme Overbought
"Alert for RSI Oversold
Alert for RSI Extreme Oversold
Alert for RSI Crossing Above RSI MA
Alert for RSI Crossing Bellow RSI MA
Alert for RSI Crossing Above 50
Alert for RSI Crossing Bellow 50
Please follow me for other script like this one.
Kind regards,
MisterMoTA
