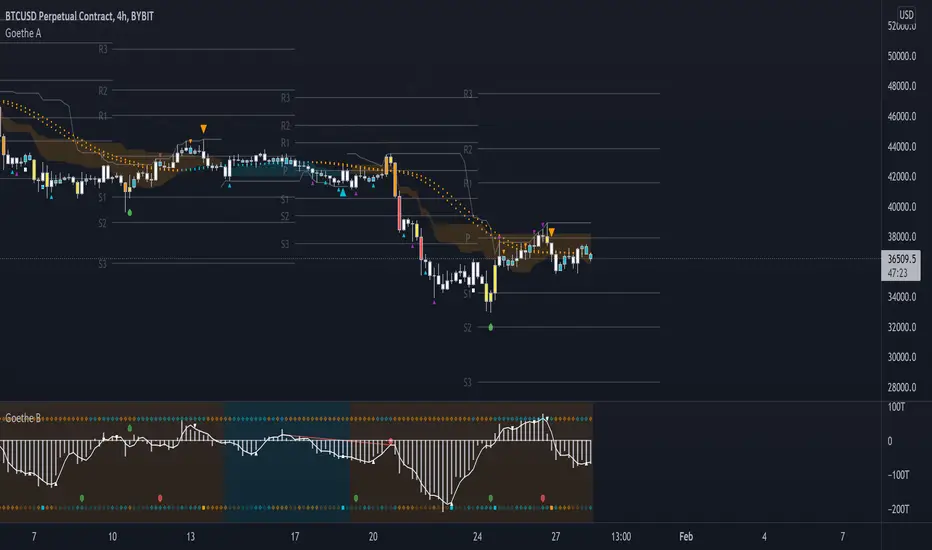
Goethe A - Multiple Leading Indicator PackageGoethe A is an Indicator Package that contains multiple leading and lagging indicators.
The background is that shows the local trend is calculated by either two Moving Averages or by a Kumo Cloud. By default the Kumo Cloud calculation is used.
What are those circles?
-These are OBV (or VPT, can be set in the options) Divergences. Red for Regular-Bearish. Orange for Hidden-Bearish. Green for Regular-Bullish. Aqua for Hidden-Bullish.
What this middle line?
-The middle line is calculated by a smoothed Heikin-Ashi indicator. I can be used as a dynamic zone of support and resistance. Many times this indicator is used as entry signal giver in trend following strategies.
What are those background lines?
-The background contains a simple Daily Pivots indicator. This indicator can be read as zones of Support and Resistance that updated based on the used timeframe.
What is this smaller thin grey line?
-This is a very simple Stoploss indicator based on Donchian Channels. The trade direction is based and calculated by the local trend (background color)
What are those small orange or aqua triangles?
- These are Pivots . They show when the OBV or wolfpack oscillators (or a double confirmation of both) might reverse, this is important to know because many times the price action follows this move.
What are those purple triangles?
- These are Pivots . They show when the PVT oscillator might reverse, this is important to know because many times the price action follows this move.
What are those big orange or aqua triangles?
- These are TSI (true strength indicator) entry signals . They are calculated by the TSI entry signal, the TSI oscillator treshold and in conjunction with the overall local trend (background color).
What are those white squares?
- These are Overbought or Oversold regions of the build-in RSI bands indicator. Every time the price crosses one of the RSI bands those squares are printed. Most of the time this happens after a move and indicates that this strong move has come to an end.
Most settings of the indicator package can be modified to your liking and based on your chosen strategy might have to be modified. Please keep in mind that this indicator is a tool and not a strategy, do not blindly trade signals, do your own research first! Use this indicator in conjunction with other indicators to get multiple confirmations.
Divergenz
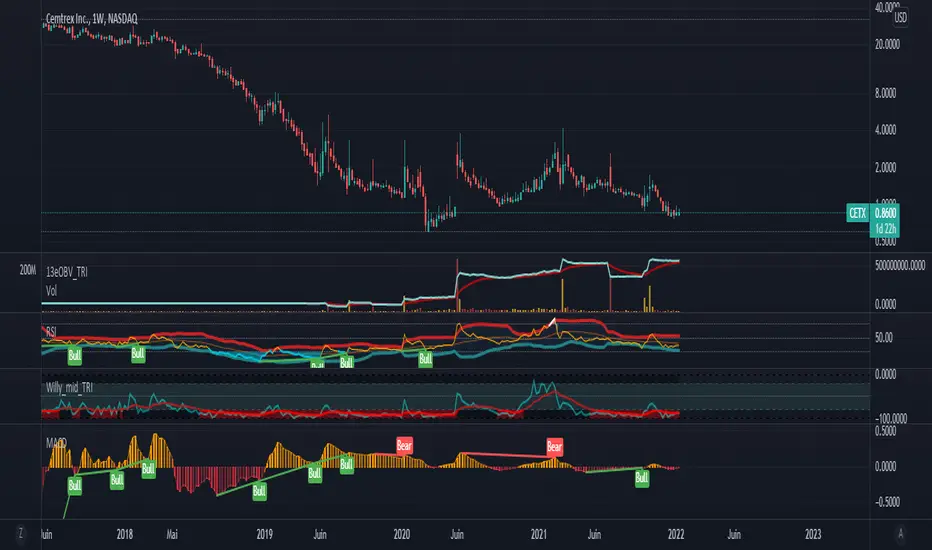
Coppock Curve with Pivot Points and Divergence The Coppock Curve is a long-term price momentum indicator used primarily to recognize major downturns and upturns in a stock market index. It is calculated as a 10-month weighted moving average of the sum of the 14-month rate of change and the 11-month rate of change for the index. It is also known as the "Coppock Guide."
The Coppock formula was introduced in Barron's in 1962 by Edwin Coppock.
The Coppock Curve is a technical indicator that provides long-term buy and sell signals for major stock indexes and related ETFs based on shifts in momentum.
What Does the Coppock Curve Tell You?
The Coppock Curve was originally implemented as a long-term buy and sell indicator for major indices such as the S&P 500 and the Wilshire 5000. Often, it is used with long-term time series such as a candlestick chart, but where each candle contains a month's worth of price information.
The Difference Between the Coppock Curve and Rate of Relative Strength Index (RSI)?
The relative strength index looks at how the current price compares to prior prices, though it is calculated differently than the rate of change (ROC) indicator used in the Coppock Curve calculation. Therefore, these indicators will provide different trade signals and information.
What are those circles?
-These are Divergences. Red for Regular-Bearish. Orange for Hidden-Bearish. Green for Regular-Bullish. Aqua for Hidden-Bullish.
What are those triangles?
- These are Pivots . They show when the VPT oscillator might reverse, this is important to know because many times the price action follows this move.
Please keep in mind that this indicator is a tool and not a strategy, do not blindly trade signals, do your own research first! Use this indicator in conjunction with other indicators to get multiple confirmations.

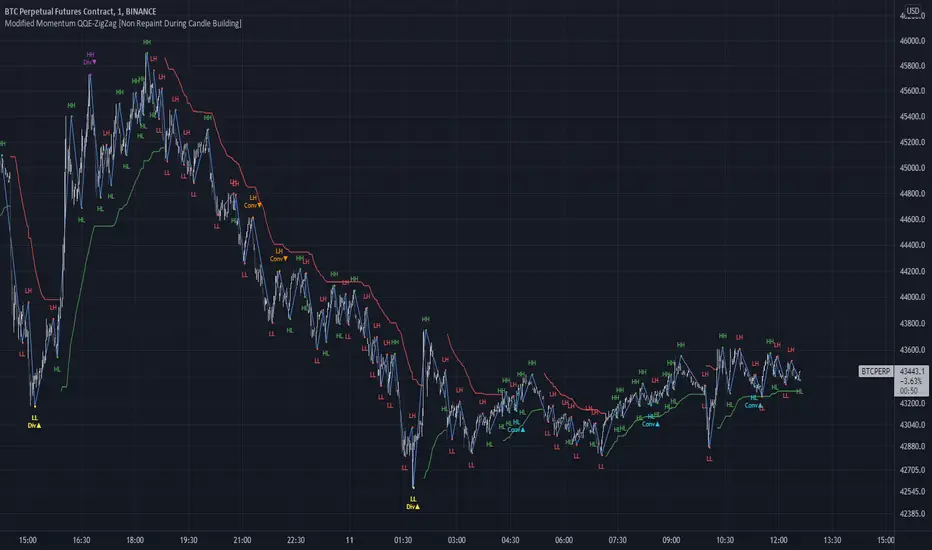
Modified QQE-ZigZag [Non Repaint During Candle Building]V V V V V V V Please Read V V V V V V V
I ask Peter and he is fine, that im published this script
Tell me if you have some ideas or criticism about that sricpt
>>>>>>>>>> This is a modified Version of Peter_O's Momentum Based ZigZag <<<<<<<<<<<
This is only a test, and i want to share it with the community
It works like other ZigZags
Because Peters_O's original Version is only non repaint on closed historical Data ,
during a Candle building process it can still repaint (signal appears / 21 seconds later signal disapears / 42 seconds later signal appears again in the same candle / etc.),
but that isnt important for backtesting, its only important for realtime PivotPoints during a candle.
My goal for this zigzag was to make it absolute non repaint neither during a candle building process (current candle),
so once the signal is shown there is no chance that it disapers and shown a few seconds later again on that same candle, it can only show up one time per candle an thats it,
and that makes it absolute non repaint in all time frames.
Credits to:
==> Thanks to @glaz , for bringing the QQE to Tradingview <3
==> Thanks to @Peter_O , for sharing his idea to use the QQE as base for a Zigzag
and for sharing his MTF RSI with the Community <3
Changes:
- I changed the MTF RSI a little bit, you can choose between two version
- I changed the QQE a little bit, its now using the MTF RSI , and its using High and Low values as Source to make it absolute non repaint during a candle is building
- I added a little Divergence Calculation beween price and the MTF RSI that is used for the ZigZag
Colors :
- Green for HH / HL Continuation
- Red for LL / LH Continuation
- Yellow for Positive Divergence
- Purple for Negative Divergence
Important:
It is not possible to backtest this script correctly with historical Data, its only possible in Realtime,
because the QQE is using crossunders with RSILowSource and the QQE Line to find the Tops and,
because the QQE is using crossovers with RSIHighSource and the QQE Line to find the Bottoms,
and that means it is not possible to find the correct Time/Moment when that crossovers / crossunders happens in historical Data
=============> So please be sure you understand the Calculation and Backtest it in Realtime when you want to use it,
because i didn't published this script for real trading
=============> Im not a financial advisor and youre using this script at your own risk
=============> Please do your own research
OBV+OBV with an extra twist.
Add up to 4 moving averages and choose from simple, exponential, smoothed, etc.
Choose to display a trend fill. Fill will be green when above the MA4 or red when below it. If the difference between the MA1 and MA4 is growing, the trend fill will be a more solid color indicating a strengthening trend. If the gap is lessening, it will gradually get more transparent indicating a weakening trend.
Finally, options to display bullish and bearish regular and hidden divergences are included.

Wave Trend OscillatorThis is a very standard version of the Wave Trend Oscillator.
The Channel and Average values are displayed as lines, most people display them as areas.
The Channel and Average difference is displayed as a histogram, most people display it as a tiny noisy area.
I was unable to find a standard version of the Wave Trend Oscillator.
The colorful hyped up versions of this indicator made me feel like a clown while using them.
I have essentially copied the style of the MACD with this indicator, to keep things professional.
With this WTO, you can change the timeframe and source.
You can also change the histogram average length and multiplier, making it usable.
The typical way that people display the histogram is completely unusable and just for appearance.
Now it does a decent job showing when the momentum of the WTO's downward movement is slowing down, just like how the MACD histogram works.
This indicator is essentially a normalized MACD, though they are calculated differently.
The Wave Trend Oscillator is useful for spotting/monitoring changed in mid-trend momentum.
In my experience, divergence in this indicator is a strong signal.
If the MACD is too slow for you, then this is a great alternative; without all the extra fluff people usually add to it.

[Rygel] MACD 4C with divergences, crossovers and alertsThis indicator is a reliable, exhaustive, instant, simple divergence detector for the MACD 4C oscillator.
I've struggled for months to find a MACD divergence indicator I can rely on, I've tinkered with the ones I found and never was satisfied by the final result. For all of them important divergences were not shown, for some divergences was shown too late, for others divergence lines was not drawn, some even shown some strange exotic divergences... I played will all the parameters and something was always wrong or missing at the end.
It was even worse for the MACD 4C indicator, the 4-color MACD, which I prefer to use.
So I finally decided to write my own divergence algorithm and to create my own indicator. After a few attempts, here's the result.
This MACD indicator is using the same divergence detection algorithm I wrote for my RSI indicator. You'll find on its description page a comparison of my divergence algorithm with other ones to see how it differs.
When I built this indicator, my objectives were to create one that is:
Reliable. I didn't want to have to double-check an indicator to make sure it's doing what I expect it to do. I want to be able to look at it for one second and know I can rely on it.
Exhaustive. I didn't want to have to rely on multiple indicators to be sure I'm not missing a divergence.
Instant. I wanted the divergences to be shown as soon as soon as they form and not after a pivot is confirmed. For some indicator, when the divergence is displayed, it's already too late to act on it.
Simple. I wanted my indicator to be clean, readable and not visually aggressive. The main objective of this indicator is to show divergences and I didn't want to visually overload it with unrequired information.
I wanted my indicator to be a simple as possible, nonetheless you'll find a few parameters to tinker with. Many of them will need no explanation but here's the list.
Show signal line: disabled by default. Show the MACD signal line.
Color signal line: disabled by default. Show the signal line as green when it goes up and read when it goes down.
Show signal crossovers: enabled by default. Show a green dot when MACD crosses up its signal line and a red dot when it crosses down.
Show zero line: enabled by default. Show a line at the 0 value.
Show zero crossovers: disabled by default. Show a green triangle when MACD crosses up the 0 line and a red triangle when it crosses down.
Show regular divergences: enabled by default.
Show hidden divergences: disabled by default for readability. I try to keep the indicator as clean as possible by default.
Bullish regular divergence color : no explanation needed I suppose.
Bullish hidden divergence color : same.
Bearish regular divergence color : ditto.
Bearish hidden divergence color : uhh.
Show overbought and oversell backgrounds : when RSI is oversold or oversell, the background color changes to red or green. The indicator uses two levels of oversold/overbought. When the RSI is strongly oversold/overbought the background color gets brighter. You can configure these levels in the advanced parameters.
Advanced parameters:
MACD fast moving average length: 12 by default.
MACD slow moving average length: 26 by default.
MACD signal moving average length: 9 by default.
Show divergences before pivot confirmation : enabled by default. Divergences will appear as soon as possible, before the pivot is confirmed by another candlestick. Unconfirmed divergences will appear as dashed lines then disappear if not confirmed or turn to solid lines if confirmed. This may create false positives with alerts as the divergence may disappear.
Minimum bars to check: 5 by default. As this indicator detects absolutely all the divergences, some may be insignificant and it may become unreadable without some filtering. If you want to see absolutely all the divergences, you may lower this value. Please note TradingView limits to 50 how many lines are displayed at the same time on an indicator. So when you display more divergences, some in the past disappear. It's not usually an issue but if you scroll back in time, divergences will stop to show at one point in the past.
Maximum bars to check: 75 by default. Divergences may go far in the past, this parameters limit how old a divergence may be. You can higher it to show more divergences.
Show pivots: disabled by default. Show the pivot points used for divergence detections.
This indicator offers the following alerts:
Any divergence
Bearish divergence
Bullish divergence
Regular bearish divergence
Regular bullish divergence
Hidden bearish divergence
Hidden bullish divergence
MACD becoming positive
MACD becoming negative
MACD crossing up signal line
MACD crossing down signal line
Please note TradingView limits for performance reason to 50 the number of lines you can display on an indicator at the same time. So when you scroll back in time, at one point divergences will stop to show. If you want to see divergences far in the past, you may need to use the replay feature or to configure stronger filtering settings.
I hope you'll enjoy this indicator as much as I do! :)
Feel free to comment if you experience a bug or if an important feature is missing for you. (Please note the core of this indicator is divergence detection, I want to keep it simple so I will probably not add many unrelated features to it.)

[Rygel] RSI with divergences and alertsThis indicator is a reliable, exhaustive, instant, simple divergence detector for the RSI oscillator.
I've struggled for months to find a RSI divergence indicator I can rely on, I've tinkered with the ones I found and never was satisfied by the final result. For all of them important divergences were not shown, for some divergences was shown too late, for others divergence lines was not drawn, some even shown some strange exotic divergences... I played will all the parameters and something was always wrong or missing at the end.
So I finally decided to write my own divergence algorithm and to create my own indicator. After a few attempts, here's the result.
At first. Please find below a quick comparison of this indicator with some of the most popular RSI divergence indicators on TradingView. I've hidden their names as it's not my intention to show them in a bad light. These indicators are great and some of you may even find them better than this one, they were just not what I was looking for.
You will most likely notice all of them are missing divergences but not always the same. You'll have to combine all of them to get (almost) all the divergences.
When I built this indicator, my objectives were to create one that is :
Reliable. I didn't want to have to double-check an indicator to make sure it's doing what I expect it to do. I want to be able to look at it for one second and know I can rely on it.
Exhaustive. I didn't want to have to rely on multiple indicators to be sure I'm not missing a divergence.
Instant. I wanted the divergences to be shown as soon as soon as they form and not after a pivot is confirmed. For some indicator, when the divergence is displayed, it's already too late to act on it.
Simple. I wanted my indicator to be clean, readable and not visually aggressive. The main objective of this indicator is to show divergences and I didn't want to visually overload it with unrequired information.
I wanted my indicator to be a simple as possible, nonetheless you'll find a few parameters to tinker with. Many of them will need no explanation but here's the list.
Show regular divergences : enabled by default.
Show hidden divergences : disabled by default for readability. I try to keep the indicator as clean as possible by default.
Bullish regular divergence color : no explanation needed I suppose.
Bullish hidden divergence color : same.
Bearish regular divergence color : ditto.
Bearish hidden divergence color : uhh.
Show overbought and oversell backgrounds : when RSI is oversold or overbought, the background color changes to red or green. The indicator uses two levels of oversold/overbought. When the RSI is strongly oversold/overbought the background color gets brighter. You can configure these levels in the advanced parameters.
Advanced parameters:
RSI source: "close" by default.
RSI length: 14 by default.
Show divergences before pivot confirmation : enabled by default. Divergences will appear as soon as possible, before the pivot is confirmed by another candlestick. Unconfirmed divergences will appear as dashed lines then disappear if not confirmed or turn to solid lines if confirmed. This may create false positives with alerts as the divergence may disappear.
Minimum bars to check: 5 by default. As this indicator detects absolutely all the divergences, some may be insignificant and it may become unreadable without some filtering. If you want to see absolutely all the divergences, you may lower this value. Please note TradingView limits to 50 how many lines are displayed at the same time on an indicator. So when you display more divergences, some in the past disappear. It's not usually an issue but if you scroll back in time, divergences will stop to show at one point in the past.
Maximum bars to check: 50 by default. Divergences may go far in the past, this parameters limit how old a divergence may be. You can higher it to show more divergences.
Use limits for divergences: enabled by default. Don't show divergences when they are above or below a threshold. Another filtering options to make sure only relevant divergences are shown.
Minimum value for bearish divergence: 40 by default.
Maximum value for bullish divergence: 60 by default.
Show pivots: disabled by default. Show the pivot points used for divergence detections.
Oversold level: 30 by default. A red background is shown when the indicator goes below this level.
Overbought level: 70 by default. A green background is shown when the indicator goes above this level.
Strongly oversold level: 20 by default. A brighter red background is shown when the indicator goes below this level.
Strongly overbought level: 80 by default. A brighter green background is shown when the indicator goes above this level.
Show moving average: disabled by default. Add a moving average to the indicator.
Moving average type: SMA by default. You may choose between Bollinger Bands, EMA, SMA, SMMA (RMA), VWMA and WMA.
Moving average length: 14 by default.
Bollinger Band standard deviation 2 by default.
This indicator has the following alerts:
Any divergence
Bearish divergence
Bullish divergence
Regular bearish divergence
Regular bullish divergence
Hidden bearish divergence
Hidden bullish divergence
Please note TradingView limits for performance reason to 50 the number of lines you can display on an indicator at the same time. So when you scroll back in time, at one point divergences will stop to show. If you want to see divergences far in the past, you may need to use the replay feature or to configure stronger filtering settings.
I hope you'll enjoy this indicator as much as I do! :)
Feel free to comment if you experience a bug or if an important feature is missing for you. (Please note the core of this indicator is divergence detection, I want to keep it simple so I will probably not add many unrelated features to it.)

MACD + Divergence + Line █ OVERVIEW
Here's the classic MACD with some simples features in plus.
█ CONCEPTS
4 features
1 — Classic MACD histogram, with 4 different colors such as above or below 0, and above or below the previous bar
2 — Display option to disable EMA
3 — A signal line that show the exact point, because the histogram view might be hard to be precise
4 — Looking for previous Divergences, Bullish, Bearish and Hidden Bullish and Bearish but I don't like Hidden divergences
█ OTHER SECTIONS
An oscillator is good to know where we are in the trends, but it's not enough to run a small business of trading, you need to learn how to use it.
What is a divergence ?
Thanks to The rational investor for teaching me how to use this indicator.
Divergence for Many Indicators v4 STHello Traders.
This is the Strategy version of Divergence for Many Indicators v4, an easy and comfortable indicator.
- - - -
*It's been modified a little bit from the original.
*I got permission from the original author.
*I'm not good at English, I'm sorry.
- - - -
< 4 things to check >
1. Since repainting is not performed, the first imprinted signal can be accurately seen.
2. It does not respond to continuous diversions.
3. If the opposite diversity is not imprinted, caution is required as it is designed not to indicate liquidation. Be careful when reading the figures shown in the strategy tester.
4. Added stop loss and take propirane.
< What changed? >
1. pivot period 5 - > 9
2. Money Flow index and Chaikin Money Flow are released.
- - - -
KOR SUB
< 4가지 확인 사항 >
1. 리페인팅이 없으므로 첫 번째로 각인된 신호를 정확히 볼 수 있습니다.
2. 연속된 다이버젼스에 대해서는 반응하지 않습니다.
3. 반대의 다이버젼스가 각인되지 않으면 청산 표시를 하지 않도록 설계되어 있으므로 주의를 요합니다.
4. 스탑 로스와 테이크 프로핏 항목을 추가하였습니다.
< 무엇이 변경되었나? >
1. 피봇 페리어드 값이 조금 수정되었습니다.
2. MFI & CMF 가 체크 해제된 상태입니다.
THANK YOU ^^

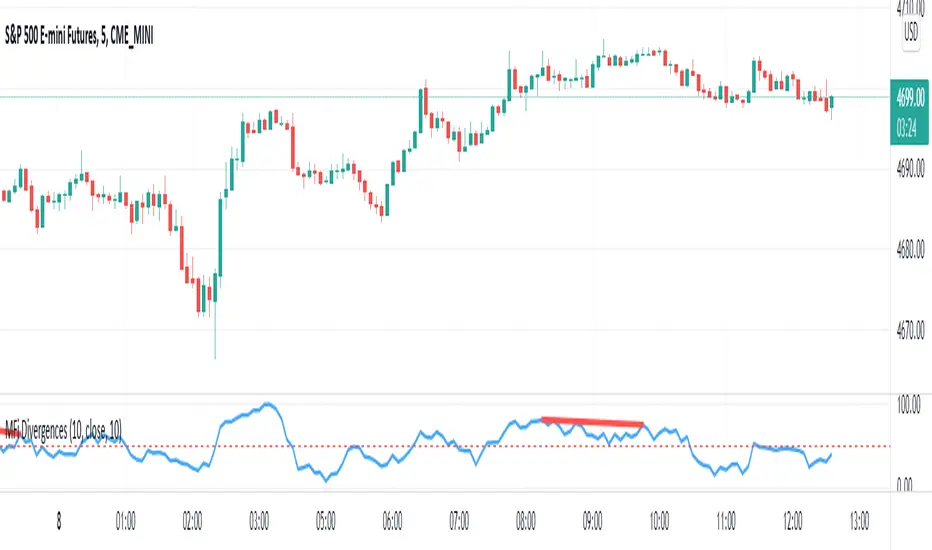
ATR Volume DivergenceThe indicator measures ATR relative to VOLUME of each candle, marks the candles where there is more volume than in the previous one, but a lower ATR - signifying a compression in price movement - resistance. It also marks the candle where there is a greater ATR than in the previous candle, but lower volume - signifying an expansion in price movement - vacuum.
P.S. Bring indicator to FRONT to see the colored candles clearly

Median Convergence DivergenceIntroduction
The Median Convergence Divergence (MCD) is a derivative of the Moving Average Convergence Divergence (MACD). The difference is the change in the use of the measure of central tendency. In MACD, moving average (mean) is used, whereas, in MCD, the median is used instead. The purpose of using the median is to eliminate the outlying values, which would be calculated for a moving average. The outliers would affect the value of the moving average.
For example: 3, 5, 7, 8, 5, 4, 2, 1, 6, 21, 8. The data set average is 6.3, whereas the median value is 5. There is a difference of about 23% in the example. The reason is the outlying value '21' in the data set.
As the markets are volatile, outlying values can always emerge. A moving average will consider those values; on the other hand, the median will ignore. If the strategy calls for a tool to ignore the outliers, the Median Convergence Divergence would be a great centered oscillator.
The default values have changed to suit the current trading days in a week. When the MACD was introduced, there would be six trading days in a week. Therefore, it used 12 (2 weeks), 26(4 weeks), and 9 ( 1.5 weeks). But now that there are five trading days per week. The default values are adapted to them. Feel free to change them as per your wish.
Recommended Settings
The current settings are set to be used for the Daily Time Frame: 5 day period for the fast line, a 20 day period for the slow line, and a 10 day period for the signal line. (5 days represent a trading week, 10 days is two weeks, and 20 days is 4 weeks or a month)
For the weekly charts, use 4 week period for the fast line, 13 week period for the slow line, and 8 week period for the signal line. (4 weeks represent a month, 8 weeks is two months, and 13 weeks is 3 months or quarterly)
And for monthly charts, use 3 month period for the fast line, 12 month period for the slow line, and 6 month period for the signal line. (3 months is quarterly, 6 months is bi-yearly, and 12 month is yearly)
It'll be challenging to measure for intraday since there are many different timeframes within intraday. The settings mentioned above should also be customized as per the requirements of the trading strategy.
Strategy
The strategy application is the same as the MACD, i.e., Signal Line Crossovers, Zero Line Crossovers, and Divergence.
Signal Line Crossovers: When the MCD line crosses above the Signal line, it's a bullish crossover. When the MCD line crosses below the Signal line, it's a bearish crossover.
Zero Line Crossovers: It's a bullish crossover when the MCD line crosses above the Zero line. When the MCD line crosses below the Zero Line, it's a bearish crossover.
Divergence: When price shows a lower low, but MCD shows a higher low, it's a bullish divergence. When the price shows a higher high but MCD shows a lower high, it's a bearish divergence.
Using other indicators in conjunction with the Median Convergence Divergence is recommended to take entry and exit signals.

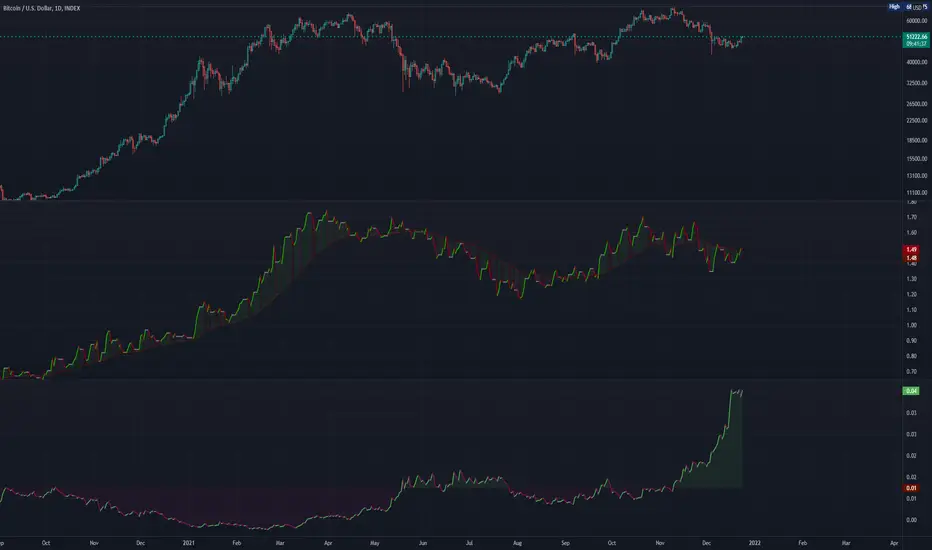
Abz Bonds/BTC divergenceDraft release: This indicator shows the comparative returns from US bonds vs BTC.
I was inspired by this Twitter thread: twitter.com
If you compare the price action of Bitcoin against bond returns over the last year, there's an extraordinary degree of correlation. This may give insights into what's coming next for BTC , but at some point the relationship will inevitably break down. In the meantime, there's much to gain.
DYOR.
Feedback welcome though it may take a while for me to respond.
4x Stochastic Dingue4 Stochastic indicator into 1.
Different lengths produce short-term and long-term indicators that can help with finding the trend and impulses within the trend.
It can also find reversal points when all 4 are at the extreme at the same time. Ex. All 4 Stoch are above 90 or under 10 !! This could signal a bottom or top is soon to happen. (This is not always true as it depends on many factors.)
Many visual options make it even more customizable. Fill between Stoch, background colors, Crosses.
Divergences are not always accurate, depending on settings and timeframe, but they can be useful in certain situations.
---------------------
In closing, no indicator can give perfect signals, you need to use them in conjunction with other information to make better decisions.
I hope you like my indicators and that they help your trading.
If you have any questions please ask.
Thank you.

DivergenceLibrary "Divergence"
Calculates a divergence between 2 series
bullish(_src, _low, depth) Calculates bullish divergence
Parameters:
_src : Main series
_low : Comparison series (`low` is used if no argument is supplied)
depth : Fractal Depth (`2` is used if no argument is supplied)
Returns: 2 boolean values for regular and hidden divergence
bearish(_src, _high, depth) Calculates bearish divergence
Parameters:
_src : Main series
_high : Comparison series (`high` is used if no argument is supplied)
depth : Fractal Depth (`2` is used if no argument is supplied)
Returns: 2 boolean values for regular and hidden divergence
I created this library to plug and play divergences in any code.
You can create a divergence indicator from any series you like.
Fractals are used to pinpoint the edge of the series. The higher the depth, the slower the divergence updates get.
My Plain Stochastic Divergence uses the same calculation. Watch it in action.
EMA Cross + Divergence strategy (Div. signals by The Divergent)A sample strategy demonstrating the usage of The Divergent divergence indicator and The Divergent Library .
The Divergent is an advanced divergence indicator which you can easily incorporate into your own strategies.
In order to use this strategy (and to use the signals in your own strategy), you need to have the Pro version of The Divergent applied to your chart.
For more information, please see the comments inlined in the code.

The Divergent LibraryLibrary "TheDivergentLibrary"
The Divergent Library is only useful when combined with the Pro version of The Divergent - Advanced divergence indicator . This is because the Basic (free) version of The Divergent does not expose the "Divergence Signal" value.
Usage instructions:
1. Create a new chart
2. Add The Divergent (Pro) indicator to your chart
3. Create a new strategy, import this library, add a "source" input, link it to "The Divergent: Divergence Signal", and use the library to decode the divergence signals from The Divergent (You can find example strategy code published in our profile)
4. Act on the divergences signalled by The Divergent
---
isRegularBullishEnabled(context) Returns a boolean value indicating whether Regular Bullish divergence detection is enabled in The Divergent.
Parameters:
context : The context of The Divergent Library.
Returns: A boolean value indicating whether Regular Bullish divergence detection is enabled in The Divergent.
isHiddenBullishEnabled(context) Returns a boolean value indicating whether Hidden Bullish divergence detection is enabled in The Divergent.
Parameters:
context : The context of The Divergent Library.
Returns: A boolean value indicating whether Hidden Bullish divergence detection is enabled in The Divergent.
isRegularBearishEnabled(context) Returns a boolean value indicating whether Regular Bearish divergence detection is enabled in The Divergent.
Parameters:
context : The context of The Divergent Library.
Returns: A boolean value indicating whether Regular Bearish divergence detection is enabled in The Divergent.
isHiddenBearishEnabled(context) Returns a boolean value indicating whether Hidden Bearish divergence detection is enabled in The Divergent.
Parameters:
context : The context of The Divergent Library.
Returns: A boolean value indicating whether Hidden Bearish divergence detection is enabled in The Divergent.
getPivotDetectionSource(context) Returns the 'Pivot Detection Source' setting of The Divergent. The returned value can be either "Oscillator" or "Price".
Parameters:
context : The context of The Divergent Library.
Returns: One of the following string values: "Oscillator" or "Price".
getPivotDetectionMode(context) Returns the 'Pivot Detection Mode' setting of The Divergent. The returned value can be either "Bodies" or "Wicks".
Parameters:
context : The context of The Divergent Library.
Returns: One of the following string values: "Bodies" or "Wicks".
isLinked(context) Returns a boolean value indicating the link status to The Divergent indicator.
Parameters:
context : The context of The Divergent Library.
Returns: A boolean value indicating the link status to The Divergent indicator.
init(firstBarSignal, displayLinkStatus, debug) Initialises The Divergent Library's context with the signal produced by The Divergent on the first bar. The value returned from this function is called the "context of The Divergent Library". Some of the other functions of this library requires you to pass in this context.
Parameters:
firstBarSignal : The signal from The Divergent indicator on the first bar.
displayLinkStatus : A boolean value indicating whether the Link Status window should be displayed in the bottom left corner of the chart. Defaults to true.
debug : A boolean value indicating whether the Link Status window should display debug information. Defaults to false.
Returns: A bool array containing the context of The Divergent Library.
processSignal(signal) Processes a signal from The Divergent and returns a 5-tuple with the decoded signal: [ int divergenceType, int priceBarIndexStart, int priceBarIndexEnd, int oscillatorBarIndexStart, int oscillatorBarIndexEnd]. `divergenceType` can be one of the following values: na → No divergence was detected, 1 → Regular Bullish, 2 → Regular Bullish early, 3 → Hidden Bullish, 4 → Hidden Bullish early, 5 → Regular Bearish, 6 → Regular Bearish early, 7 → Hidden Bearish, 8 → Hidden Bearish early.
Parameters:
signal : The signal from The Divergent indicator.
Returns: A 5-tuple with the following values: [ int divergenceType, int priceBarIndexStart, int priceBarIndexEnd, int oscillatorBarIndexStart, int oscillatorBarIndexEnd].

The Divergent - Advanced Divergence IndicatorAutomated divergence detection with unparalleled customizability for any market on TradingView.
This is the Basic (Free) version of The Divergent - Advanced Divergence Indicator .
Features :
1. Divergence detection for any market & any timeframe
Bitcoin? Tesla? Gold? You name it. The Divergent will spot divergences for you on any market and any timeframe.
2. Choose from 2 built-in oscillators
The Basic version of The Divergent comes with 2 built-in oscillators: MACD and RSI
3. Automated detection of Regular Bullish and Regular Bearish divergences
The Basic version of The Divergent can detect two types of divergences: Regular Bullish and Regular Bearish
4. Complete control over every aspect of divergence detection
The Divergent exposes over 40 different settings to allow you fine tune the divergence detection algorithm.
- Oscillator (MACD / RSI)
- Detect Regular Bullish Divergences
- Detect Regular Bearish Divergences
- Pivot Detection Source (Price / Oscillator)
- Source smoothing
- Candle Pivot Detection Mode (Bodies / Wicks)
- Pivot Lookback Right
- Pivot Lookback Left
- Divergence Max. Length
- Divergence Min. Length
- Number of Historic Pivots to Compare
- Pivot Correction
- Restrict Starting Pivot to a Single Divergence
- Allow Early Detection of Divergences
- Line of Sight filter
- Minimum Pivot Change filter
- Pivot Candle Color filter
- Moving Average Filter
- MACD settings
- RSI settings
5. Divergence statistics
6. Fully documented
The Divergent has each and every of its inputs documented via tooltips inside the settings panel. Simply hover your mouse over the ( i ) icon next each the input field to learn more about the purpose of the configuration.
---

The Divergent (Pro) - Advanced Divergence IndicatorAutomated divergence detection with unparalleled customizability for any market on TradingView.
This is the Pro version of The Divergent - Advanced Divergence Indicator .
The Pro version contains everything that is in the Basic version, plus:
1. Access to a 2nd indicator, called "The Divergent's Companion"
By applying the companion indicator to the same chart you have The Divergent on, you will have the divergence lines and labels plotted on your price chart as well:
2. Hidden Divergences
While the Basic version can only detect Regular Divergences, the Pro version can detect both Regular and Hidden Divergences:
3. Seven more oscillators to detect divergences on
The Basic version comes with the two most popular oscillators, the MACD and the RSI.
With the Pro version you get access to 7 more oscillators:
- CMF (Chaikin Money Flow)
- Stochastic RSI
- MFI (Money Flow Index)
- TCI (Trading Channel Index), also known as WaveTrend
- Balance of Power
- CCI (Commodity Channel Index)
- Awesome Oscillator
4. Alerts
With the Pro version you can set up alerts on The Divergent indicator, allowing you to get alerted to one of the following events:
1. Regular Bullish Divergence
2. Hidden Bullish Divergence
3. Regular Bearish Divergence
4. Hidden Bearish Divergence
5. Pivot Low Confirmed
6. Pivot High Confirmed
5. Divergence Verification
The Pro version allows you to measure the quality of the detected divergences.
With divergence verification enabled, The Divergent will tell you how many times a particular divergence "played out", i.e. how many times a bullish or bearish divergence has actually resulted in the change in price in the direction predicted by the divergence. You can configure the price % levels which are used to categorise the divergences as valid or invalid (or unknown).
6. Use the signals in your own Pine Script strategy / indicator
The Pro version comes with access to a Pine Script Library called The Divergent Library .
Just add The Divergent onto the same chart you have your strategy on, link the two together using a "source" input, and use the functions in the library to process the signals from The Divergent :
You can think of The Divergent being a DaaS ( D ivergece a s a S ervice)!
7. Customise the look of the divergence lines and labels
The Pro version allows you to change the style of the divergence lines and labels:
---

Multi-Function RCI(strategic signal,alert and divergence)Japanese below / 日本語説明は下記
Overview
Multi-function RCI indicator with functions below.
1.Multiple signals according to conditions where 3 RCI lines cross
2.Alert when signals triggered
3.Auto divergence drawing
What is RCI?
RCI is one of the oscillator indicators such as RSI and stochastic, measuring overbought/oversold. While RSI and stochastic measures overbought/oversold by price axis, RCI measures by price and time axis.
Please see the details below.
Functions:
1.Multiple signals according to conditions where RCI 3 lines cross
There is two types of signals available in this indicator
A. Overbought/oversold signals
B. Strategic signals
A. Overbought/oversold signals
These signals are displayed when each RCI line crosses upperband/lowerband.
Conditions are as follows:
-RCI(Short) cross over/under upper band
-RCI(Short) cross over/under lower band
-RCI(Middle) cross over/under upper band
-RCI(Middle) cross over/under lower band
-RCI(Long) cross over/under upper band
-RCI(Long) cross over/under lower band
Upper band and lower band can be parameterized.
a. Cross over upper band/Cross under lower band:
These signal are good to judge trend maturity. Once trends get matured, market usually goes into sideways and lead to trend reversal.
b. Cross under upper band/Cross over lower band:
These signal are good to catch trend reversal.
The longer RCI period gets, the bigger price movement gets.
Sample chart
RCI(middle,dark blue) and RCI(Long, magenta) crosses over/under upper band/lower band
B. Strategic signals
Strategic signals are more appropriate to judge timing to enter a trade.
Signals will be appeared when conditions below met with option to select signal sensitivity.
-RCI(Short) crosses over RCI(Middle)
-RCI(Middle) crosses over RCI(Long) and RCI(Long) is below zero line
-RCI(Short) crosses over RCI(Long) and RCI(Long) is below zero line
-RCI(Short) crosses under RCI(Middle)
-RCI(Middle) crosses under RCI(Long) and RCI(Long) is below zero line
-RCI(Short) crosses under RCI(Long) and RCI(Long) is below zero line
With signal sensitivity “Advanced” selected, signals will be displayed when conditions above are met above upper band or below lower band.
Advanced mode is more suitable to aim bigger trend while standard mode is for short term up/down movement.
Signal sensitivity is designed for users to select depending on their trading style(Day trading, swing trading, scalping) and strategy.
Once strategic signals triggered, prepare for trend reversal, observing price action.
The two charts below describe how different signal sensitivity makes.
Sample chart(Standard)
RCI(middle, dark blue) and RCI(long,magenta) cross signals are displayed as an example
Sample chart(Advanced)
RCI(middle, dark blue) and RCI(long,magenta) cross signals are displayed as an example
As you can see, advanced mode is more suitable to aim big movement as RCI cross happens after maximum stretch, while standard is good to catch smaller wave.
2.Alert when signals triggered
Alert can be set with above-mentioned signal conditions.
3.Auto divergence drawing
Divergence line will be automatically drawn as per the logic below.
Also, users can select which RCI line(Short/middle/long) will be targeted to detect divergence.
Bearish : When two consecutive pivot highs go up but RCI values corresponding to each high go down.
Bullish: When two consecutive pivot lows go down but RCI values corresponding to each low go up.
Pivot highs(lows) are identified when those are preceded by n lower highs(lows) and proceeded by n lower highs(lows).
* n is parameterized.
See the diagram below.
How to access this indicator?
This indicator is paid and invited-only indicator.
Please see the instruction below.
Comment section is only for comments on the indicator or updates. Please refrain from contacting me using comments to follow TradingView house rules.
———————————————————————————————————————
多機能RCIインジケーターです。以下の機能が搭載されています。
1.複数タイプのシグナル表示(シグナル感度制御付き)
2.アラート設定
3.ダイバージェンス自動描画
RCIとは?
RCIはRSIやストキャスティクスと同様に買われすぎ・売られすぎを数値化するオシレーター系インジケーターの一つです。
RSIやストキャスティクスが価格軸だけを元に買われすぎ・売られすぎを数値化するのに対して、RCIは価格と時間軸の双方を考慮して買われすぎ・売られすぎを数値化するという違いがあります。
機能詳細は以下の通りです。
機能詳細
1.複数タイプのシグナル表示(シグナル感度制御付き)
3本のRCIとアッパーバンド・ロワーバンドとの交差条件で異なるシグナルを表示することができます。
このインジケーターには以下の2つのタイプのシグナルが存在します。
A. 買われすぎ/売られすぎシグナル
B. ストラテジーシグナル
A. 買われすぎ/売られすぎシグナル
RCIと買われすぎ・売られすぎの水準であるアッパーバンドとロワーバンドとのクロスでシグナルを表示します。
条件:
RCI(短期)がアッパーバンドを上抜いた時または下抜いた時
RCI(短期)がロワーバンドを下抜いた時または上抜いた時
RCI(中期)がアッパーバンドを上抜いた時または下抜いた時
RCI(中期)がロワーバンドを下抜いた時または上抜いた時
RCI(長期)がアッパーバンドを上抜いた時または下抜いた時
RCI(長期)がロワーバンドを下抜いた時または上抜いた時
アッパーバンドとロワーバンドはパラメータ設定可能です。(初期値は80と-80%)
<使い方>
A.アッパーバンドの上抜け/ロワーバンドの下抜け
トレンドの過熱感・成熟度の判断に使用。一般的にはトレンドが成熟しきった後に天井圏や底値圏を形成し、その後トレンド転換が発生します。
b.アッパーバンドの下抜け/ロワーバンドの上抜け
トレンド転換のタイミングを図るのに使用。
サンプルチャート
RCI中期(青)・長期(マゼンタ)が上下バンドを上抜いた時、下抜いた時
B. ストラテジーシグナル
3本のRCIの交差条件で発生するこのシグナルは相場の反転が期待できるシグナルということで、よりトレード機会の判断に向いています。
またシグナル発生の感度を、StandardとAdvancedの二つから選択することができます。
シグナル条件:
<シグナル感度: Standard>
<上昇示唆>
RCI(短期)がRCI(中期)を上抜いた時
RCI(中期)がRCI(長期)を上抜いた時かつ、RCI(長期)がゼロラインより下にある時※
RCI(短期)がRCI(長期)を上抜いた時かつ、RCI(長期)がゼロラインより下にある時
※ノイズを除去するため
<下落示唆>
RCI(短期)がRCI(中期)を下抜いた時
RCI(中期)がRCI(長期)を下抜いた時かつ、RCI(長期)がゼロラインより上にある時
RCI(短期)がRCI(長期)を下抜いた時かつ、RCI(長期)がゼロラインより上にある時
<シグナル感度: Advanced>
Advancedの場合は、RCIがアッパーバンドより上にある状態で上記の条件が満たされるか、ロワーバンドより下にある状態で上記条件が満たされた場合にのみシグナルが表示されます。
Advancedはよりトレンドの転換や大きな波を狙うのに適したものであるのに対し、Standardはより細かい動きを狙うためのシグナルとなるように設計しています。
この辺りの好みはトレードスタイルや狙いに応じて異なるため、トレーダーが各自選択できるように汎用的な作りとなっているのが特徴です。
ストラテジーシグナルが現れたらトレンド転換の可能性に備え、プライスアクションを見ながらトレードタイミングの判断を行います。
以下の二つのチャートでStandardとAdvancedモードで発せられるシグナルの違いが確認できます。
サンプルチャート(Standard モード)
中期RCI(青)と長期RCI(マゼンタ)の交差
サンプルチャート(Advanced モード)
中期RCI(青)と長期RCI(マゼンタ)の交差
AdvancedモードではRCIが最大限伸びたところからの交差を捉えているため、より大きな波を捉えられる一方で、Standardモードではより細かい波を捉えられることが確認できます。
3.ダイバージェンス自動描画機能
以下のロジックに基づきダイバージェンスを自動描画します。(初期表示:非表示)
下降示唆:2つの連続する高値(*)が切り上げられているが、 それぞれの高値に対応するRCIの値は切り下げている場合
上昇示唆:2つの連続する安値(*)が切り下がっているが、 それぞれの安値に対応するRCIは切り上がっている場合
*高値(安値)は、左右n本(**)ずつのローソク足の高値(安値)より高い(低い)高値(安値)をピボットハイ・ローとして算出しています。
** nはユーザ設定値です。
サンプルチャート
高値PL1はPL1の安値より左側にn個のより低い安値、右側にn個のより低い安値があった場合に安値として認識されます。
上記の例では安値がPL1>PL2と切り下がっていますが、対応するRCIの値はvalue1

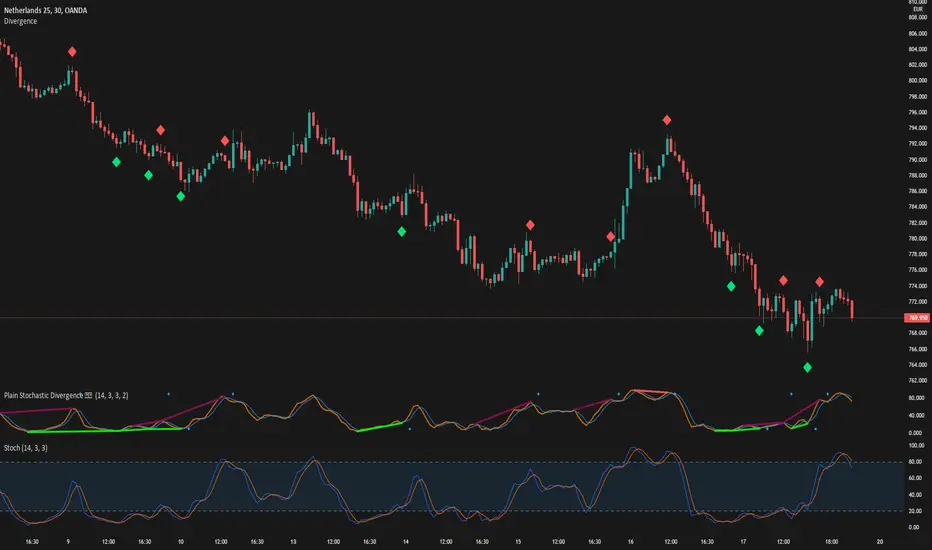
[JL] Stochastic Divergence AlertCompare two cross area:
k is increasing, low is lower and previous k is less than bottom level then it is bottom divergence
k is decrease, high is higher and previous k is more than top level then it is top divergence
With long term moving average(400), seems that Stochastic Divergence is more accurate than RSI Divergence on 1m chart.

TradeChartist Mean Momentum Drift Oscillator (MMDO)™TradeChartist Mean Momentum Drift Oscillator (MMDO) is the Oscillator version of the ™TradeChartist Mean Momentum Drift Bands (MMDB) indicator with some added visual features to spot Momentum, divergences and Price action using ™TradeChartist Zone Visualizer model.
===================================================================================================================
Features of ™TradeChartist MMDO
==============================
Price zone detection using ™TradeChartist Zone Visualizer model.
No User input required.
3 Visual colour schemes - Chilli, Flame and Custom.
Clear Visualization of Overbought and Oversold zones.
Colour Bars based on Momentum strength.
MDDO highs and lows tracker helps detect divergences.
===================================================================================================================
Example Charts
1. MMDO used along with ™TradeChartist MMDB (Mean Momentum Drift Bands) on 4hr chart of BINANCE:BTCUSDT
2. MMDO on 1hr chart of OANDA:EURUSD to confirm Drift Bands breakout entries on MMDB
3. MMDO on 1hr chart of BINANCE:LUNAUSDT
===================================================================================================================
Best Practice: Test with different settings first using Paper Trades before trading with real money
===================================================================================================================

TSI in Dynamic Zones with Divergence and Pivot PointsTrue Strength Index , or TSI is considered a "leading indicator" - in contrast to a "lagging indicator" just as Moving Averages it does not show a confirmation what already happened, but it shows what can happen in the future. For example: The chart is climbing while the TSI oscillator is slowly declining, gets weaker and weaker, maybe even prints bearish divergences? That means that a reversal might be occurring soon. Leading indicators are best paired with Stop and Resistance Lines, General Trendlines , Fib Retracements etc. Your chart is approaching a very important Resistance Trendline but the TSI shows a very positive signal? That means there is a high probability that the Resistance is going to be pushed through and becomes Support in the future.
What are those circles?
-These are Divergences. Red for Regular-Bearish. Orange for Hidden-Bearish. Green for Regular-Bullish. Aqua for Hidden-Bullish.
What are those triangles?
- These are Pivots . They show when the TSI oscillator might reverse, this is important to know because many times the price action follows this move.
What are these blue or orange areas?
- Those are dynamic zones. For the analysis of the TSI its important to know if the indicator is in a state of oversold or overbought to filter out ranging price movement. Normally those zones are static, in this version of the TSI oscillator dynamic zones were added to show a dynamic calculation whether the TSI oscillator is oversold, overbought or ranging.
Please keep in mind that this indicator is a tool and not a strategy, do not blindly trade signals, do your own research first! Use this indicator in conjunction with other indicators to get multiple confirmations.