STRATEGY 1 │ Red Dragon │ Model 1 │ [Titans_Invest]The Red Dragon Model 1 is a fully automated trading strategy designed to operate BTC/USDT.P on the 4-hour chart with precision, stability, and consistency. It was built to deliver reliable behavior even during strong market movements, maintaining operational discipline and avoiding abrupt variations that could interfere with the trader’s decision-making.
Its core is based on a professionally engineered logical structure that combines trend filters, confirmation criteria, and balanced risk management. Every component was designed to work in an integrated way, eliminating noise, avoiding unnecessary trades, and protecting capital in critical moments. There are no secret mechanisms or hidden logic: everything is built to be objective, clean, and efficient.
Even though it is based on professional quantitative engineering, Red Dragon Model 1 remains extremely simple to operate. All logic is clearly displayed and fully accessible within TradingView itself, making it easy to understand for both beginners and experienced traders. The structure is organized so that any user can quickly view entry conditions, exit criteria, additional filters, adjustable parameters, and the full mechanics behind the strategy’s behavior.
In addition, the architecture was built to minimize unnecessary complexity. Parameters are straightforward, intuitive, and operate in a balanced way without requiring deep adjustments or advanced knowledge. Traders have full freedom to analyze the strategy, understand the logic, and make personal adaptations if desired—always with total transparency inside TradingView.
The strategy was also designed to deliver consistent operational behavior over the long term. Its confirmation criteria reduce impulsive trades; its filters isolate noise; and its overall logic prioritizes high-quality entries in structured market movements. The goal is to provide a stable, clear, and repeatable flow—essential characteristics for any medium-term quantitative approach.
Combining clarity, professional structure, and ease of use, Red Dragon Model 1 offers a solid foundation both for users who want a ready-to-use automated strategy and for those looking to study quantitative models in greater depth.
This entire project was built with extreme dedication, backed by more than 14,000 hours of hands-on experience in Pine Script, continuously refining patterns, techniques, and structures until reaching its current level of maturity. Every line of code reflects this long process of improvement, resulting in a strategy that unites professional engineering, transparency, accessibility, and reliable execution.
🔶 MAIN FEATURES
• Fully automated and robust: Operates without manual intervention, ideal for traders seeking consistency and stability. It delivers reliable performance even in volatile markets thanks to the solid quantitative engineering behind the system.
• Multiple layers of confirmation: Combines 10 key technical indicators with 15 adaptive filters to avoid false signals. It only triggers entries when all trend, market strength, and contextual criteria align.
• Configurable and adaptable filters: Each of the 15 filters can be enabled, disabled, or adjusted by the user, allowing the creation of personalized statistical models for different assets and timeframes. This flexibility gives full freedom to optimize the strategy according to individual preferences.
• Clear and accessible logic: All entry and exit conditions are explicitly shown within the TradingView parameters. The strategy has no hidden components—any user can quickly analyze and understand each part of the system.
• Integrated exclusive tools: Includes complete backtest tables (desktop and mobile versions) with annualized statistics, along with real-time entry conditions displayed directly on the chart. These tools help monitor the strategy across devices and track performance and risk metrics.
• No repaint: All signals are static and do not change after being plotted. This ensures the trader can trust every entry shown without worrying about indicators rewriting past values.
🔷 ENTRY CONDITIONS & RISK MANAGEMENT
Red Dragon Model 1 triggers buy (long) or sell (short) signals only when all configured conditions are satisfied. For example:
• Volume:
• The system only trades when current volume exceeds the volume moving average multiplied by a user-defined factor, indicating meaningful market participation.
• RSI:
• Confirms bullish bias when RSI crosses above its moving average, and bearish bias when crossing below.
• ADX:
• Enters long when +DI is above –DI with ADX above a defined threshold, indicating directional strength to the upside (and the opposite conditions for shorts).
• Other indicators (MACD, SAR, Ichimoku, Support/Resistance, etc.)
Each one must confirm the expected direction before a final signal is allowed.
When all bullish criteria are met simultaneously, the system enters Long; when all criteria indicate a bearish environment, the system enters Short.
In addition, the strategy uses fixed Take Profit and Stop Loss targets for risk control:
Currently: TP around 1.5% and SL around 2.0% per trade, ensuring consistent and transparent risk management on every position.
⚙️ INDICATORS
__________________________________________________________
1) 🔊 Volume: Avoids trading on flat charts.
2) 🍟 MACD: Tracks momentum through moving averages.
3) 🧲 RSI: Indicates overbought or oversold conditions.
4) 🅰️ ADX: Measures trend strength and potential entry points.
5) 🥊 SAR: Identifies changes in price direction.
6) ☁️ Cloud: Accurately detects changes in market trends.
7) 🌡️ R/F: Improves trend visualization and helps avoid pitfalls.
8) 📐 S/R: Fixed support and resistance levels.
9)╭╯MA: Moving Averages.
10) 🔮 LR: Forecasting using Linear Regression.
__________________________________________________________
🟢 ENTRY CONDITIONS 🔴
__________________________________________________________
IF all conditions are 🟢 = 📈 Long
IF all conditions are 🔴 = 📉 Short
__________________________________________________________
🚨 CURRENT TRIGGER SIGNAL 🚨
__________________________________________________________
🔊 Volume
🟢 LONG = (volume) > (MA_volume) * (Volume Mult)
🔴 SHORT = (volume) > (MA_volume) * (Volume Mult)
🧲 RSI
🟢 LONG = (RSI) > (RSI_MA)
🔴 SHORT = (RSI) < (RSI_MA)
🟢 ALL ENTRY CONDITIONS AVAILABLE 🔴
__________________________________________________________
🔊 Volume
🟢 LONG = (volume) > (MA_volume) * (Volume Mult)
🔴 SHORT = (volume) > (MA_volume) * (Volume Mult)
🔊 Volume
🟢 LONG = (volume) > (MA_volume) * (Volume Mult) and (close) > (open)
🔴 SHORT = (volume) > (MA_volume) * (Volume Mult) and (close) < (open)
🍟 MACD
🟢 LONG = (MACD) > (Signal Smoothing)
🔴 SHORT = (MACD) < (Signal Smoothing)
🧲 RSI
🟢 LONG = (RSI) < (Upper)
🔴 SHORT = (RSI) > (Lower)
🧲 RSI
🟢 LONG = (RSI) > (RSI_MA)
🔴 SHORT = (RSI) < (RSI_MA)
🅰️ ADX
🟢 LONG = (+DI) > (-DI) and (ADX) > (Treshold)
🔴 SHORT = (+DI) < (-DI) and (ADX) > (Treshold)
🥊 SAR
🟢 LONG = (close) > (SAR)
🔴 SHORT = (close) < (SAR)
☁️ Cloud
🟢 LONG = (Cloud A) > (Cloud B)
🔴 SHORT = (Cloud A) < (Cloud B)
☁️ Cloud
🟢 LONG = (Kama) > (Kama )
🔴 SHORT = (Kama) < (Kama )
🌡️ R/F
🟢 LONG = (high) > (UP Range) and (upward) > (0)
🔴 SHORT = (low) < (DOWN Range) and (downward) > (0)
🌡️ R/F
🟢 LONG = (high) > (UP Range)
🔴 SHORT = (low) < (DOWN Range)
📐 S/R
🟢 LONG = (close) > (Resistance)
🔴 SHORT = (close) < (Support)
╭╯MA2️⃣
🟢 LONG = (Cyan Bar MA2️⃣)
🔴 SHORT = (Red Bar MA2️⃣)
╭╯MA2️⃣
🟢 LONG = (close) > (MA2️⃣)
🔴 SHORT = (close) < (MA2️⃣)
╭╯MA2️⃣
🟢 LONG = (Positive MA2️⃣)
🔴 SHORT = (Negative MA2️⃣)
__________________________________________________________
🎯 TP / SL 🛑
__________________________________________________________
🎯 TP: 1.5 %
🛑 SL: 2.0 %
__________________________________________________________
🪄 UNIQUE FEATURES OF THIS STRATEGY
____________________________________
1) 𝄜 Table Backtest for Mobile.
2) 𝄜 Table Backtest for Computer.
3) 𝄜 Table Backtest for Computer & Annual Performance.
4) 𝄜 Live Entry Conditions.
1) 𝄜 Table Backtest for Mobile.
2) 𝄜 Table Backtest for Computer.
3) 𝄜 Table Backtest for Computer & Annual Performance.
4) 𝄜 Live Entry Conditions.
_____________________________
𝄜 BACKTEST / PERFORMANCE 𝄜
_____________________________
• Net Profit: +634.47%, Maximum Drawdown: -18.44%.
🪙 PAIR / TIMEFRAME ⏳
🪙 PAIR: BINANCE:BTCUSDT.P
⏳ TIME: 4 hours (240m)
✅ ON ☑️ OFF
✅ LONG
✅ SHORT
🎯 TP / SL 🛑
🎯 TP: 1.5 (%)
🛑 SL: 2.0 (%)
⚙️ CAPITAL MANAGEMENT
💸 Initial Capital: 10000 $ (TradingView)
💲 Order Size: 10 % (Of Equity)
🚀 Leverage: 10 x (Exchange)
💩 Commission: 0.03 % (Exchange)
📆 BACKTEST
🗓️ Start: Setember 24, 2019
🗓️ End: November 21, 2025
🗓️ Days: 2250
🗓️ Yers: 6.17
🗓️ Bars: 13502
📊 PERFORMANCE
💲 Net Profit: + 63446.89 $
🟢 Net Profit: + 634.47 %
💲 DrawDown Maximum: - 10727.48 $
🔴 DrawDown Maximum: - 18.44 %
🟢 Total Closed Trades: 1042
🟡 Percent Profitable: 63.92 %
🟡 Profit Factor: 1.247
💲 Avg Trade: + 60.89 $
⏱️ Avg # Bars in Trades
🕯️ Avg # Bars: 4
⏳ Avg # Hrs: 15
✔️ Trades Winning: 666
❌ Trades Losing: 376
✔️ Maximum Consecutive Wins: 11
❌ Maximum Consecutive Losses: 7
📺 Live Performance : br.tradingview.com
• Use this strategy on the recommended pair and timeframe above to replicate the tested results.
• Feel free to experiment and explore other settings, assets, and timeframes.
Cryptotrading

EMA Pullback Speed Strategy 📌 **Overview**
The **EMA Pullback Speed Strategy** is a trend-following approach that combines **price momentum** and **Exponential Moving Averages (EMA)**.
It aims to identify high-probability entry points during brief pullbacks within ongoing uptrends or downtrends.
The strategy evaluates **speed of price movement**, **relative position to dynamic EMA**, and **candlestick patterns** to determine ideal timing for entries.
One of the key concepts is checking whether the price has **“not pulled back too much”**, helping focus only on situations where the trend is likely to continue.
⚠️ This strategy is designed for educational and research purposes only. It does not guarantee future profits.
🧭 **Purpose**
This strategy addresses the common issue of **"jumping in too late during trends and taking unnecessary losses."**
By waiting for a healthy pullback and confirming signs of **trend resumption**, traders can enter with greater confidence and reduce false entries.
🎯 **Strategy Objectives**
* Enter in the direction of the prevailing trend to increase win rate
* Filter out false signals using pullback depth, speed, and candlestick confirmations
* Predefine Take-Profit (TP) and Stop-Loss (SL) levels for safer, rule-based trading
✨ **Key Features**
* **Dynamic EMA**: Reacts faster when price moves quickly, slower when market is calm – adapting to current momentum
* **Pullback Filter**: Avoids trades when price pulls back too far (e.g., more than 5%), indicating a trend may be weakening
* **Speed Check**: Measures how strongly the price returns to the trend using candlestick body speed (open-to-close range in ticks)
📊 **Trading Rules**
**■ Long Entry Conditions:**
* Current price is above the dynamic EMA (indicating uptrend)
* Price has pulled back toward the EMA (a "buy the dip" situation)
* Pullback depth is within the threshold (not excessive)
* Candlesticks show consecutive bullish closes and break the previous high
* Price speed is strong (positive movement with momentum)
**■ Short Entry Conditions:**
* Current price is below the dynamic EMA (indicating downtrend)
* Price has pulled back up toward the EMA (a "sell the rally" setup)
* Pullback is within range (not too deep)
* Candlesticks show consecutive bearish closes and break the previous low
* Price speed is negative (downward momentum confirmed)
**■ Exit Conditions (TP/SL):**
* **Take-Profit (TP):** Fixed 1.5% target above/below entry price
* **Stop-Loss (SL):** Based on recent price volatility, calculated using ATR × 4
💰 **Risk Management Parameters**
* Symbol & Timeframe: BTCUSD on 1-hour chart (H1)
* Test Capital: \$3000 (simulated account)
* Commission: 0.02%
* Slippage: 2 ticks (minimal execution lag)
* Max risk per trade: 5% of account balance
* Backtest Period: Aug 30, 2023 – May 9, 2025
* Profit Factor (PF): 1.965 (Net profit ÷ Net loss, including spreads & fees)
⚙️ **Trading Parameters & Indicator Settings**
* Maximum EMA Length: 50
* Accelerator Multiplier: 3.0
* Pullback Threshold: 5.0%
* ATR Period: 14
* ATR Multiplier (SL distance): 4.0
* Fixed TP: 1.5%
* Short-term EMA: 21
* Long-term EMA: 50
* Long Speed Threshold: ≥ 1000.0 (ticks)
* Short Speed Threshold: ≤ -1000.0 (ticks)
⚠️Adjustments are based on BTCUSD.
⚠️Forex and other currency pairs require separate adjustments.
🔧 **Strategy Improvements & Uniqueness**
Unlike basic moving average crossovers or RSI triggers, this strategy emphasizes **"momentum-supported pullbacks"**.
By combining dynamic EMA, speed checks, and candlestick signals, it captures trades **as if surfing the wave of a trend.**
Its built-in filters help **avoid overextended pullbacks**, which often signal the trend is ending – making it more robust than traditional trend-following systems.
✅ **Summary**
The **EMA Pullback Speed Strategy** is easy to understand, rule-based, and highly reproducible – ideal for both beginners and intermediate traders.
Because it shows **clear visual entry/exit points** on the chart, it’s also a great tool for practicing discretionary trading decisions.
⚠️ Past performance is not a guarantee of future results.
Always respect your Stop-Loss levels and manage your position size according to your risk tolerance.

DCA Alpha 1.0 Trading Tool for Dollar-Cost Averaging
Description:
DCA Alpha 1.0 is a precision-engineered trading tool designed to assist traders and investors in accumulating assets during market downturns. Using proprietary algorithms that combine momentum decay, extreme price deviation metrics, trend dynamics, divergence analysis, and mean regression, it identifies potential bottom extreme zones in various asset classes such as indices, stocks, crypto, and commodities.
This indicator highlights market conditions where assets are oversold, undervalued, or experiencing capitulation—providing disciplined, unleveraged dollar-cost averaging (DCA) opportunities. Ideal for long-term growth strategies, DCA Alpha 1.0 helps cut through market noise, pinpointing moments of peak fear and maximum reward potential.
Whether navigating volatile crypto markets, timing corrections in indices, or accumulating commodities, DCA Alpha 1.0 serves as a vital tool for mastering the art of buying low and building your assets up strategically.
Instructions:
Getting Started:
Add the Indicator:
Install DCA Alpha 1.0 on your TradingView chart.
Select your preferred asset class: stocks, indices, crypto, or commodities.
Choose an appropriate timeframe (e.g., daily or weekly for long-term DCA strategies).
Customize Inputs: Adjust the following settings to align with your strategy:
Percentage of Equity to Trade: Define the portion of your portfolio to allocate per signal (default: 1% equity).
Profit Target Percentages: Set thresholds for locking in gains (default: 50% on lower timeframes, 500% on higher timeframes).
Zones and Signals:
Extreme Negative Zones:
What It Represents:
These zones highlight conditions where prices are deeply oversold, indicating extreme bearish sentiment. The market is likely nearing a bottom, offering high-probability buying opportunities.
Entry Signals:
When the price enters these extreme negative zones, visual markers (e.g., green triangles or other indicators) will signal a potential buying opportunity. These moments are indicative of market exhaustion, signaling that a reversal could be imminent.
Momentum Decay & Divergence:
Momentum decay occurs when price movement slows over time. In extreme negative zones, if prices continue to fall but at a diminishing rate (e.g., decreased volume or a fading oscillator), it suggests weakening bearish momentum. This, coupled with bullish divergence (oscillator forming higher lows while price makes lower lows), signifies a reversal, making it an ideal point to consider dollar-cost averaging into the asset.
Neutral Zones:
What It Represents:
The neutral zone is a state of market equilibrium, where prices are neither overbought nor oversold. The market is in a balanced state, with no strong trend emerging.
Mean Regression:
In a neutral zone, the market is reverting to its mean or average price after overreacting in either direction. A price transition from extreme zones (overbought/oversold) to the neutral zone suggests a reversion to the market's long-term average, making this a period of reduced volatility and uncertainty.
Entering or Exiting Neutral Zones:
Traders should avoid entering or exiting positions during neutral zone conditions unless transitioning from an extreme zone (negative or positive). Transitioning from an extreme negative zone to neutral may suggest an opportunity to accumulate assets gradually, while a shift from neutral to an extreme negative zone may indicate a deeper correction and warrant caution.
Momentum Decay & Divergence (Exiting Neutral Zone):
If prices are rising but the oscillator shows lower highs (bearish divergence), and momentum is fading, this could signal a pullback. A transition out of the neutral zone in this context may prompt traders to hold off on new positions or consider profit-taking.
Extreme Positive Zones:
What It Represents:
Markets can also become overbought or overvalued. When price enters extreme positive zones, the asset may be overvalued, suggesting potential selling or a waiting period.
Exit Signals:
Red triangle indicators signal potential exit points when prices reach overbought conditions, signaling a time to lock in profits and reduce exposure.
Momentum Decay & Divergence (Exiting Positive Zone):
When prices are making new highs but momentum is weakening (momentum decay) and the oscillator is showing lower highs (bearish divergence), this could indicate a faltering rally. Such conditions represent an ideal time to reduce exposure or exit positions.
Key Inputs for Customization:
Percentage of Equity to Trade:
This setting allows you to allocate a portion of your total portfolio per buy signal. By default, 1% of equity is used per signal, but this can be adjusted based on your risk tolerance and strategy.
Profit Target Percentages:
These thresholds help lock in gains once the price moves a set percentage in your favor.
Lower Timeframes: Default profit target of 50%.
Higher Timeframes: Default profit target of 500%.
These settings can be customized for specific risk/reward preferences.
Warning!!! : Aggressive Mode
Aggressive Mode is an advanced feature designed for traders who want to increase the frequency of signals during periods of market volatility. This mode will trigger more frequent entries, even into slightly less extreme zones, capturing short-term reversals.
What Aggressive Mode Does:
It amplifies signals by allowing the tool to identify more frequent price reversals, including brief market corrections, increasing trade frequency. While this can offer more trading opportunities, it also exposes you to higher risk.
Warning:
Aggressive Mode should be used only by experienced traders familiar with short-term volatility. The increased frequency of signals could lead to higher risk exposure. Ensure robust risk management practices, such as stop-loss orders and profit-taking strategies, are in place before activating this mode.
Default Setting:
Aggressive Mode is disabled by default. It can be activated at your discretion based on your experience level and risk appetite.
Best Practices:
Focus on High-Quality Assets: Prioritize assets with strong recovery potential (e.g., major indices, blue-chip cryptocurrencies).
Use Longer Timeframes: Minimize market noise and optimize your DCA strategy by focusing on higher timeframes (e.g., daily or weekly charts).
Review Trading Inputs: Regularly adjust your inputs to ensure they align with your financial goals and risk tolerance.
Implement Risk Management: Use stop-loss orders and profit targets to manage risk, especially when using Aggressive Mode.
Disclaimer:
DCA Alpha 1.0 is designed specifically for unleveraged, long-term dollar-cost averaging strategies. It is not intended for day trading or leveraged positions. The tool excels at identifying market dips but cannot guarantee success. Users are fully responsible for their own risk management, including the use of stop-losses, profit targets, and position sizing.
Aggressive Mode increases trade frequency and may lead to higher exposure and potential losses. Only experienced traders should consider using this mode. Always understand the risks involved before incorporating this tool into your trading strategy.

Token Metrics IndicatorThe Token Metrics Combined Indicator v2 is a comprehensive technical analysis tool designed to output Long/Short signals for crypto assets on TradingView. It combines multiple indicators, including Token Metrics Clouds, Token Metrics Trend Lines , Token Metrics Channels, and signals, to give a comprehensive outlook on the market trend and potential entry/exit points.
Users can backtest the signals to understand the strategy's historical performance, learn how to use it, identify its pros and cons, and determine the market conditions it best suits. It is important to note that the backtesting performance does not indicate future results.
The methods for calculating fixed stop-losses vary depending on the trading pattern. A fixed stop-loss is used for long-term trading, while a trading stop-loss is used for high-frequency trading. This provides flexible investment risk management, allowing you to assign different stop-loss percentages to different trading strategies.
The Length input allows users to control the indicator’s sensitivity, with a default value of 20 bars for long-term trading and 9 bars for high-frequency trading. The Adjustment Factor input has a default value of 0.1 and can be adjusted to adapt to changing levels of volatility . The Stop-loss input allows users to control their risk tolerance, with a default value of 8% for long-term trading and 2% for high-frequency trading.
Token Metrics Clouds incorporates a bullish / bearish trend indicator, which uses two adaptive moving averages that adapt to volatility , reducing false trend signals during range-bound environments and providing a more accurate representation of market trends.
The Token Metrics Trendline is a long-term indicator that uses an adaptive moving average to identify long-term trends. This can also be used for long-term resistance and support levels, providing a comprehensive overview of the current market situation for both long-term and high-frequency traders.
The Token Metrics Signals indicator provides long, short, and close signals, indicating when to enter and exit long or short positions based on the TM trend-following strategy.
The Token Metrics Channels indicator is a top/bottom indicator that adjusts to current levels of volatility . This uses adaptive Donchian channels to determine the previous short-term swing high and low, providing insight into where short-term resistance or support might be forming and where breakouts can occur. The look-back periods change according to the strategy time frame, offering a flexible and dynamic approach to market analysis.
Long-term trading is a trend-following strategy best suited for daily and weekly timeframes. This strategy works well in trending markets but may produce false signals in choppy or range-bound markets.
High-frequency trading is a mean-reverting strategy best suited for 15-minute, 30-minute, and 1-hour timeframes. This strategy performs well in choppy or range-bound markets but may not be effective in strong trending markets.

Rocket Grid Algorithm - The Quant ScienceThe Rocket Grid Algorithm is a trading strategy that enables traders to engage in both long and short selling strategies. The script allows traders to backtest their strategies with a date range of their choice, in addition to selecting the desired strategy - either SMA Based Crossunder or SMA Based Crossover.
The script is a combination of trend following and short-term mean reversing strategies. Trend following involves identifying the current market trend and riding it for as long as possible until it changes direction. This type of strategy can be used over a medium- to long-term time horizon, typically several months to a few years.
Short-term mean reversing, on the other hand, involves taking advantage of short-term price movements that deviate from the average price. This type of strategy is usually applied over a much shorter time horizon, such as a few days to a few weeks. By rapidly entering and exiting positions, the strategy seeks to capture small, quick gains in volatile market conditions.
Overall, the script blends the best of both worlds by combining the long-term stability of trend following with the quick gains of short-term mean reversing, allowing traders to potentially benefit from both short-term and long-term market trends.
Traders can configure the start and end dates, months, and years, and choose the length of the data they want to work with. Additionally, they can set the percentage grid and the upper and lower destroyers to manage their trades effectively. The script also calculates the Simple Moving Average of the chosen data length and plots it on the chart.
The trigger for entering a trade is defined as a crossunder or crossover of the close price with the Simple Moving Average. Once the trigger is activated, the script calculates the total percentage of the side and creates a grid range. The grid range is then divided into ten equal parts, with each part representing a unique grid level. The script keeps track of each grid level, and once the close price reaches the grid level, it opens a trade in the specified direction.
The equity management strategy in the script involves a dynamic allocation of equity to each trade. The first order placed uses 10% of the available equity, while each subsequent order uses 1% less of the available equity. This results in the allocation of 9% for the second order, 8% for the third order, and so on, until a maximum of 10 open trades. This approach allows for risk management and can help to limit potential losses.
Overall, the Rocket Grid Algorithm is a flexible and powerful trading strategy that can be customized to meet the specific needs of individual traders. Its user-friendly interface and robust backtesting capabilities make it an excellent tool for traders looking to enhance their trading experience.

Macro Score - Dem. Fib. McGinley DynamicsA "macro score", as defined here, is created by giving various weights to different signals and adding them together to get one smooth score. Positive or negative values are assigned to each of the signals depending on if the statement is true or false (e.g. DPO > 0: +1, DPO < 0: -1). This manner of strategy allows for a subset of the available signals to be present at one time as opposed to every technical signal having to be active in order for a long/short signal to trigger.
The DFMG - Democratic Fibonacci McGinley Dynamic - is a separate indicator that we have released that takes 10 different Fibonacci McGinley Dynamics (lengths of 3 to 233, at Fibonacci intervals) and averages them to form the DFMG line. This helps by creating a consensus on the trend based on these dynamic lines alone. Crossovers of the DFMG with the various McGinley lengths as well as a cross of the price source and these lines can provide adequate long and short signals.
This strategy has the signals and weights pre-determined in the code. Heaviest weights have been given to crosses of the DFMG line/McGinley(233) as well as the crosses of the McGinley(3)/DFMG. Additionally, there are thresholds for DPO ( Detrended Price Oscillator , above or below 0), CMO ( Chande Momentum Oscillator , above or below 0), Jurik Volatility Bands (above or below 0), and Stoch RSI (above or below 50). These four signals hold a lighter weight than the McGinley cross signals.
The macro score itself is printed in an underlay as a white line that goes between -10 and 10 for this strategy. In addition to the macro score line, a green momentum line (sourced by the macro score itself) has been included. A crossover/crossunder of the macro score and the macro momentum line is included into the long/short signal syntax in addition to long and short thresholds for the macro score, defaulted to 5 and -5 respectively.
Take profit, stop loss, and trailing percentages are also included, found at the bottom of the Input tab under “TT and TTP” as well as “Stop Loss”. Make sure to understand the TP/SL ratio that you desire before use, as the desired hit rate/profitability percentage will be affected accordingly. The option for adding in a trailing stop has also been included, with options to choose between an ATR-based trail or a percentage-based trail.
This strategy does NOT guarantee future returns. Apply caution in trading regardless of discretionary or algorithmic. Understand the concepts of risk/reward and the intricacies of each strategy choice before utilizing them in your personal trading.
Profitview/Pineconnector Settings:
If you wish to utilize Profitview’s automation system, find the included “Profitview Settings” under the Input tab of the strategy settings menu. If not, skip this section entirely as it can be left blank. Options will be “OPEN LONG TITLE”, “OPEN SHORT TITLE”, “CLOSE LONG TITLE”, and “CLOSE SHORT TITLE”. If you wished to trade SOL, for example, you would put “SOL LONG”, “SOL SHORT”, “SOL CLOSE LONG”, and “SOL CLOSE SHORT” in these areas. Within your Profitview extension, ensure that your Alerts all match these titles. To set an alert for use with Profitview, go to the “Alerts” tab in TradingView, then create an alert. Make sure that your desired asset and timeframe are currently displayed on your screen when creating the alert. Under the “Condition” option of the alert, select the strategy, then select the expiration time. If using TradingView Premium, this can be open-ended. Otherwise, select your desired expiration time and date. This can be updated whenever desired to ensure the strategy does not expire. Under “Alert actions”, nothing necessarily needs to be selected unless so desired. Leave the “Alert name” option empty. For the “Message”, delete the generated message and replace it with {{strategy.order.alert_message}} and nothing else. If using Pineconnector, follow the same directions for setting up an alert, but use the " ,buy, ,risk=" syntax as noted in the tooltips.
Default Properties for AVAX 20M:
DPO - 35 , uncentered
CMO - 25, open
K/D - 3/3
RSI Stoch Length - 3
Stoch Length - 4
Stoch Source - open
JVB Length - 14
JVB Smoothing - 2
DFMG source - close
Macro Length - 14
TP % - 1.5%
TTP % - 0.005%
SL % - 1.8%, no trail

Ichimoku Cloud and ADX with Trailing Stop Loss (by Coinrule)The Ichimoku Cloud is a collection of technical indicators that show support and resistance levels, as well as momentum and trend direction. It does this by taking multiple averages and plotting them on a chart. It also uses these figures to compute a “cloud” that attempts to forecast where the price may find support or resistance in the future.
The Ichimoku Cloud was developed by Goichi Hosoda, a Japanese journalist, and published in the late 1960s. It provides more data points than the standard candlestick chart. While it seems complicated at first glance, those familiar with how to read the charts often find it easy to understand with well-defined trading signals.
The Ichimoku Cloud is composed of five lines or calculations, two of which comprise a cloud where the difference between the two lines is shaded in.
The lines include a nine-period average, a 26-period average, an average of those two averages, a 52-period average, and a lagging closing price line.
The cloud is a key part of the indicator. When the price is below the cloud, the trend is down. When the price is above the cloud, the trend is up.
The above trend signals are strengthened if the cloud is moving in the same direction as the price. For example, during an uptrend, the top of the cloud is moving up, or during a downtrend, the bottom of the cloud is moving down.
DMI is simple to interpret. When +DI > - DI, it means the price is trending up. On the other hand, when -DI > +DI, the trend is weak or moving on the downside. The ADX does not give an indication of the direction but about the strength of the trend.
Typically values of ADX above 25 mean that the trend is steeply moving up or down, based on the -DI and +DI positioning. This script aims to capture swings in the DMI, and thus, in the trend of the asset, using a contrarian approach.
Trading on high values of ADX, the strategy tries to spot extremely oversold and overbought conditions. Values of ADX above 45 may suggest that the trend has overextended and is maybe about to reverse.
This strategy combines the Ichimoku Cloud with the ADX indicator to better enter trades.
Long orders are placed when these basic signals are triggered.
Long Position:
Tenkan-Sen is above the Kijun-Sen
Chikou-Span is above the close of 26 bars ago
Close is above the Kumo Cloud
MACD line crosses over the signal line
-DI is greater than +DI
ADX is greater than 45
Close Position:
3% increase trailing
3% decrease trailing
The script is backtested from December 2022 and provides good returns.
A trading fee of 0.1% is also taken into account and is aligned to the base fee applied on Binance.

Trend Follower Intraday [ Adjustable TF ]Trend Follower Intraday for 3 minute Time-Frame (Adjustable) , that has the time condition for Indian Markets as well.
Unlike the Free Scripts - Risk Management , Position Sizing , Partial Exit etc. are also included .
Send us a Message to know more about the strategy.
// ══════════════════════════════════════════════════════════════════════════ //
The Timing can be changed to fit other markets, scroll down to "TIME CONDITION" to know more.
The commission is also included in the strategy .
The basic idea is when ,
1) EMA1 crosses above EMA2 , is a Long condition .
2) EMA1 crosses below EMA2 , is a Short condition .
3) Green Section indicates Long position.
4) Red Section indicates Short position.
5) Allowed hours specifies the trade entry timing.
6) ATR STOP is the stop-loss value on chart , can be adjusted in INPUTS.
7) Target 1 is the 1st target value on chart , can be adjusted in INPUTS.
8) RISK is Maximum Risk per trade for the intraday trade can be changed .
9) Total Capital used can be adjusted under INPUTS.
10) ATR TRAIL is used for trailing after entry, as mentioned in the inputs below.
11) Check trades under the list of trades .
12) Trade only in liquid stocks .
13) Risk only 1-5% of total capital.
14) Inputs can be changed for better back-test results, but also manually check the trades before setting alerts
15) SQUARE OFF TIME - As you change the time frame , also change the square-off time to the candle's closing time.
Eg: For 3min Time-frame , Hour = 2Hrs | Minute = 57min
16) Strategy stops for the day if you have a loss .
17) COMMISSION value is set to 20Rs and SLIPPAGE value is set to 2 . Go to properties to change it .
*The input values and the results are mentioned under "BACKTEST RESULTS" below*
// ══════════════════════════════ //
// ————————> RISK MANAGEMENT <——————— //
// ══════════════════════════════ //
Risk management is done based on max loss per trade and can be adjusted in the INPUTS.
// ═══════════════════════════ //
// ————————> POSITION SIZE <——————— //
// ═══════════════════════════ //
Quantity of each trade is different based on the loss
// ═════════════════════════ //
// ————————> PROPERTIES <——————— //
// ═════════════════════════ //
COMMISSION , SLIPPAGE ,RECALCULATE is already mentioned in the code.
COMMISSION can be charges , based on the broker charges.
// ═══════════════════════════════//
// ————————> TIME CONDITION <————————— //
// ═══════════════════════════════//
The time can be changed in the INPUT.
The Indian Markets open at 9:15am and closes at 3:30pm.
The 'Allowed hours' under Inputs specifies the time at which Entries should happen .
"Close All" function closes all the trades before 3pm , at the open of the next candle.
To change the time to close all trades , check INPUT.
All open trades get closed by 3pm , because some brokers don't allow you to place fresh intraday orders after 3pm .
// ═══════════════════════════════════════════════ //
// ————————> BACKTEST RESULTS ( 123 CLOSED TRADES ) <————————— //
// ═══════════════════════════════════════════════ //
INPUTS can be changed for better Back-Test results.
The strategy applied to NSE:JSWENERGY (3 min Time-Frame and with a capital of 3,00,000 ) gives us 81% profitability , as shown below
It was tested for a period a 6 months with a Profit Factor of 1.957 ,net Profit of 43,000Rs .
Sharpe Ratio = 0.745
Sortino Ratio = 2.091
No strategy in the world promises 100% profits in all market conditions , so always define your risk before trading.
Also check Back-Test results manually ,before setting Alerts
The Graph has a Linear Curve with Consistent Profits.
The INPUTS are as follows,
1) EMA1 ————————————————> 38
2) EMA2 ————————————————> 118
3) ALLOWED HRS ———————————> 9:35 TO 14:30
4) ATR STOP ——————————————> 3.2
5) RISK ——————————————————> 3000
6) ATR TRAIL ———————————————> 2.6
7) TARGET 1 ————————————————> 2.4
8) MAX POSITION VALUE ——————————> 3,00,000
8) MAX DRAWDOWN —————————————> 9,000
8) SQUARE-OFF ————————————————> 14:57
NSE:JSWENERGY
Apply it to your charts Now !
NSE:JSWENERGY
Send us a message for FREE TRIALS | Instant Access
Thank You ☺

Ichimoku Cloud with ADX (By Coinrule)The Ichimoku Cloud is a collection of technical indicators that show support and resistance levels, as well as momentum and trend direction. It does this by taking multiple averages and plotting them on a chart. It also uses these figures to compute a “cloud” that attempts to forecast where the price may find support or resistance in the future.
The Ichimoku Cloud was developed by Goichi Hosoda, a Japanese journalist, and published in the late 1960s. It provides more data points than the standard candlestick chart. While it seems complicated at first glance, those familiar with how to read the charts often find it easy to understand with well-defined trading signals.
The Ichimoku Cloud is composed of five lines or calculations, two of which comprise a cloud where the difference between the two lines is shaded in.
The lines include a nine-period average, a 26-period average, an average of those two averages, a 52-period average, and a lagging closing price line.
The cloud is a key part of the indicator. When the price is below the cloud, the trend is down. When the price is above the cloud, the trend is up.
The above trend signals are strengthened if the cloud is moving in the same direction as the price. For example, during an uptrend, the top of the cloud is moving up, or during a downtrend, the bottom of the cloud is moving down.
DMI is simple to interpret. When +DI > - DI, it means the price is trending up. On the other hand, when -DI > +DI , the trend is weak or moving on the downside. The ADX does not give an indication about the direction but about the strength of the trend.
Typically values of ADX above 25 mean that the trend is steeply moving up or down, based on the -DI and +D positioning. This script aims to capture swings in the DMI, and thus, in the trend of the asset, using a contrarian approach.
Trading on high values of ADX , the strategy tries to spot extremely oversold and overbought conditions. Values of ADX above 45 may suggest that the trend has overextended and is may be about to reverse.
This strategy combines the Ichimoku Cloud with the ADX indicator to better enter trades.
Long/Short orders are placed when these basic signals are triggered.
Long Position:
Tenkan-Sen is above the Kijun-Sen
Chikou-Span is above the close of 26 bars ago
Close is above the Kumo Cloud
MACD line crosses over the signal line
-DI is greater than +DI
ADX is greater than 45
Short Position:
Tenkan-Sen is below the Kijun-Sen
Chikou-Span is below the close of 26 bars ago
Close is below the Kumo Cloud
MACD line crosses under the signal line
+DI is greater than -DI
ADX is less than 45
The script is backtested from 1 January 2022 and provides good returns.
The strategy assumes each order is using 30% of the available coins to make the results more realistic and to simulate you only ran this strategy on 30% of your holdings. A trading fee of 0.1% is also taken into account and is aligned to the base fee applied on Binance.
This script also works well on MATIC (15m timeframe), ETH (5m timeframe), and SOL (15m timeframe).

Ichimoku Cloud with MACD (By Coinrule)The Ichimoku Cloud is a collection of technical indicators that show support and resistance levels, as well as momentum and trend direction. It does this by taking multiple averages and plotting them on a chart. It also uses these figures to compute a “cloud” that attempts to forecast where the price may find support or resistance in the future.
The Ichimoku Cloud was developed by Goichi Hosoda, a Japanese journalist, and published in the late 1960s. It provides more data points than the standard candlestick chart. While it seems complicated at first glance, those familiar with how to read the charts often find it easy to understand with well-defined trading signals.
The Ichimoku Cloud is composed of five lines or calculations, two of which comprise a cloud where the difference between the two lines is shaded in.
The lines include a nine-period average, a 26-period average, an average of those two averages, a 52-period average, and a lagging closing price line.
The cloud is a key part of the indicator. When the price is below the cloud, the trend is down. When the price is above the cloud, the trend is up.
The above trend signals are strengthened if the cloud is moving in the same direction as the price. For example, during an uptrend, the top of the cloud is moving up, or during a downtrend, the bottom of the cloud is moving down.
The MACD is a trend following momentum indicator and provides identification of short-term trend direction. In this variation it utilises the 12-period as the fast and 26-period as the slow length EMAs, with signal smoothing set at 9.
This strategy combines the Ichimoku Cloud with the MACD indicator to better enter trades.
Long/Short orders are placed when three basic signals are triggered.
Long Position:
Tenkan-Sen is above the Kijun-Sen
Chikou-Span is above the close of 26 bars ago
Close is above the Kumo Cloud
MACD line crosses over the signal line
Short Position:
Tenkan-Sen is below the Kijun-Sen
Chikou-Span is below the close of 26 bars ago
Close is below the Kumo Cloud
MACD line crosses under the signal line
The script is backtested from 1 June 2022 and provides good returns.
The strategy assumes each order is using 30% of the available coins to make the results more realistic and to simulate you only ran this strategy on 30% of your holdings. A trading fee of 0.1% is also taken into account and is aligned to the base fee applied on Binance.
This script also works well on MATIC (1h timeframe), AVA (45m timeframe), and BTC (30m timeframe).

Short Term RSI and SMA Percentage ChangeThis strategy utilises common indicators like RSI and moving averages in order to enter and exit trades. The Relative Strength Index (RSI) is a momentum indicator that has a value between 0 and 100, where a value greater than 70 is considered overbought and a value less than 30 is oversold. If the RSI value is above or below these values, then it can signal a possible trend reversal.
The second indicator used in this strategy is the Simple Moving Average (SMA). A SMA is an arithmetic moving average calculated by adding recent prices and then dividing that figure by the number of time periods in the calculation average. For example, one could add the closing price of a coin for a number of time periods and then divide this total by that same number of periods. Short-term averages respond quickly to changes in the price of the underlying coin, while long-term averages are slower to react.
Long/Exit orders are placed when three basic signals are triggered.
Long Position:
RSI is greater than 50
MA9 is greater than MA100
MA9 increases by 6%
Exit Position:
Price increases 5% trailing
Price decreases 5% trailing
The script is backtested from 1 May 2022 and provides good returns.
A trading fee of 0.1% is also taken into account and is aligned to the base fee applied on Binance.
This script also works well on AVAX 45m/1h, MATIC 15m/45m/1h and ETH 4h.

Mean Reverse Grid Algorithm - The Quant ScienceMean Reverse Grid Algorithm - The Quant Science™ is a dynamic grid algorithm that follows the trend and run a mean reverting strategy on average percentage yield variation.
DESCRIPTION
Trades on different price levels of the grid, following the trend. The grid consists of 10 levels, 5 higher and 5 lower. The grids together create a channel, this channel represents the total percentage change where the algorithm works. The channel also represents the average change yields of the asset, identified during analysis with the "Yield Trend Indicator".
The algorithm can be set long or short.
1. Long algorithm: opens long positions with 20% of the capital every time the price crossunder a lower grid, for a maximum total of 5 simultaneous trades. Trades are closed each time the price crossover a higher grid.
2. Short algorithm: opens short positions with 20% of the capital every time the price crossover a higher grid, for a maximum total of 5 simultaneous trades. Trades are closed each time the price crossunder a lower grid.
USER INTERFACE SETTING
The user configures the percentage value of each grid from the user interface.
AUTO TRADING COMPLIANT
With the user interface, the trader can easily set up this algorithm for automatic trading. Automating it is very simple, activate the alert functions and enter the links generated by your broker.
BACKTESTING INCLUDED
With the user interface, the trader can adjust the backtesting period of the strategy before putting it live. You can analyze large periods such as years or months or focus on short-term periods.
NO LIMIT TIMEFRAME
This algorithm can be used on all timeframes and is ideal for lower timeframes.
GENERAL FEATURES
Multi-strategy: the algorithm can apply either the long strategy or the short strategy.
Built-in alerts: the algorithm contains alerts that can be customized from the user interface.
Integrated grid: the grid indicator is included.
Backtesting included: automatic backtesting of the strategy is generated based on the values set.
Auto-trading compliant: functions for auto trading are included.
ABOUT BACKTESTING
Backtesting refers to the period 1 August 2022 - today, ticker: ETH/USDT, timeframe 1H.
Initial capital: $1000.00
Commission per trade: 0.03%

DCA Average Arbitrage - The Quant ScienceDCA Average Arbitrage - The Quant Science™ is a quantitative algorithm based on a DCA model that uses averaging to create a statistical arbitrage system.
DESCRIPTION
The algorithm can be set long or short.
1. Long algorithm: opens long positions with 100% of the capital every time the price deviates negatively for a certain percentage distance from the average.
2. Short algorithm: opens short positions with 100% of capital every time the price deviates positively for a certain percentage distance from the average.
The closing of positions depends on the parameters activated by the user. The user can set the closing on the reverse condition and/or add functions such as stop loss, take profit and closing after a certain bar period.
USER INTERFACE SETTING
The user chooses the long or short direction and sets the parameters for average as length, source and percent distance.
AUTO TRADING COMPLIANT
With the user interface, the trader can easily set up this algorithm for automatic trading. Automating it is very simple, activate the alert functions and enter the links generated by your broker.
BACKTESTING INCLUDED
With the user interface, the trader can adjust the backtesting period of the strategy before putting it live. You can analyze large periods such as years or months or focus on short-term periods.
NO LIMIT TIMEFRAME
This algorithm can be used on all timeframes and is ideal for lower timeframes.
GENERAL FEATURES
Multi-strategy: the algorithm can apply either the long strategy or the short strategy.
Built-in alerts: the algorithm contains alerts that can be customized from the user interface.
Integrated indicator: the quantity indicator is included.
Backtesting included: automatic backtesting of the strategy is generated based on the values set.
Auto-trading compliant: functions for auto trading are included.
ABOUT THE BACKTEST
Backtesting refers to the period 1 January 2022 - today, ticker: ICP/USDT, timeframe 5 minutes.
Initial capital: $1000.00
Commission per trade: 0.03%

Ichimoku Cloud with RSI (By Coinrule)The Ichimoku Cloud is a collection of technical indicators that show support and resistance levels, as well as momentum and trend direction. It does this by taking multiple averages and plotting them on a chart. It also uses these figures to compute a “cloud” that attempts to forecast where the price may find support or resistance in the future.
The Ichimoku Cloud was developed by Goichi Hosoda, a Japanese journalist, and published in the late 1960s. It provides more data points than the standard candlestick chart. While it seems complicated at first glance, those familiar with how to read the charts often find it easy to understand with well-defined trading signals.
The Ichimoku Cloud is composed of five lines or calculations, two of which comprise a cloud where the difference between the two lines is shaded in.
The lines include a nine-period average, a 26-period average, an average of those two averages, a 52-period average, and a lagging closing price line.
The cloud is a key part of the indicator. When the price is below the cloud, the trend is down. When the price is above the cloud, the trend is up.
The above trend signals are strengthened if the cloud is moving in the same direction as the price. For example, during an uptrend, the top of the cloud is moving up, or during a downtrend, the bottom of the cloud is moving down.
This strategy combines the Ichimoku Cloud with the RSI indicator to better enter trades.
Long/Short orders are placed when three basic signals are triggered.
Long Position:
Tenkan-Sen is above the Kijun-Sen
Chikou-Span is above the close of 26 bars ago
Close is above the Kumo Cloud
RSI is greater less than 50
Short Position:
Tenkan-Sen is below the Kijun-Sen
Chikou-Span is below the close of 26 bars ago
Close is below the Kumo Cloud
RSI is greater than 50
The script is backtested from 1 June 2022 and provides good returns.
The strategy assumes each order is using 30% of the available coins to make the results more realistic and to simulate you only ran this strategy on 30% of your holdings. A trading fee of 0.1% is also taken into account and is aligned to the base fee applied on Binance.
This script also works well on SOL (45m timeframe), BNB (1h timeframe), and ETH (1h timeframe).

Statistical Correlation Algorithm - The Quant ScienceStatistical Correlation Algorithm - The Quant Science™ is a quantitative trading algorithm.
ALGORITHM DESCRIPTION
This algorithm analyses the correlation ratios between two assets. The main asset (on the chart), and the secondary asset (set by the user). Then apply the long or short trading strategy.
The algorithm divides trading work into three parts:
1. Correlation analysis
2. Long or short entry
3. Closing trades
Inside the strategy: the algorithm analyses the percentage change yields from a previous session, of the secondary asset. If the variation meets the set condition then it will open a long or short position, on the primary asset. The open position is closed after 'x' number of sessions. Stop loss and take profit can be added to the trade exit parameters.
Logic: analyses the correlation between two assets and looks for a statistical advantage within the correlation.
INDICATOR DESCRIPTION
The algorithm includes a quantitative indicator. This indicator is used for correlation analysis and offers a quick reading of the quantitative data. The blue area shows the correlation ratio values. The yellow histograms show the percentage change in the yields of the main asset. Purple histograms show the percentage change in secondary asset yields.
GENERAL FEATURES
Multi time-frame: the user can set any time-frame for the secondary asset.
Multi asset: the user analyses the conditions on a second asset.
Multi-strategy: the algorithm can apply either the long strategy or the short strategy.
Built-in alerts: the algorithm contains alerts that can be customized from the user interface.
Integrated indicator: the quantity indicator is included.
Backtesting included: automatic backtesting of the strategy is generated based on the values set.
Auto-trading compliant: functions for auto trading are included.
USER INTERFACE SETTINGS
Through the intuitive user interface, you can manage all the parameters of this algorithm without any programming experience. The user interface is extremely descriptive and contains all the information needed to understand the logic of the algorithm and to configure it correctly.
1. Date range: through this function you can adjust the analysis and working period of the algorithm.
2. Asset: through this function you can adjust the secondary asset and its time-frame. You can enter any type of asset, even indices and economic indicators.
3. Asset details: this function is used to adjust the percentage change to be analyzed on the secondary asset. The analysis and input conditions are also chosen.
4. Active long or short strategy: this function is used to set the type of strategy to be used, long or short.
5. Setting algo trading alert: with this function, users can manage alerts for their web-hook.
6. Exit&Money management: with this function the user can adjust the exit periods of each trade and activate or deactivate any stop losses and take profits.
7. Data Value Analysis: this function is used to adjust the parameters for the quantity indicator.

Inverse MACD + DMI Scalping with Volatility Stop (By Coinrule)This script is focused on shorting during downtrends and utilises two strength based indicators to provide confluence that the start of a short-term downtrend has occurred - catching the opportunity as soon as possible.
This script can work well on coins you are planning to hodl for long-term and works especially well whilst using an automated bot that can execute your trades for you. It allows you to hedge your investment by allocating a % of your coins to trade with, whilst not risking your entire holding. This mitigates unrealised losses from hodling as it provides additional cash from the profits made. You can then choose to hodl this cash, or use it to reinvest when the market reaches attractive buying levels.
Alternatively, you can use this when trading contracts on futures markets where there is no need to already own the underlying asset prior to shorting it.
ENTRY
The trading system uses the Momentum Average Convergence Divergence (MACD) indicator and the Directional Movement Index (DMI) indicator to confirm when the best time is for selling. Combining these two indicators prevents trading during uptrends and reduces the likelihood of getting stuck in a market with low volatility.
The MACD is a trend following momentum indicator and provides identification of short-term trend direction. In this variation it utilises the 12-period as the fast and 26-period as the slow length EMAs, with signal smoothing set at 9.
The DMI indicates what way price is trending and compares prior lows and highs with two lines drawn between each - the positive directional movement line (+DI) and the negative directional movement line (-DI). The trend can be interpreted by comparing the two lines and what line is greater. When the negative DMI is greater than the positive DMI, there are more chances that the asset is trading in a sustained downtrend, and vice versa.
The system will enter trades when two conditions are met:
1) The MACD histogram turns bearish.
2) When the negative DMI is greater than the positive DMI.
EXIT
The strategy comes with a fixed take profit combined with a volatility stop, which acts as a trailing stop to adapt to the trend's strength. Depending on your long-term confidence in the asset, you can edit the fixed take profit to be more conservative or aggressive.
The position is closed when:
Take-Profit Exit: +8% price decrease from entry price.
OR
Stop-Loss Exit: Price crosses above the volatility stop.
In general, this approach suits medium to long term strategies. The backtesting for this strategy begins on 1 April 2022 to 18 July 2022 in order to demonstrate its results in a bear market. Back testing it further from the beginning of 2022 onwards further also produces good returns.
Pairs that produce very strong results include SOLUSDT on the 45m timeframe, MATICUSDT on the 2h timeframe, and AVAUSDT on the 1h timeframe. Generally, the back testing suggests that it works best on the 45m/1h timeframe across most pairs.
A trading fee of 0.1% is also taken into account and is aligned to the base fee applied on Binance.

MZ HTF HFT ROCit Bot - Non Repainting Scalper v1.2 ADX RSI MOM This is a new iteration based on my Momentum trading bot.
This is an original script meant to be a high frequency trader that works on higher time frame calculations.
I came up with the idea that using calculus I can figure out the actual rate of change and momentum with different calculations than the momentum indicator that is provided by trading view. Once momentum is shifted on a small time frame, it will provide an entry signal. The script is meant to be used on an algorithmic trading system for scalping purposes. It should be run on a one minute time frame. Unfortunately due to various plotting constraints in Pinescript, you cannot plot the rate of change and momentum and price in the same pane. To counter this, I have a showdata toggle to give you values of the indicators at each entry.
This version has two main entry settings toggled with a checkbox. There is the ROC (rate of change) version and the MOM (momentum) entry signals.
The rate of change version is meant to take a look at your moving average and try to trigger when it hits a certain rate of change point. This can be helpful if you rather play it safer. I have noticed that you can get slightly better entry points but also does not give you as many entries. The momentum algorithm will give you faster entry points and might work best with a slight offset (use your back test to help you figure it out).
I have started to add tooltips to help you along. If you have suggestions please let me know.
How does it work?
Let's just assume that you are looking at a one minute chart. I recommend using the one minute for bots because it will give you the fastest execution for entries. Pinescript has an issue where the signal is not usually sent until the end of the bar/beginning of next bar. If the signal was triggered at the beginning of a 15 minute bar, it might not actually send the signal until the following 15 minute bar. If you are trading on small time frames, this can make all the difference. If you are using an algo platform that trailing stops, stop losse, take profits, etc. I would recommend you use that platform to close your trade. The close trade message will work, but pinescript does not know the exact entry price you received, so if you are trying to collect small profits, it is best that intermediary platform does that calculation for you. If you are dealing with larger moves, instead of small 1-3% scalps, you are probably fine to use the close message setting from pinescript.
Ok, so to take an example. I like to use the 3L and 3S tokens on Kucoin. This gives you a lot of volatility to work with compared to other tokens and coins. However, it can also meas that you are likely taking a higher risk. However, there are some things that can help with that (more on that later).
So we have a token we want to run, and have it on the 1m chart.
First, be sure that all of your filters are OFF when you start playing with the back test. This allows you to see how to best optimize the bot.
Use the show data to show you additional data when you are backtesting. This can allow you to try to filter out results or market conditions that do not work. I typically work with the RSI and use the 30 minute and 15 minute RSIs. I make sure that it is trading within a certain band - about 40-75. You can try the inverse and only buy during really low RSI's as well.
www.dropbox.com
Find the source of your data with the variant drop down. You can use any time frame, open, close. high, low, olc4. Open is pretty much guaranteed to not have any repainting issues - although all the other calcs use a custom isbarconfirmed security repaint calculation. I have been finding that Open and SMA work well, but feel free to explore. If you use a source like open, close, high, low, etc - the interval will not change anything further. If you use a variant such as an sma, you should try to find an interval that works well for that token. For instance, try an sma of 8-11 minutes and see which gives you the best backtest result without changing anything else. Offset ALMA/LSMA parameters are only used for those specific variants. These specific parameters will also affect the ALMA and LSMA if you use that variant in the trend filter. In other words, you can skip these if you are not using those types of moving averages.
www.dropbox.com
Configure the ROC and MOM intervals. If you are using a source such as open, close, etc- this is where you set the interval for your change. So consider using OHLC4 or a interval of 5 thru 15 and see what works best. The Momentum inverval usually works best in the 2-5 bars. There is a custom calculation I added in to try to filter out false entries as momentum is waning. This calculation works best in 2-5 bar interval.
Configure the trigger point and offset. If you are using rate of change, the best settings will likely be between -1 to 0.5. If you are using momentum, you will likely want -20 to 10. This is where you will notice the entries will shift a bit. Try to find a balance between your backtest settings and actually finding what you thin will be the best entries based on a slight delay from trading view, to algo, to your trading platform. This can likely be a minute (maybe even) or so- so be sure to not get too caught up between the backtest results and be sure to finesse the entries to actually fit nicely - maybe a bar earlier than you would likely think. If your entries are coming in too early, you can use the offset to delay your entry by a few bars. This is both science and an art form- don't get too caught up on the back test results as that is based on having all the data tha already transpired, it's not based on how it will actually perform during deployment.
Take profit and stop loss. This should be self explanatory. This script can toggle between static take profit and a trailing profit. For scalping, you will likely want to limit it below 2% to get a good win ratio. Stop loss should be at least 5-6% for these types of 3L/3S tokens to give the strategy some room to move (if the token goes down 2% before it shoots back up, the price will go down 6%). This does not yield the best R/R ratio from a traditional trader perspective, but the statistical probabilities are in your favor for these events will happen. If you have better ideas for how to set this all up, feel free to contribute your ideas in the comments as we can all learn from each other. You can definitely set a much tighter stop loss with a larger take profit to get a lower win rate but in turn might get much better returns. It's all up to you.
FILTERS www.dropbox.com
These filters require you to know a bit about each indicator and how you want to use them. I will only go over the general idea.
Variant Filter - this is especially useful if you want to trade above a moving average. Say for instance you only want to take trades when we are over the 100 Day moving average. Or above a 30 minute, 30 bar EMA, etc. Although originally ported over from my other scripts, this is not a filter that I use often in conjunction with this script.
RSI - perhaps you want to buy when we are below the 30 line on the 30 minute RSI, or we want only want to have the strategy work when we are above the 50 RSI, this can all be configured here. I typically like to try a few different rationales here.
Now with brand NEW ADX filter - this is a brand new idea that seems to work rather well. Based on your ADX settings you can also turn on the "only uptrend" which will try to calculate if you are in an uptrend based on your ADX config. Please keep in mind that uptrend is based relatively on the ADX settings.
- There is a sprinkle of RSI magic in the entry signal to make sure that rsi is not declining in the calculation, so this can affect how many entries you get.
Some other tips:
Forward test.
Set up your algo bot on a one minute interval.
Set up take profit and stop loss on your algo trading platform.
Don't use the exact settings as your backtest, maybe try a slightly more conservative approach from the algo trading platform to make sure you are within range of triggering your events with a slight delay from signal to execution. If you have a 1.6% take profit, perhaps try 1.5% on your platform first.
By using these scripts you agree that you are trading at your own risk. I make no guarantees of returns or results. I just provide tools to help you trade better. However, I hope this ROCit will take you to the moon. And if it does, be sure to give me a shout as well as some tips of your own.
Send me a message with any questions or suggestions.

Short Selling EMA Cross (By Coinrule)BINANCE:AVAXUSDT
This short selling script works best in periods of downtrends and general bearish market conditions, with the ultimate goal to sell as the the price decreases further and buy back before a rebound.
This script can work well on coins you are planning to hodl for long-term and works especially well whilst using an automated bot that can execute your trades for you. It allows you to hedge your investment by allocating a % of your coins to trade with, whilst not risking your entire holding. This mitigates unrealised losses from hodling as it provides additional cash from the profits made. You can then choose to to hodl this cash, or use it to reinvest when the market reaches attractive buying levels.
Entry
The exponential moving average ( EMA ) 20 and EMA 50 have been used for the variables determining the entry to the short. EMAs can operate better than simple moving averages due to the additional weighting placed on the most recent data points, whereas simple moving averages weight all the data the same. This means that price is tracked more closely and the most recent volatile moves can be captured and exploited more efficiently using EMAs.
Our backtesting data revealed that the most profitable timeframe was the 30-minute timeframe, this also enabled a good frequency of trades and high profitability.
A fast (shorter term) exponential moving average , in this strategy the EMA 20, crossing under a slow (longer term) moving average, in this example the EMA 50, signals the price of an asset has started to trend to the downside, as the most recent data signals price is declining compared to earlier data. The entry acts on this principle and executes when the EMA 20 crosses under the EMA 50.
Enter Short: EMA 20 crosses under EMA 50.
Exit
This script utilises a take profit and stop loss for the exit. The take profit is set at -8% and the stop loss is set at +16% from the entry price. This would normally be a poor trade due to the risk:reward equalling 0.5. However, when looking at the backtesting data, the high profitability of the strategy (93.33%) leads to increased confidence and showcases the high probability of success according to historical data.
The take profit (-8%) and the stop loss (+16%) of the strategy are widely placed to ensure the move is captured without being stopped out due to relief rallies. The stop loss also plays a role of mitigating losses and minimising risk of being stuck in a short position once there has been a fundamental trend reversal and the market has become bullish .
Exit Short: -8% price decrease from entry price.
OR
Exit Short: +16% price increase from entry price.
Tip: Research what coins have consistent and large token unlocks / highly inflationary tokenomics, and target these during bear markets to short as they will most likely have substantial selling pressure that outweighs demand - leading to declining prices.
The strategy assumes each order is using 30% of the available coins to make the results more realistic and to simulate you only ran this strategy on 30% of your holdings. A trading fee of 0.1% is also taken into account and is aligned to the base fee applied on Binance.
The backtesting data was recorded from December 1st 2021, just as the market was beginning its downtrend. We therefore recommend analysing the market conditions prior to utilising this strategy as it operates best on weak coins during downtrends and bearish conditions.

The Impossible TraderTHE IMPOSSIBLE TRADER
A simple, but effective High Freq Strategy script based on MACD or RSI trend, with extra customizable Alert Messages for Bots.
WHAT IT DOES
This script (works best at lower TimeFrames) just follow the trend of MACD or RSI on your asset.
Why it should work? Because in an upper trend, there are more chance of green candles than reds. And in dump trend there are more chance of red candles than greens.
While trend is positive, it will try to open Long orders as fast as possible at market price.
While trend is negative, it will try to open Short orders as fast as possible at market price.
HOW TO SETUP YOUR PREFERENCES
Capital : Insert a % of Margin you want to use for your positions (usually 30% is quite good)
Leverage : Choose leverage based on your plans
Trail Tick @ : This value (in Tick) tell the script "when" the "Trail Stop" order must be activated (from the Entry price)
Offset Tick @ : This is the price (in Tick) from the Trail Stop Price activated. Basically it is a Stop Loss that follow the price at a fixed distance.
SL Tick @ : Set a Stop Loss at amount Tick distance from the Entry Price. (Let's call it a Safety Stop Loss for bad decisions...)
TP Tick @ : Set a Take Profit at amount Tick distance from the Entry Price. Sometimes is better to exit in full Gain than keep positions.
Strategy : You can choose a Only Long, Only Short or Long+Short sametime strategy.
with MACD or RSI : You can try the strategy applied on MACD or applied on customizable RSI EMA
EMA : If you choosed RSI EMA, you can set any value for your testing (usually 80-120 works very nice)
Exit order after bars : Some Exchanges / Brokers apply fixed cost, and a strategy too fast could not be productive. This set will let you to delay the Exit Order on already Opened positions.
Keep Stop Loss active : If you are planning a delay for Exit Orders, sometime could be useful to keep activated Stop Loss.
Strategy Preset : Some preset I've found interesting, with good results.
BackTest Days : If there are too many results and script doesn't work, you can choose a closer range to show results.
EXTRA FEATURES
On Screen Display : OSD will show you some realtime stats about your strategy, like Asset Tick, Trading Period Range, Drawdown, Gains and not closed trade.
Alert Message : You can enter custom Long Entry/Exit and Short Entry/Exit message for your Bots (like AutoView, WunderBit, etc...). When alert is triggered, you can send custom message with {{strategy.order.comment}} in the text field
AutoView Alert Message : If you are user of AutoView, you can generate your calls. Those are tested only on Oanda with index like Sp500, US100, Us30.
TIPS ON USE
Some asset on TradingView require an higher initial capital. Go to this Script Settings -> Properties and rise Initial Capital.
Be aware of commissions and spread when evalutating a strategy. Go to this Script Settings -> Properties and set Commission and Slippage
Trail Stop and Ticks could be difficult to understand, but very profitable. Please take your time and study how it works.
Consider Tick like the minimum movement your asset can do. Ticks occurs "intra-bar", so some of your positions could be closed almost instantly.
Consider Trail Stop like a Stop Loss that keep always the same distance from your positions, but never came back . If you are in gain, say of 10 Ticks, and your Trail have 5 Ticks, this means for sure a close at minimum 5 Ticks from Entry Price.
On Screen Display will show you Ticks for your asset. This will help you on strategy settings, because not all asset responds on the same way.
ONLY LONG EXAMPLE
ONLY SHORT EXAMPLE

Oversold RSI with Tight Stop-Loss Strategy (by Coinrule)KRAKEN:LINKUSD
This is one of the best strategies that can be used to get familiar with technical indicators and start to include them in your rules on Coinrule .
ENTRY
1. This trading system uses the RSI (Relative Strength Index) to anticipate good points to enter positions. RSI is a technical indicator frequently used in trading. It works by measuring the speed and change of price movements to determine whether a coin is oversold (indicating a good entry point) or overbought (indicating a point of exit/entry for a short position). The RSI oscillates between 0 and 100 and is traditionally considered overbought when over 70 and oversold when below 30.
2. To pick the right moment to buy, the strategy enters a trade when the RSI falls below 30 indicating the coin is oversold and primed for a trend reversal.
EXIT
The strategy then exits the position when the price appreciates 7% from the point of entry. The position also maintains a tight stop-loss and closes the position if the price depreciates 1% from the entry price. The idea behind this is to cut your losing trades fast and let your winners ride.
The best time frame for this strategy based on our back testing data is the daily. Shorter time frames can also work well on certain coins, however in our experience, the daily works best. Feel free to experiment with this script and test it on a variety of your coins! With our back testing data a trading fee of 0.1% is taken into account. The fee is aligned to the base fee applied on Binance, which is the largest cryptocurrency exchange by volume. In the example shown, this strategy made a handsome net profit of 52.6% on Chainlink with 66.67% of trades being profitable.
You can execute this strategy on your favorite exchanges with Coinrule .

Buy Sell Bot StrategyHello Everyone,
In this strategy, I benefited from the values of RSI and wave trend indicators, which are the oldest and most used indicators in the market. I contributed to this bi-valued indicator myself with a bivariate formula. My variables are actually a simple intersection algorithm, the intersection of the wave trend indicator and the RSI indicators when they are oversold or overbought.
As you all know, we can send signals to bot sites via tradingview. You can use bot signals boxes in this strategy. You can analyze past transactions in the Date settings section. In the indicator settings section, you can change the settings of the overbought and oversold zones. Perhaps the most important feature here is the USE SELL SIGNALS section. I would like to emphasize this section in particular that when you mark the use sell signal section, the strategy will be processed in the buy section and will not be processed in the sell section. If you do not click on the USE SELL SIGNALS section, the strategy will be processed in the buy section, but this time it will be exited when the target in the take profit section is reached. THIS WAS IMPORTANT.
There is another important point here. Always in position and USE SELL SIGNALS sections do not work together. Run these two features one by one. It is a strategy that is constantly in operation through the name of the Always in position feature, I do not recommend it. The USE PERCENTAGE DECREASE feature, on the other hand, is the section where we want the share to drop as a percentage to enter the second trade after the first purchase is made in the settings section if you activate the pyramiding feature. You can use the tradingview help page for the pyramiding feature.
I found this strategy suitable to use in the 1-hour time frame in the crypto market and adjusted it that way. Of course, you can use it by changing the settings in stocks and in different time periods. big wins
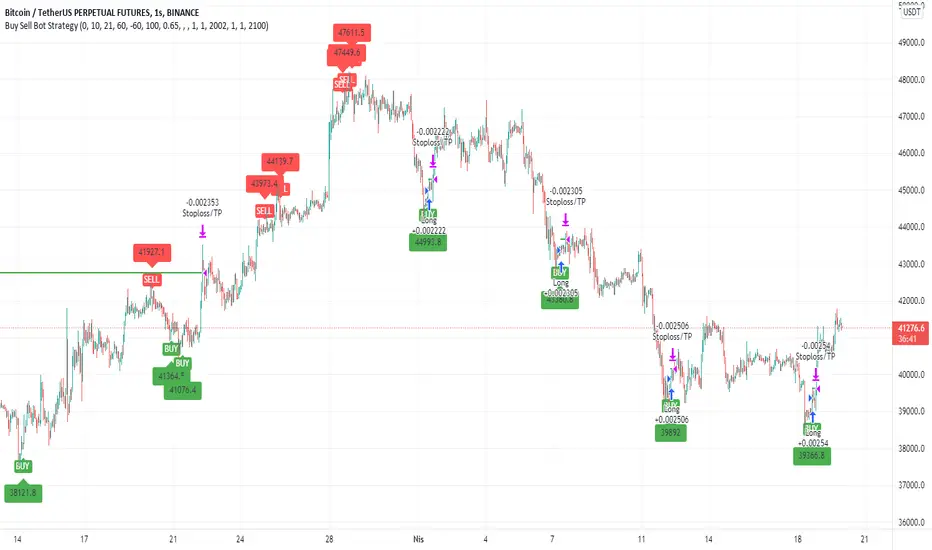
Zlema Strateg Long 5mJust putting this out there.
I created this Strategy based on Everget Zlema.
Opens long trade when Zlema changes color.
It is profitable as it is, but just putting it out to the community to see if someone else has ideas to make it better.
How to make this strategy better?
1. FInd a way to filter ranging bad trades.
2. Trades would be more profitable if entry point had an entry on the candle the zlema changes color.
3. I had to put TP 5 limit, but the optimal would be when the zlema changes color back to red (if ranging trades can we filtered that is).
In any case, just putting it out there, hope it is useful for someone, and I am open to suggestions.
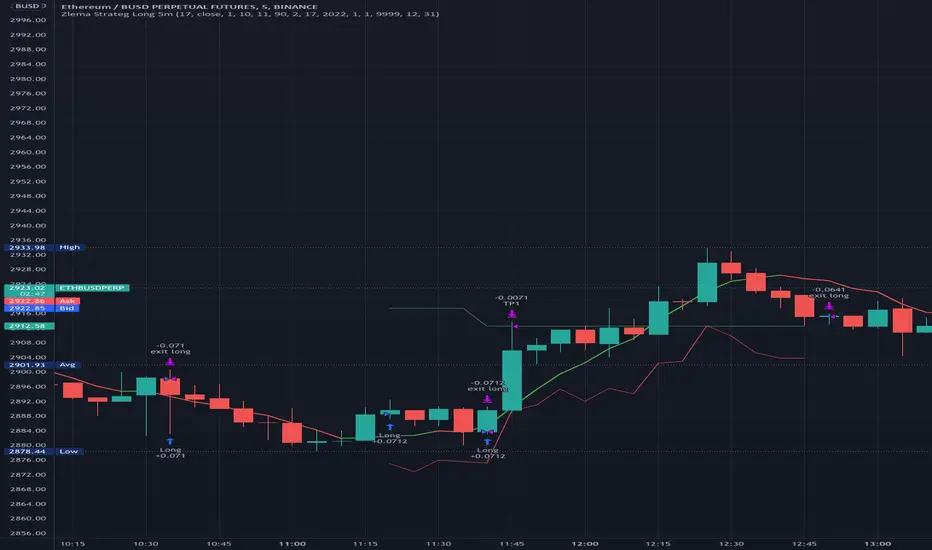
Six Factors Ichimoku 1.0This strategy has the purpose to help dummies to get experienced when trade with Crypocurrencies, using the Ichimoku indicator
The following script shows an strategy based on Ichimoku indicator. Taking into account the theoretical concepts of the Ichimoku Kinko Hyo, are defined six (6) factors to open position and two (2) factors to close it. According to the author of the book, in which is based the script, it is stablished that the proper combination of the six factors when the timeframe is set in 1D and the assest Cryptocurrencies (not applicable to stable Coins), has demonstrated in the Backtesting good results.
Althoug is not the purpose, the Ichimoku indicator is composed by six components (Tenkan Line, Kijun Line, Senkou Span A, Senkou Span B and Kumo Cloud) and the relative position of the current price of the assest compared with ichimoku components define these factor.
Factors to open position
Factor one. The current price is over the Ichimoku Cloud
Factor two. When Senkou Span A is greater thant Senkou Span B, proyected 22 periods forward.
Factor three. Senkou Span A, has a positive slope, during the previous periods.
Factor four.The Tenkan Line (quick line) is above the Kijun Line (slow line) during the previous periods.
Factor five. The Chikou Span Line is above the Kumo
Factor six. The slope of the sma (200) is positive.
The long entry is recomended when the following expresion is matched
F1 and F2 and F4 and F5 and (F3 or F6)
Factors to close position
Factor one. Tenkan line has a downward trajectory for previous periods. If the price change during this periods the counter reset and start again trying to prevent exit from quick variations.
Factor two. Current price is below Kijun line
The time to close position is recommended when the following expresión occurs
F1 and F2
Some of the features of the script are the following:
Initial amount of investment stablished on 100€, but can be modified by the user.
User can easily modified the period for backtesting purposes.
"Show factors" give the user and easy interface to know the current status of the strategy`s factors. The factors appears color red (false) and color green (true)
It is possible to cancel Factor F5, which is interesting after the assests has dumped strongly. The color black means that F5 is canceled.
Change the output criteria by F1 or F2 (not recommended) but available for learning purposes.
Auxiliary lines that help to idenfify strong resistances that could compromise the strategy
Enjoy it !!!
Miguel A. Calatayud
