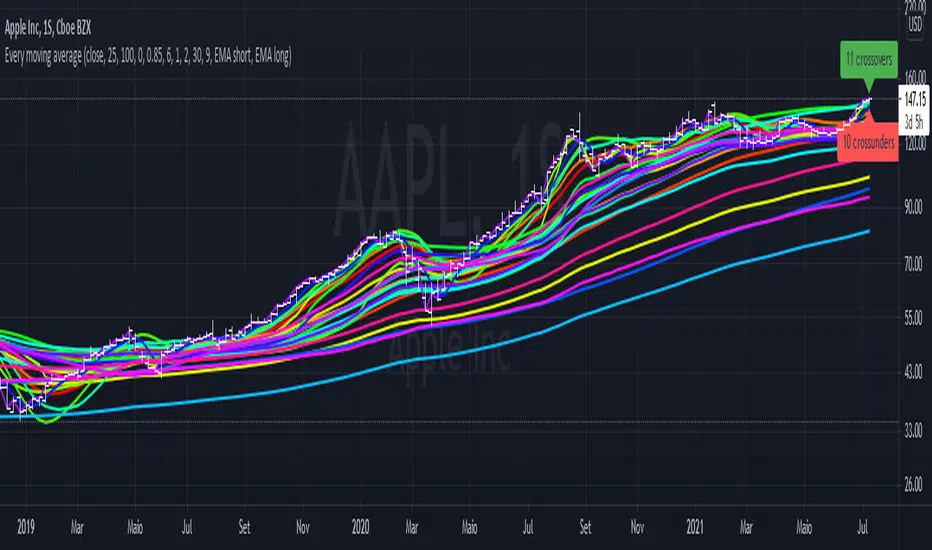
Trend ChannelThis Trend Channel is designed to simplify how traders view trends, while also keeping track of potential shifts in trends with signals. It is designed for traders that prefer less over more.
The indicator can be used for trend following, trend reversals and confirmation in combination with price or other indicators.
At the core is one EMA and a smoothed volatility based channel around it.
The purpose of the channel is to avoid false signals on trend reclaim or trend loss and instead identify trend deviations.
The indicator also incorporates long and short EMA cross-over signals to recognize possible shifts in trend without having to overlay multiple EMAs and keep the chart cleaner.
Additionally the indicator fires warnings for potential false signals on golden/death crosses with a letter "W" above/below the signal candle. Those warnings are based on the distance between price and the crossover. When the distance is above a certain threshold the indicator fires a warning that price might mean revert.
Traders can customize all inputs in the settings.
Crossunder

ZenAlgo - QZenAlgo - Q
Description
ZenAlgo - Q is an oscillator based on the QQE (Quantitative Qualitative Estimation) method. This version incorporates refinements for additional visualization and interpretation options. It is designed to help traders observe momentum changes and divergence patterns in price movements.
Key Features
QQE-Based Calculation : Derived from the open-source QQE script by Glaz (Metastock Version of QQE), with modifications for alternative visualization.
Dual RSI-Based Analysis : Uses two RSI calculations to provide additional context on price movements.
Adaptive Trend Bands : Adjust dynamically based on the market conditions.
Divergence Identification : Highlights potential differences between price action and oscillator movement.
Dynamic Color Coding : Displays histogram bars to illustrate shifts in oscillator values.
Configurable Alerts : Enables notifications for specific oscillator conditions.
How It Works
The indicator calculates a smoothed RSI-based oscillator that tracks the relative strength of price movement. It applies an exponential moving average (EMA) smoothing to reduce noise while maintaining responsiveness.
Two adaptive bands are calculated using a variation of the QQE method, which helps define dynamic overbought and oversold conditions.
The histogram bars shift in color based on the position of the oscillator relative to the bands. Lighter shades indicate weaker momentum, while stronger momentum is represented by more saturated colors.
The script also includes a secondary RSI component, which provides an additional layer of analysis. This secondary RSI helps refine momentum trends by smoothing out short-term fluctuations.
Divergence identification is built-in, highlighting where price action deviates from oscillator readings. Bullish divergence occurs when price forms a lower low while the oscillator forms a higher low, and bearish divergence is identified when price forms a higher high while the oscillator forms a lower high.
The indicator does not generate buy or sell signals but instead provides contextual information that can be used alongside other trading strategies.
Use Cases
Trend Observation : Traders can use the histogram to observe whether momentum is strengthening or weakening over time. A shift in color can indicate a potential change in trend strength.
Divergence Analysis : By comparing oscillator divergence with price movement, traders can identify situations where price action may be losing momentum. Divergences do not guarantee reversals but can serve as an early warning to re-evaluate positions.
Momentum Tracking : The dual RSI structure allows users to monitor both short-term and long-term momentum. When both RSI components are aligned, it suggests a more stable trend, while divergence between them may indicate potential consolidation or trend shifts.
Supplementary Analysis : This indicator is best used as a supporting tool alongside volume-based or trend-following indicators. It helps visualize underlying price behavior but should not be used in isolation for decision-making.
Market Context Interpretation : The combination of adaptive bands and histogram visualization allows traders to assess how recent price action compares to historical movement, helping to place current conditions in a broader market context.
Attribution
This script is an adaptation of the open-source QQE script originally developed by Glaz. We acknowledge and appreciate the original author's work, which served as a foundation for our modifications.
Disclaimer
This indicator is intended for informational purposes only. It should not be interpreted as financial advice. Always conduct independent research and risk management before making trading decisions.

VWAP Bands [TradingFinder] 26 Brokers Data (Forex + Crypto)🔵 Introduction
Indicators are tools that help analysts predict the price trend of a stock through mathematical calculations on price or trading volume. It is evident that trading volume significantly impacts the price trend of a stock symbol.
The Volume-Weighted Average Price (VWAP) indicator combines the influence of trading volume and price, providing technical analysts with a practical tool.
This technical indicator determines the volume-weighted average price of a symbol over a specified time period. Consequently, this indicator can be used to identify trends and entry or exit points.
🟣 Calculating the VWAP Indicator
Adding the VWAP indicator to a chart will automatically perform all calculations for you. However, if you wish to understand how this indicator is calculated, the following explains the steps involved.
Consider a 5-minute chart. In the first candle of this chart (which represents price information in the first 5 minutes), sum the high, low, and close prices, and divide by 3. Multiply the resulting number by the volume for the period and call it a variable (e.g., X).
Then, divide the resulting output by the total volume for that period to calculate your VWAP. To maintain the VWAP sequence throughout the trading day, it is necessary to add the X values obtained from each period to the previous period and divide by the total volume up to that time. It is worth noting that the calculation method is the same for intervals shorter than a day.
The mathematical formula for this VWAP indicator : VWAP = ∑ (Pi×Vi) / ∑ Vi
🔵 How to Use
Traders might consider the VWAP indicator as a tool for predicting trends. For example, they might buy a stock when the price is above the VWAP level and sell it when the price is below the VWAP.
In other words, when the price is above the VWAP, the price is rising, and when it is below the VWAP, the price is falling. Major traders and investment funds also use the VWAP ratio to help enter or exit stocks with the least possible market impact.
It is important to note that one should not rely solely on the VWAP indicator when analyzing symbols. This is because if prices rise quickly, the VWAP indicator may not adequately describe the conditions. This indicator is generally used for daily or shorter time frames because using longer intervals can distort the average.
Since this indicator uses past data in its calculations, it can be considered a lagging indicator. As a result, the more data there is, the greater the delay.
🟣 Difference Between VWAP and Simple Moving Average
On a chart, the VWAP and the simple moving average may look similar, but these two indicators have different calculations. The VWAP calculates the total price considering volume, while the simple moving average does not consider volume.
In simpler terms, the VWAP indicator measures each day's price change relative to the trading volume that occurred that day. In contrast, the simple moving average implicitly assumes that all trading days have the same volume.
🟣 Reasons Why Traders Like the VWAP Indicator
The VWAP Considers Volume: Since VWAP takes volume into account, it can be more reliable than a simple arithmetic average of prices. Theoretically, one person can buy 200,000 shares of a symbol in one transaction at a single price.
However, during the same time frame, 100 other people might place 200 different orders at various prices that do not total 100,000 shares. In this case, if you only consider the average price, you might be mistaken because trading volume is ignored.
The Indicator Can Help Day Traders: While reviewing your trades, you might notice that the shares you bought at market price are trading below the VWAP indicator.
In this case, there's no need to worry because with the help of VWAP, you always get a price below the average. By knowing the volume-weighted average price of a stock, you can easily make an informed decision about paying more or less than other traders for the stock.
VWAP Can Signal Market Trend Changes: Buying low and selling high can be an excellent strategy for individuals. However, you are looking to buy when prices start to rise and sell your shares when prices start to fall.
Since the VWAP indicator simulates a balanced price in the market, when the price crosses above the VWAP line, one can assume that traders are willing to pay more to acquire shares, and as a result, the market will grow. Conversely, when the price crosses below the line, this can be considered a sign of a downward movement.
🔵 Setting
Period : Indicator calculation time frame.
Source : The Price used for calculations.
Market Ultra Data : If you turn on this feature, 26 large brokers will be included in the calculation of the trading volume.
The advantage of this capability is to have more reliable volume data. You should be careful to specify the market you are in, FOREX brokers and Crypto brokers are different.
Multiplier : Coefficient of band lines.

Price Cross Time Custom Range Interactive█ OVERVIEW
This indicator was a time-based indicator and intended as educational purpose only based on pine script v5 functions for ta.cross() , ta.crossover() and ta.crossunder() .
I realised that there is some overlap price with the cross functions, hence I integrate them into Custom Range Interactive with value variance and overlap displayed into table.
This was my submission for Pinefest #1 , I decided to share this as public, I may accidentally delete this as long as i keep as private.
█ INSPIRATION
Inspired by design, code and usage of CAGR. Basic usage of custom range / interactive, pretty much explained here . Credits to TradingView.
█ FEATURES
1. Custom Range Interactive
2. Label can be resize and change color.
3. Label show tooltip for price and time.
4. Label can be offset to improve readability.
5. Table can show price variance when any cross is true.
6. Table can show overlap if found crosss is overlap either with crossover and crossunder.
7. Table text color automatically change based on chart background (light / dark mode).
8. Source 2 is drawn as straight line, while Source 1 will draw as label either above line for crossover, below line for crossunder and marked 'X' if crossing with Source 2's line.
9. Cross 'X' label can be offset to improve readability.
10. Both Source 1 and Source 2 can select Open, Close, High and Low, which can be displayed into table.
█ LIMITATIONS
1. Table is limited to intraday timeframe only as time format is not accurate for daily timeframe and above. Example daily timeframe will give result less 1 day from actual date.
2. I did not include other sources such external source or any built in sources such as hl2, hlc3, ohlc4 and hlcc4.
█ CODE EXPLAINATION
I pretty much create custom function with method which returns tuple value.
method crossVariant(float price = na, chart.point ref = na) =>
cross = ta.cross( price, ref.price)
over = ta.crossover( price, ref.price)
under = ta.crossunder(price, ref.price)
Unfortunately, I unable make the labels into array which i plan to return string value by getting the text value from array label, hence i use label.all and add incremental int value as reference.
series label labelCross = na, labelCross.delete()
var int num = 0
if over
num += 1
labelCross := label.new()
if under
num += 1
labelCross := label.new()
if cross
num += 1
labelCross := label.new()
I realised cross value can be overlap with crossover and crossunder, hence I add bool to enable force overlap and add additional bools.
series label labelCross = na, labelCross.delete()
var int num = 0
if forceOverlap
if over
num += 1
labelCross := label.new()
if under
num += 1
labelCross := label.new()
if cross
num += 1
labelCross := label.new()
else
if cross and over
num += 1
labelCross := label.new()
if cross and under
num += 1
labelCross := label.new()
if cross and not over and not under
num += 1
labelCross := label.new()
█ USAGE / EXAMPLES

Trend Line XrossTrend Line Xross (TLX) Uses User Input Points to draw trendlines and displays the exact intersection point of those trendlines.
This is the public indicator of the practical application for this intersection method included in my entry for Pinefest #1.
To determine the exact intersection point I am using the y-intercept method as seen below.
The code is notated for more information on the technical workings.
One difference to note between this version and the pinefest version is that I had to change the line drawings to use bar_index values so that I can use line.get_price() to grab the current value of the line to make alerts from.
Additionally, there are alerts built-in to this version for every type of cross on all of the visible lines.
Enjoy!

Crossing TableCrossing Table V1
I created this indicator as it had been asked for a number of times to create a crossover/under table screen and here it is!!!
The indicator is set up to be selected from SMA, EMA and Volume.
The SMA is defaulted to 2/10 but it is customizable to whatever SMA you choose to use.
Volume is based off a volume formula and the volume settings in the indicators settings, and the table will show either buyers/sellers on the last candle on the volume in the settings.
Just like the SMA the EMA option will be based off the default value of 5/13 but can be customized to your choosing.
If there are any question or comments just let me know :)

Stoch/RSI with EMA50 Cross & HHLLA hybrid but simple indicator that plots 4 strategies in one pane .
1) RSI Indicator
2) Stoch RSI
3) EMA50 Cross (To determine direction in current timeframe)
4) Higher Highs & Lower Lows to analyze the trend and break of trend
The relative strength index (RSI) is a momentum indicator used in technical analysis. It is displayed as an oscillator (a line graph) on a scale of zero to 100. When the RSI indicator crosses 30 on the RSI chart, it is a bullish sign and when it crosses 70, it is a bearish sign.
The Stochastic RSI (StochRSI) is also a momentum indicator used in technical analysis. It is displayed as an oscillator (a line graph) on a scale of zero to 100. When the StochRSI indicator crosses 20 on the RSI chart, it is a bullish sign and when it crosses 80, it is a bearish sign.
The EMA50Cross denotes two cases in the script:
a) A crossover of CMP on the EMA50 is highlighted by a green bar signals a possible bullish trend
b) A crossunder of CMP on the EMA50 is highlighted by a red bar signals a possible bearish trend
The HHLL is denoted by mneumonics HH, HL,LH, LL. A combination of HHs and HLs denotes a uptrend while the combination of LLs and LHs denoted a downtrend
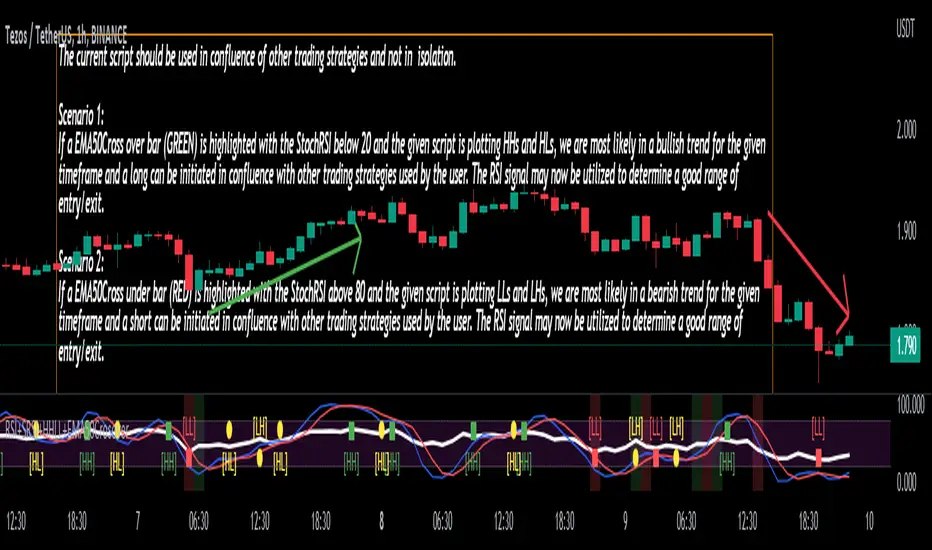
The current script should be used in confluence of other trading strategies and not in isolation.
Scenario 1:
If a EMA50Cross over bar (GREEN) is highlighted with the StochRSI below 20 and the given script is plotting HHs and HLs, we are most likely in a bullish trend for the given timeframe and a long can be initiated in confluence with other trading strategies used by the user. The RSI signal may now be utilized to determine a good range of entry/exit.
Scenario 2:
If a EMA50Cross under bar (RED) is highlighted with the StochRSI above 80 and the given script is plotting LLs and LHs, we are most likely in a bearish trend for the given timeframe and a short can be initiated in confluence with other trading strategies used by the user. The RSI signal may now be utilized to determine a good range of entry/exit.
Disclaimer:
The current script should be used in confluence with other trading strategies and not in isolation. The scripts works best on 4H and 1D Timeframes and should be used with caution on lower timeframes.
This indicator is not intended to give exact entry or exit points for a trade but to provide a general idea of the trend & determine a good range for entering or exiting the trade. Please DYOR
Credit & References:
This script uses the default technical analysis reference library provided by PineScript (denoted as ta)
Dragon Double RSIMost important thing is feeling inspired and relaxed. Forcing your way into anything under stress and pressure will only end up in disaster
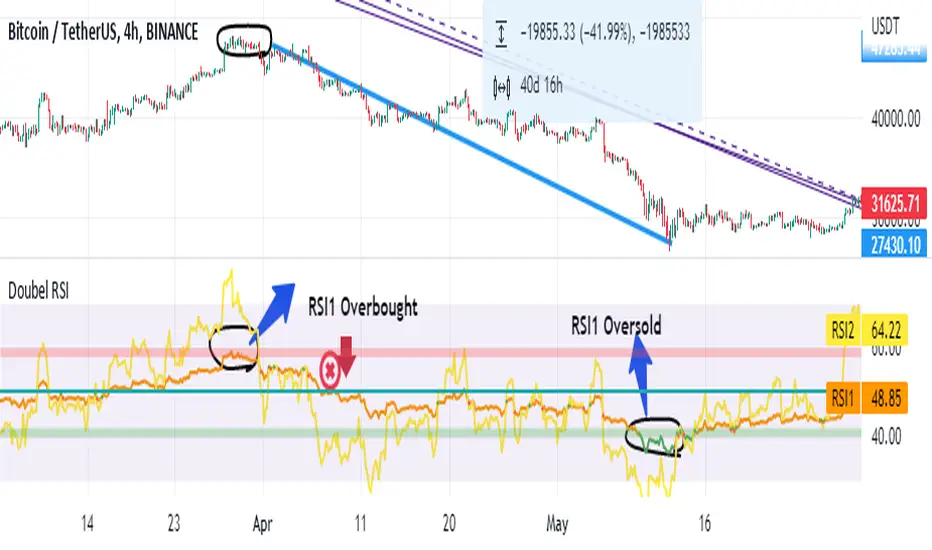
This indicator consists of three RSIs.
RSI: RSI is common and its length is 14.
RSI 1: The slowest RSI. The length is 100.
RSI 2: Faster than RSI 1. The length is 50.
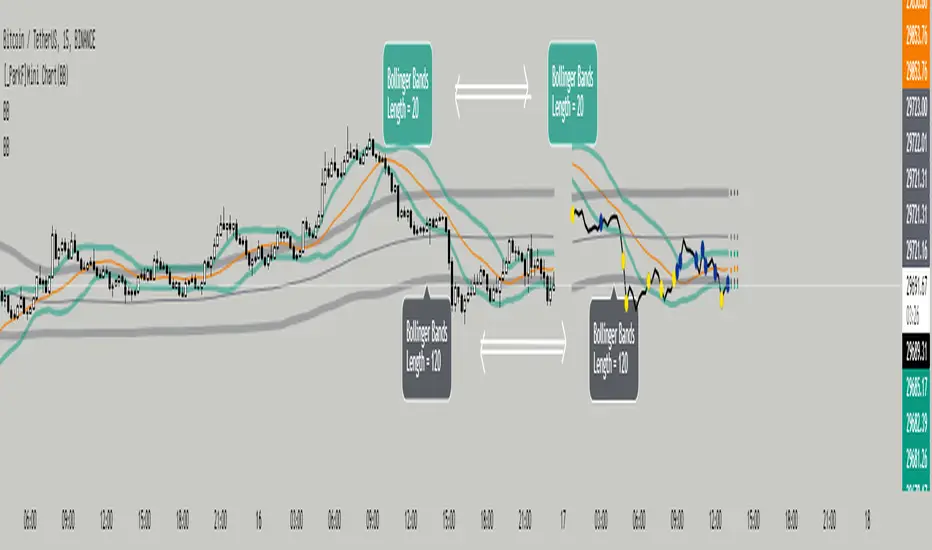
[_ParkF]Mini Chart(BB)Bollinger Bands of different lengths are displayed with a line chart in front of the candle.
A Bollinger band with a length of 20 and a Bollinger band with a length of 120 can be easily identified by the circle and color displayed whenever the line passes.
In the input menu, you can edit the length and deviation of the Bollinger band, the number of candles to be displayed in front, the thickness of the line, the color, and the color of the circle.
And the expected value of each Bollinger band was measured and displayed.
You can change the thickness and color of the displayed predictive circle in Predictive of the input menu.
-------------------------------------------------------------------------------------------------------------------------------------------------------------------------------------------------------------------------------------------
서로 다른 기간값을 가진 볼린저밴드를 캔들보다 앞쪽에 선 차트와 함께 표시하였습니다.
20의 기간값을 가진 볼린저밴드와 120의 기간값을 가진 볼린저밴드를 선차트가 크로스할 때 마다 표시되는 점과 색을 통해 쉽게 식별할 수 있습니다.
input 메뉴에서 볼린저밴드의 기간값과 편차, 앞 쪽에 표시될 캔들의 수와 선의 두께, 색상, 점의 색상을 수정할 수 있습니다.
그리고 각 볼린저밴드의 예상 값을 측정하여 표시하였습니다.
input 메뉴의 Predictive에서 표시된 Predictive circle의 두께와 색상을 변경할 수 있습니다.
Moving Averages With Cross AlertsA simple way to add up to 5 moving averages with optional crossover/crossunder alerts.
Available options for Moving Average Type are:
SMA
EMA (default)
HMA
RMA
WMA
VWMA
VWAP
ALMA
By default, 5 moving averages are enabled and set to the following:
MA1 set to 5
MA2 set to 13
MA3 set to 50
MA4 set to 200
MA5 set to 800
Each moving average has the following options:
Enable/Disable
Source (default is close)
Length
Color
Two EMA Cross+ IndicatorHello traders!
Today we gonna demonstrate out heuristic of classical EMA Indicator. We decided to simplify your trading staff and add some meta data. So, let’s look at it from the very beginning and initially speak about what EMA is and then I’ll tell you why our indicator is extremely convenient and useful.
So, what is EMA? An exponential moving average ( EMA ) is a type of moving average (MA) that places a greater weight and significance on the most recent data points. The exponential moving average is also referred to as the exponentially weighted moving average . An exponentially weighted moving average reacts more significantly to recent price changes than a simple moving average ( SMA ), which applies an equal weight to all observations in the period.
Key takeaways:
-The EMA is a moving average that places a greater weight and significance on the most recent data points.
-Like all moving averages, this technical indicator is used to produce buy and sell signals based on crossovers and divergences from the historical average.
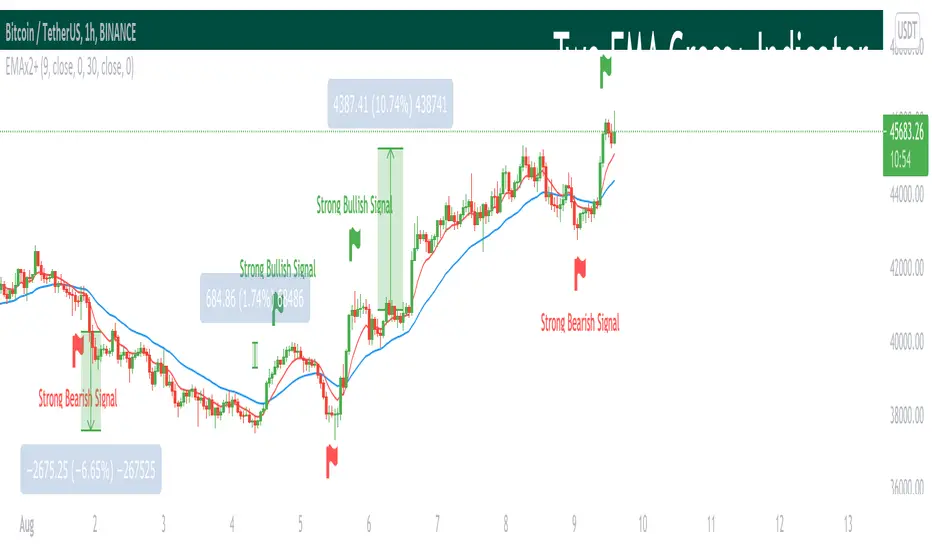
As you know, EMA Cross is one of basic and most popular Entry Indicators. It’s kinda easy to understand and even easier to use. This indicator consists of two EMAs - fast (red line) and slow (blue line). Fast EMA is EMA of less length that the fast EMA (default parameter is 9). Thus, it reacts the price change more actively than the slow. We can say that it takes into consideration the most actual price movements. Speaking about slow EMA (default parameter is 30) it’s more inert and it’s more difficult to change its action vastly. We can say that the EMA «looks» at the historical data more accurate, but doesn’t forget about actual price movements.
But how it works? Trivial. When the fast EMA crosses the slow bellow, it provides bearish signal, whereas when it crosses it above, it’s bullish signal. Even more, we added some «confirmation» factor. As you know, when the price is above the slow EMA, the slow EMA plays the role of support line for price and means that the price is in uptrend. Thus, when we see the cross above and it takes place under the price, we called it «strong Bullish Signal». When the price is bellow the slow EMA, slow EMA is resistance. Thus, when we see the cross bellow and it’s under the slow EMA, we called it «strong Bearish Signal».
To make your trading process easier, we plotted the places of crosses on the chart and added the descriptions of the crosses. The flags mean the place of cross. The default parameters have nice backtest on 1H chart. However, you can also change them depending on your goals and the time period. The places of cross looks like flags (red flag is «bearish» cross, green - «bullish»). As you can see, it’s really convenient.
I hope you’ll enjoy our heuristic of classical EMA Cross. We are sure that the meta data that we are taking into consideration makes the signals more accurate and the deals more profitable. The SkyRock Team with support of Trading View try to make your trading process more successful and profitable. Every day we works in conjunction to boost both your skills and trading balance. We hope, it’s really useful for you, dear traders!
Ichimoku all signalsIchimoku Cloud All Signals!
This indicator shows all Ichimoku Cloud signals for (entering/exiting/confirming/or even staying) in a position.
you can choose a signal related to your strategy and use it.
you can choose which signals to be shown on the chart by changing the settings.
here are some examples of signals that you can get from this indicator:
Crossover/under conversion line & base line
Crossover/under lead line1 & lead line2
Crossover/under conversion line & lead line1
Crossover/under base line & lead line1
Crossover/under conversion line & lead line2
Crossover/under base line & lead line2
Crossover/under close & base line
Cloud Breakouts in both directions!
and 74 signals more !!!!

MultiAlert LITEAllows one to set 5 price level alerts on one symbol (1 Stop Loss 4 Targets)
Alerts work by prices crosses under the stop loss or over the targets, enabling short reverses this.
Unlike regular MultiAlert, this actually draws a true horizontal price at your price.
This is a lighter version of MultiAlert, supporting only one symbol. Your price levels will appear on all charts unless you hide the indicator.
Make the alert with targets and stop loss set, every time you make a change you MUST REMAKE THE ALERT.
Please comment any problems .

Roc & Atr
Roc & Atr Orders
My indicator, where I compare the 20 bar change percentage with the 14 bar atr band, I hope it will be useful to everyone. the green zones can be interpreted as BUY and the red zone as SELL zone. In graphs with high motion and low atr, the channel narrowing can be interpreted as BUY and the channel opening as SELL.
No indicator shows you the right way ... The best way is your own thoughts

MACD Moving Average Convergence/Divergence - DurbtradeDurbtrade MACD - macd line changes color based on vertical direction. This makes it easier to see and discern movements and also helps the indicator to retain maximum functionality when taking up less chart real estate (also, having the color change really helps me see charts on small screens... such as when it's bright outside and I'm driving in my car and glancing at a chart on my phone... it helps having the info pop visually). A fill option is included to fill the space between the macd and signal lines, though I personally prefer to disable this function. Also, you get a zero line if you want it, and it doesn't extend past the current time, removing unnecessary info and keeping your chart looking a bit cleaner. Finally, there are color-coded, cross-over and cross-under background fills, signaling when the macd line crosses the signal line.
This is my 2nd published script, and 2nd script ever. If you like this style, see my 1st published script: Durbtrade Bollinger Bands Width.
Hope you find this useful.
Feel free to comment.

Previous Period Levels - X Alerts====== ABOUT THIS INDICATOR
- A simple but highly customisable display of previous higher time-frame
OHLC values, drawn using line.new and label.new. Nothing fancy but...
- Customised resolution input which excludes time frames lower than 1 hour
while extending the common higher reference inputs to include:
• 6, and 12 Hour
• 5 Day
• 3, and 6 Month
• 1 Year
- Alert conditions using an adjustable SMA to help reduce false positive
spam.
- Full visual customisation options for (almost) every aspect, so it can be
tuned to suit most individual preferences.
- In line with the miriad visual customisation options is the ability to
change the display format of the Labels, to show more or less information,
or disable them altogether.
====== REASON FOR STUDY
- To practice advanced user input option handling to allow for a full visual
customisation experience without stepping outside of, or interfering with,
the intended function of the indicator.
- Provide reasonably clear code commenting and structure in order to be
useful as a potential learning aid for others, and future reference for
myself.
====== DISCLAIMER
Any trade decisions you make are entirely your own responsibility.
I've made an effort to squash all the bugs, but you never know!
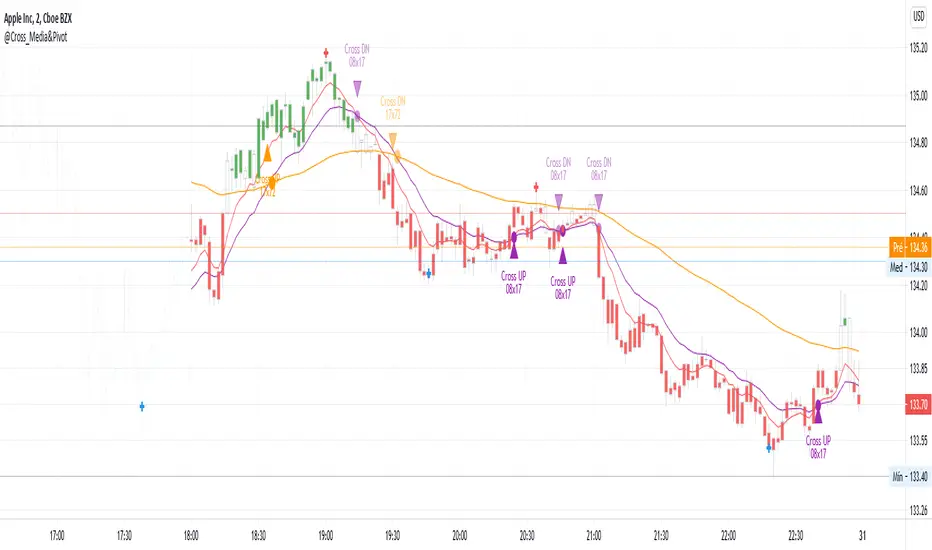
@Cross_Media&Pivot&TRADE_Entry_and_ExitThis script uses the functions plot(), cross(), plotcandle(), pivothigh() and pivotllow(). You can see the candles in the color green, above EMA 72 (Exponetional Move Average), and the color red, below EMA72. You can identify the position of the crossing UP and DOWN of the EMA 08 x EMA 17, EMA 17 x EMA72. You can identify the TRADE ENTRY points with the pivot high and TRADE EXIT with the pivot Low.
Bollinger Band Crossover SignalI'm a little surprised I couldn't find a BB crossover script on here since I've always used it on other charting software. So of course I had to write one in for TradingView.
Essentially what this script signifies are price breakouts when price crosses over the upper BB band. So what it shows is that market conditions are entering overbought territory.
Length is set to 20 and Standard Deviation is set to 2. These are the default settings.
The way I use the script is to identify breakouts in price, as well as a signal to start scaling out of a position if I am already in one.

Every single moving average (ALMA, EMA, HMA, KAMA, RMA, SMA...)So you may be looking at the graph and thinking "this is a mess", and I agree.
The purpose of this script is to plot in the same graph every single type of moving average that I could think of, so you can find the ones that are better for your timeframe and for your asset. Once you add it, disable those types that doesn't seem to serve your purpose, until you can select one you like.
The average types are: ALMA, EMA, HMA, KAMA, RMA, SMA, SWMA, VIDYA, VWAP, VWMA, and WMA. Each one is ploted two times (except SWMA and VWAP), one with a short period, and another with a long, both of which you can configure.
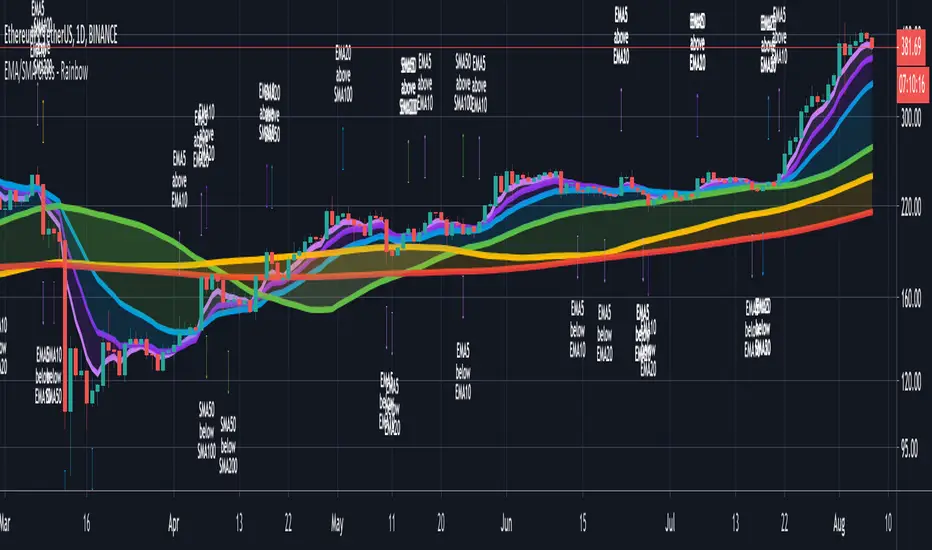
CryptoSignalScanner - Advanced Moving Averages - Cross & RainbowDESCRIPTION:
With this script you can plot 6 moving averages.
You can decide which Moving Average you want to show or hide.
For every plot you can decide to display the Simple Moving Average ( SMA ) or Exponential Moving Average ( EMA ).
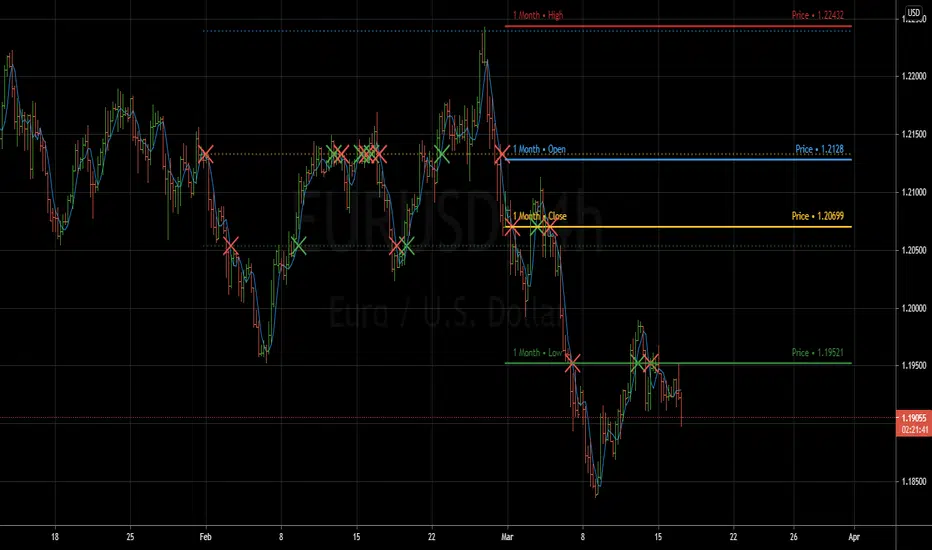
It provides CrossOver and CrossUnder labels when loading the script. Those labels you can show or hide.
You have the possibility to show or hide the rainbow colors. This rainbow function gives you a clear view of the current trend.
HOW TO USE:
• When one Moving Average crosses above another Moving Average it signals an uptrend.
• When one Moving Average crosses below another Moving Average it signals a downtrend.
• The higher to length of the Moving Average the stronger the trend.
FEATURES:
• You can show/hide the preferred Moving Averages.
• You can set the length, type and source for every Moving Average.
• You can show/hide the rainbow colors.
• You can show/hide the CrossUp labels.
• You can show/hide the CrossDown labels.
• You can set alerts for every Moving Average.
• Etc...
DEFAULT SETTINGS:
• MA1 => EMA5
• MA2 => EMA10
• MA3 => EMA20
• MA4 => SMA50
• MA5 => SMA100
• MA6 => SMA200
Simple Moving Average vs. Exponential Moving Average:
SMA and EMA are calculated differently. The exponential moving average ( EMA ) focuses more on recent prices than on a long series of data points, as the simple moving average required.
The calculation makes the EMA quicker to react to price changes and the SMA react slower. That is the main difference between the two.
One is not necessarily better than another. It comes down to personal preference. Plot an EMA and SMA of the same length on a chart and see which one helps you make better trading decisions.
Moving Average Trading Strategies:
The first strategy is a price crossover, when the price crosses above or below a moving average, it signals a potential change in trend.
The second strategy applies when one moving averages crosses another moving average.
• When the short-term MA crosses above the long-term MA, it signals a buy signal.
• When the short-term MA crosses below the long-term MA, it signals a sell signal.
REMARKS:
• This advice is NOT financial advice.
• We do not provide personal investment advice and we are not a qualified licensed investment advisor.
• All information found here, including any ideas, opinions, views, predictions, forecasts, commentaries, suggestions, or stock picks, expressed or implied herein, are for informational, entertainment or educational purposes only and should not be construed as personal investment advice.
• We will not and cannot be held liable for any actions you take as a result of anything you read here.
• We only provide this information to help you make a better decision.
• While the information provided is believed to be accurate, it may include errors or inaccuracies.
If you like this script please donate some coins to share your appreciation.
Good Luck,
SEOCO
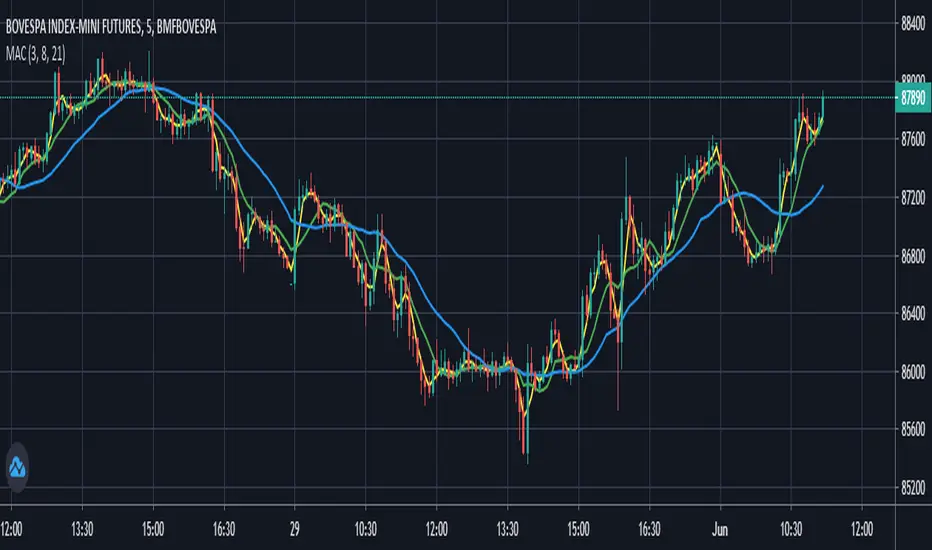
Moving Averages Convergence (Agulhada do Didi)The script is based on a strategy developed by Odir “Didi” Aguiar called “Agulhada do Didi”.
It consists in the use of 3 moving averages:
SMA 3
SMA 8
SMA 21
Strategy:
When the averages come together, preferably they pass through a candle, there is a signal. The crossing of the short average (3) with the long average (21) provides us with a confirma-tion of the entry.
Buy:
The average of 3 periods comes out on top, 8 goes in the middle and 21 goes down.
Sell:
Average of 21 periods comes out on top, 8 in the middle and 3 down.
Fancy Triple Moving Averages [BigBitsIO]This script is for three moving averages with as many features as I can possibly fit into a single moving average.
Features:
- Three moving averages (MA1, MA2, MA3).
- Standard MA inputs.
- MA type.
- MA period.
- MA price.
- MA resolution (time frame).
- Visibility toggle.
- MA Candle Type
- Fancy MA inputs.
- Toggle to show only candles included in the MA calculation ("Highlight inclusion") or display entire MA history.
- Toggle to show a ghost trail when Highlight inclusion is toggled on. Displays a shaded version of past MA history before the inclusion period (as seen on snapshot).
- Toggle to show forecast values for the MA.
- Other inputs related to forecasting:
- Forecast bias. (Neutral forecasts MA if the current price remains the same.)
- Forecast period.
- Forecast magnitude.
*** DISCLAIMER: For educational and entertainment purposes only. Nothing in this content should be interpreted as financial advice or a recommendation to buy or sell any sort of security or investment including all types of crypto. DYOR, TYOB. ***

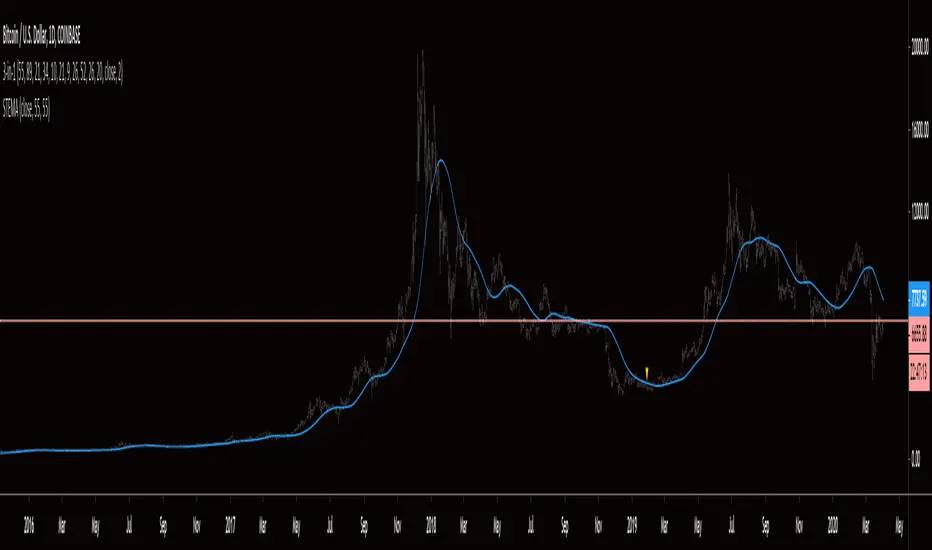
Smoothed Triple EMAThis indicator is exactly as it sounds, a smoothed triple EMA . In my personal use, it is applied to strategies to indicate direction of entries. A simple example would be if price is above the STEMA, look for long entries, if price is below the STEMA, look for short entries. Shortly, I will share a strategy that makes use of this indicator. You are welcome to message me if you have any questions. Thanks for checking it out an may the probabilities be with you!