Candlestick Patterns v1.0🔍 Overview
Candlestick Patterns v1.0 automatically identifies popular bullish and bearish candlestick formations directly on your chart.
It highlights potential reversal and continuation signals using color-coded visual markers — so traders can quickly spot opportunities without manually scanning candles.
This tool is designed for traders who rely on price action, pattern confirmation, or trend reversal analysis.
⚙️ Features
Detects major patterns:
Doji, Dragonfly Doji, Gravestone Doji
Morning Star and Evening Star
Hammer and Inverted Hammer
Bullish & Bearish Engulfing
Shooting Star and Hanging Man
Customizable bullish/bearish colors
Toggle each pattern on or off
Lightweight and compatible with all timeframes and instruments
🧠 How to Use
1. Add to chart — open the indicator and click Add to chart.
2. Choose patterns — open Settings → Inputs and select which patterns to display.
3. Interpret signals:
🟢 Bullish patterns appear below candles (possible buy/reversal areas).
🔴 Bearish patterns appear above candles (possible sell/reversal areas).
4.Use alongside other tools like RSI, Moving Averages, or Volume for confirmation.
💡 Tips
Look for Hammers or Bullish Engulfing at support in a downtrend → strong buy signals.
Look for Shooting Stars or Bearish Engulfing at resistance in an uptrend → potential short setups.
Avoid using on extremely low timeframes unless combined with filters (trend/RSI/volume).
👨💻 Author
Created by @hjvasoya
© 2025 — Published under the Mozilla Public License 2.0
Candlestickspatterns

Failed 2D & Failed 2U BarsI created this indicator to plot a triangle when a candle is either 1) a failed 2 down--the candle breaks the low of the prior candle but closes green (or higher than its opening price) and doesn't break the high of the previous candle; and 2) a failed 2 up--high of the prior candle is broken but the bar is red and does not break the low of the prior candle.
It has alerts which you can set up in the alert system.
I think that this candle is one of the most telling and powerful when it comes to candle analysis.
R.I.P. Rob Smith, Creator of The Strat.
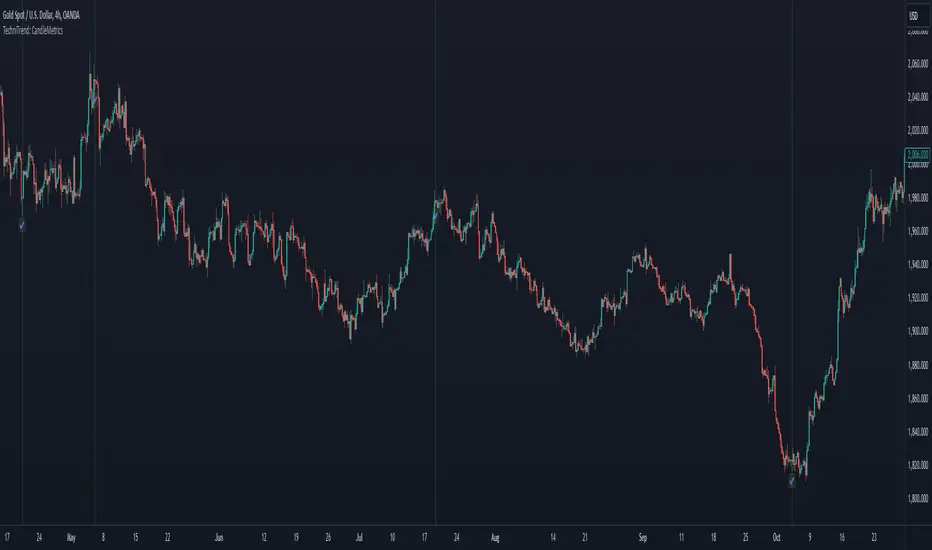
TechniTrend: CandleMetrics🟦 Overview
The TechniTrend: CandleMetrics Indicator is a powerful tool designed to give traders an in-depth analysis of candlestick structures. This indicator allows users to identify potential reversal points, trend continuations, and other crucial market behaviors by examining key ratios between candle components—such as body, shadow, and overall range—alongside volume conditions. The advanced filtering options offer flexibility for both novice and experienced traders, enabling tailored setups to suit different trading strategies.
🟦 Key Features
🔸Customizable Ratios: Set thresholds for Body-to-Range, Shadow-to-Range, Upper Shadow-to-Range, and Lower Shadow-to-Range ratios.
🔸Volume-Based Filters: Integrate volume conditions to strengthen the reliability of signals.
🔸Flexible Conditions: Choose whether filters should work independently or in combination, allowing for precise pattern identification.
🔸Visual Markers: Mark potential signals with a distinct background color and symbols on the chart.
🔸Alerts: Receive notifications for each selected condition, ensuring you never miss an opportunity.
🟦 How It Works
The CandleMetrics Indicator operates by analyzing the relationship between different components of each candlestick, combined with volume data to determine the strength of signals. Here’s a detailed breakdown of each feature:
🔸 Body to Range Ratio:
This filter compares the size of the candle's body to its total range (from high to low).
Example Setting: If you’re interested in spotting candles with small bodies relative to their total range, you might set the Body-to-Range Ratio to “Less than 0.3.”
🔸 Shadow to Range Ratio:
This examines the combined size of both shadows (upper and lower) relative to the entire candle range.
Example Setting: Use a Shadow-to-Range Ratio set to “More than 0.8” to find candles with significant wick lengths, suggesting market indecision.
🔸 Upper Shadow to Range Ratio:
This filter assesses the proportion of the upper shadow (wick) in relation to the candle’s full range.
Example Setting: “Less than 0.05” can help identify situations where the upper shadow is minimal, indicating strong downward pressure.
🔸 Lower Shadow to Range Ratio:
It measures the lower shadow compared to the entire candle range.
Example Setting: “More than 0.7” is useful for detecting potential rejection patterns at lower prices, hinting at a possible bullish reversal.
🔸 Volume Filter:
Integrates volume data to verify the reliability of each candle pattern.
Example Setting: Apply a Volume Filter Length of 100 with an SMA type to smooth volume data over a longer period, filtering out short-term noise and focusing on significant volume shifts.
🟦 Combining Filters
The indicator offers an option to Combine Filters. When this setting is enabled, all selected conditions must be met simultaneously for a candle to be marked. If disabled, each condition functions independently, allowing more flexibility in detecting diverse patterns.
🟦 Examples & Use Cases
🔸Example 1: Spotting Reversal Opportunities
I used the following configuration to find potential bullish reversals:
Upper Shadow to Range Ratio: “Less than 0.05” – Looking for candles with almost no upper shadow.
Lower Shadow to Range Ratio: “More than 0.7” – Highlighting candles with a significant lower shadow.
Volume Filter Length: 100 with SMA.
This setup effectively highlights candles where price rejection is happening at lower levels, suggesting a potential trend reversal to the upside.
🔸Example 2: Detecting Market Uncertainty
If you want to focus on candles showing market hesitation, try:
Shadow to Range Ratio: “More than 0.85” – Emphasizing long-wick candles that could indicate indecision.
Disable Combine Filters to allow flexibility, marking any candle meeting the above criteria.
🟦 Detailed Explanation of Each Option
Here’s a clear and concise breakdown of each option for a better understanding:
1. Body to Range Ratio
Purpose: This ratio shows how significant the candle's body is compared to its overall range. A smaller body-to-range ratio can indicate a potential reversal if the market appears indecisive.
How to Use: Increase the ratio to filter for stronger trend candles; decrease it to identify reversal or indecision candles.
2. Shadow to Range Ratio
Purpose: This filter captures the size of both shadows relative to the candle's total range. A larger ratio often points to market hesitation, while a smaller ratio suggests a decisive move.
How to Use: Adjust this filter to focus on candles with long wicks (indecision) or short wicks (decisiveness).
3. Upper Shadow to Range Ratio
Purpose: Helps to identify candles with strong downward moves by focusing on the upper wick length. A small upper shadow can imply sellers' dominance.
How to Use: Lower the ratio to detect candles with minimal upward rejection.
4. Lower Shadow to Range Ratio
Purpose: Targets candles with strong buying pressure by analyzing the lower shadow. A larger lower shadow may indicate a bullish reversal.
How to Use: Increase the ratio to spot rejection candles with significant lower shadows.
5. Volume Filter
Purpose: Adds a volume component to verify the validity of each candlestick pattern. Higher-than-average volume often signifies the strength of a move.
How to Use: Adjust the filter length and type to smooth out volume fluctuations based on your trading timeframe.
🟦 Indicator Alerts
Each filter has its own alert configuration, enabling traders to stay updated on market conditions that meet their selected criteria. You can customize alerts to trigger whenever a condition is met, helping to manage trades even when away from the screen.
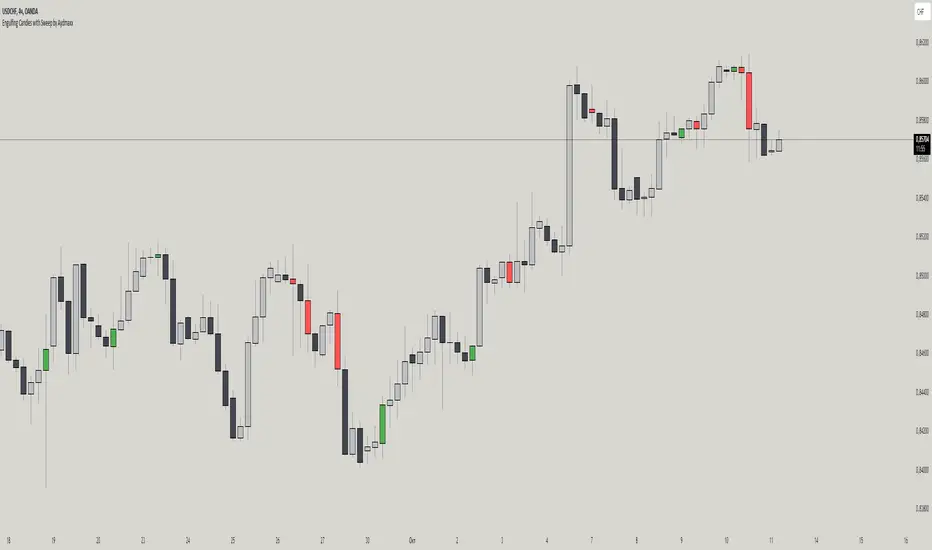
Engulfing Candles with Sweep by AydmaxxEngulfing Candles with Sweep Indicator
The "Engulfing Candles with Sweep" indicator identifies bullish and bearish engulfing candles that exhibit liquidity sweeps. It marks these significant candlestick patterns and draws a 50% Fibonacci retracement line from the high to low of the engulfing candle. The indicator helps traders spot potential reversal points where large market players might be accumulating or distributing positions.
Key Features:
Bullish Engulfing Candle with Sweep:
Identifies when a bullish candle (closing higher than it opened) engulfs the previous bearish candle (closing lower than it opened).
Ensures that the bullish candle’s low is lower than the previous candle’s low, indicating a sweep of liquidity.
Marks the identified bullish candle with a symbol below the candlestick.
Draws a 50% Fibonacci retracement line from the high to the low of the bullish engulfing candle.
Bearish Engulfing Candle with Sweep:
Identifies when a bearish candle (closing lower than it opened) engulfs the previous bullish candle (closing higher than it opened).
Ensures that the bearish candle’s high is higher than the previous candle’s high, indicating a sweep of liquidity.
Marks the identified bearish candle with a symbol above the candlestick.
Draws a 50% Fibonacci retracement line from the high to the low of the bearish engulfing candle.
Customizable Settings:
Fibonacci Line Color: Allows customization of the Fibonacci retracement line color for both bullish and bearish engulfing candles.
Fibonacci Line Style: Provides options to choose the line style (solid, dotted, dashed).
Fibonacci Line Width: Enables adjustment of the line width for better visibility.
Toggle Fibonacci Lines: Option to enable or disable the display of Fibonacci retracement lines.
How to Use:
Apply the indicator to your chart.
Look for symbols below or above the candlesticks, indicating bullish or bearish engulfing candles with liquidity sweeps.
Utilize the 50% Fibonacci retracement lines to identify potential support or resistance levels.
Benefits:
Helps in identifying key reversal patterns in the market.
Provides visual aids with Fibonacci retracement levels for potential entry and exit points.
Enhances trading decisions by confirming engulfing patterns with liquidity sweeps.
BCA Candlestick Pattern Condition BuilderThe "Candlestick Pattern Condition Builder" is an indicator developed for traders who want to create and customize their own trading strategies based on candlestick patterns. It allows users to set specific conditions for entering and exiting trades, both long and short. By enabling traders to define up to five conditions based on various price points (Open, High, Low and Close) and logical operators, it provides a flexible framework for building complex trading strategies tailored to individual preferences and market behavior.
Now traders can easily configure their favorite candlestick patterns like Doji, three white soldiers, three black crows or any other pattern using this indicator.
Here are the settings to customize the indicator:
Intraday Setting:
The indicator supports time-based trading by allowing users to define specific intraday sessions. Traders can set the start and end times for trading activities, ensuring that the strategy only executes trades within the defined market hours. This feature is particularly useful for intraday traders who want to avoid overnight positions and focus on capturing intraday price movements. Users can toggle the time-based entry and exit settings on or off, providing additional flexibility in managing their trading sessions.
Long and Short Candle Configuration:
"Condition Builder" enables users to configure conditions for both long and short trades using historical candle data. Traders can select different price points (open, high, low, close) from the past five bars to create their conditions. Each condition can be set with logical operators such as greater than, less than, greater than or equal to, less than or equal to, and equal to. This allows for detailed and precise condition-building, enabling traders to tailor their strategies to specific market patterns and behaviors. Note that between any two candlestick conditions "AND" operator is used.
Candle number representation as follows:
0 - N candle (current candle)
1 - N-1 candle (previous candle)
2 - N-2 candle
3 - N-3 candle
4 - N-4 candle
Stoploss and Target Options:
The indicator allows users to set stop-loss and target levels based on various criteria. Traders can choose to set these levels as a percentage, a fixed number of points, or based on the highest or lowest prices of selected candles. Additionally, the indicator supports risk
targets, providing a method to calculate targets in relation to the stop-loss distance. These features help traders manage their risk effectively and ensure that their strategies have well-defined exit points.
Stoploss Options:
1. Percentage Stoploss:
This option allows traders to set a stop-loss level as a percentage of the entry price. For example, if the stop-loss is set at 2%, the trade will close if the price moves 2% against the entry price. This dynamic approach adjusts the stop-loss level based on the trade's entry price, providing flexibility and proportional risk management.
2. Points Stoploss:
With this option, traders specify a fixed number of points for the stop-loss. For instance, if the stop-loss is set to 50 points, the trade will close if the price moves 50 points against the entry price. This fixed approach is straightforward and easy to implement, offering a clear and consistent risk threshold.
3. Highest/Lowest of Selected Candles:
This stop-loss method uses the highest or lowest prices of selected historical candles to determine the stop-loss level. Traders can select specific past bars, and the stop-loss will be set at the highest high (for short trades) or the lowest low (for long trades) of those bars. This method is useful for incorporating recent price action into risk management.
Target Options:
1. Percentage Target:
Similar to the percentage stop-loss, this option sets the target level as a percentage of the entry price. If the target is set at 5%, the trade will aim to close when the price moves 5% in favor of the entry price. This approach ensures that the target is proportionally related to the entry price, aligning with the trader’s desired profit margin.
2. Points Target :
This target option allows traders to set a specific number of points as the target. For example, if the target is set to 100 points, the trade will aim to close when the price moves 100 points in favor of the entry price. This method provides a clear and fixed profit goal, making it easy to implement and understand.
3. Risk:Reward :
The Risk:Reward sets the target level based on a multiple of the stop-loss distance. For example, with a risk ratio of 1:2 and a stop-loss distance of 50 points, the target will be set at 100 points (2 times the stop-loss distance). This approach helps traders maintain a consistent risk profile, aiming for higher profits relative to the risk taken on each trade.
Best practice: Use it with other price action concepts or indicators to make it effective.

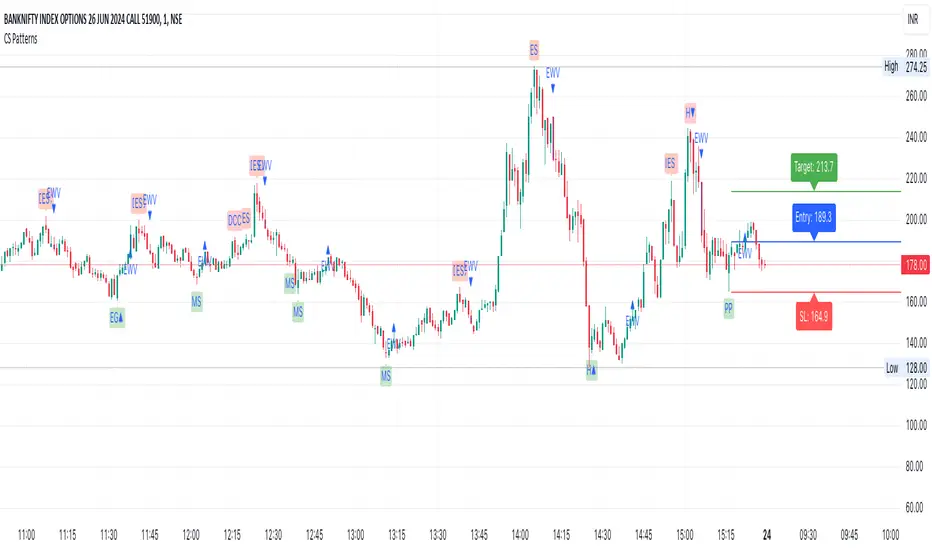
CS PatternsOverview
The CS Patterns indicator is designed to identify and highlight various candlestick patterns on a trading chart. Candlestick patterns are a crucial tool for traders as they help in predicting market movements and potential reversals. This indicator includes single, double, and triple candlestick patterns without revealing the source code, making it an ideal tool for traders who want to utilize advanced pattern recognition while keeping the script proprietary.
Candlestick Patterns Included
Single Candlestick Patterns
Bullish Hammer:
Found at the bottom of a downtrend.
Features a small body, long lower shadow, and little to no upper shadow.
Indicates potential reversal to an uptrend.
Bearish Hanging Man:
Found at the top of an uptrend.
Similar structure to the Bullish Hammer but indicates a potential reversal to a downtrend.
Bullish Inverted Hammer:
Found at the bottom of a downtrend.
Features a small body, long upper shadow, and little to no lower shadow.
Suggests a potential reversal to an uptrend.
Bearish Shooting Star:
Found at the top of an uptrend.
Indicates a potential reversal to a downtrend.
Dragonfly Doji:
Small or non-existent upper shadow and long lower shadow.
Indicates a potential reversal when found at the bottom of a trend.
Gravestone Doji:
Long upper shadow and small or non-existent lower shadow.
Indicates a potential reversal when found at the top of a trend.
Standard Doji:
Very small body, indicates indecision in the market.
Can signal reversals when found at the tops or bottoms of trends.
Long-Legged Doji:
Long upper and lower shadows with a small body.
Indicates a potential market reversal.
Double Candlestick Patterns
Bullish Engulfing:
A smaller bearish candle followed by a larger bullish candle that engulfs it.
Indicates a potential reversal to an uptrend.
Bearish Engulfing:
A smaller bullish candle followed by a larger bearish candle that engulfs it.
Indicates a potential reversal to a downtrend.
Bullish Harami:
A large bearish candle followed by a smaller bullish candle within its range.
Indicates a potential reversal to an uptrend.
Bearish Harami:
A large bullish candle followed by a smaller bearish candle within its range.
Indicates a potential reversal to a downtrend.
Bullish Piercing Line:
A bearish candle followed by a bullish candle that closes above the midpoint of the previous candle.
Indicates a potential reversal to an uptrend.
Bearish Dark Cloud Cover:
A bullish candle followed by a bearish candle that closes below the midpoint of the previous candle.
Indicates a potential reversal to a downtrend.
Bullish Inside Bar:
A smaller bullish or bearish candle completely within the range of the previous bearish candle.
Indicates a potential continuation or reversal to an uptrend.
Bearish Inside Bar:
A smaller bullish or bearish candle completely within the range of the previous bullish candle.
Indicates a potential continuation or reversal to a downtrend.
Triple Candlestick Patterns
Bullish Morning Star:
A bearish candle followed by a smaller-bodied candle (bullish or bearish), and then a larger bullish candle.
Indicates a potential reversal to an uptrend.
Bearish Evening Star:
A bullish candle followed by a smaller-bodied candle (bullish or bearish), and then a larger bearish candle.
Indicates a potential reversal to a downtrend.
How to Use?
Adding the Indicator:
Open TradingView and go to the Pine Script Editor.
Copy and paste the provided code into a new script.
Save and add the script to your chart.
Interpreting the Signals:
The indicator will highlight the patterns on the chart with specific labels.
Use these visual cues to make informed trading decisions based on potential reversals or continuations indicated by the patterns.
Customizing the Settings:
The indicator allows for customization of various settings through input options.
Adjust these settings according to your trading strategy and preferences.
Volume Delta [hapharmonic]Volume Delta: Volume Delta is an indicator that simplifies how you analyze trading volumes and the percentage of buy-sell activities effortlessly.
As a trader or market analyst, understanding underlying volume and trade flows is critical. The Volume Delta indicator provides thorough insight into both the total volume and the percentage of buying versus selling within the current candlestick. This information is pivotal for those looking to gauge market momentum and sentiment more effectively.
Additionally, the Volume Delta indicator can plot the candlestick colors based on the percentage of the dominant buying or selling volume. The area between the open and close prices of the candlestick is considered 100% and fills with colors corresponding to the predominant volume at that percentage.
Volume Delta also integrates the concept of Net volume. This component is crucial as it reveals the real market sentiment by calculating the difference between the volume of trades executed at an uptick and those at a downtick.
🟠 Overview
This indicator now displays in two layouts. Recently, Tradingview introduced the "force_overlay=true" function in Pine Script , allowing plots to be moved to the main chart. Thus, all displays are from the same indicator.
🟠 USAGE
From the data displayed in 'plot.style_columns' , the peak area represents the entire volume, accounting for 100%. Within this area, there are two color levels indicating volume. If one type of volume, whether buying or selling, exceeds the other, the larger volume will be positioned behind and the smaller in front. This arrangement prevents the scenario where a higher buying volume obscures the smaller selling volume. Therefore, the two colors can be switched between the front and the back as needed.
As you can see, the 12 and 26-day Exponential Moving Averages (EMAs) are used, with the Volume Confirmation Length set at 6. Therefore, the crossing of the EMAs proceeds normally, but it is highlighted with three triangular arrows to indicate a high likelihood of a valid crossover. However, if the volume is insufficient, these markers won't be displayed, although the EMA crossover will still occur as usual. This can be useful for using volume to verify the significance of the EMA crossover.
🟠 Setting
If you enable the label, please be aware that the chart size will shrink, causing the candlestick display to become unclear. Therefore, you might need to select "Logarithmic" at the bottom right of your screen, or for mobile applications, press and hold on the price scale and choose "Logarithmic" to adjust the scale appropriately.
Enjoy!

Candlestick Reversal and Trend Signals [AlgoAlpha]🚀 Unleash your charting capabilities with the Candlestick Reversal and Trend Signals indicator by AlgoAlpha, your go-to tool for spotting pivotal market movements! This script enhances your trading experience by identifying key candlestick patterns and trend changes, perfect for traders aiming for precision in their technical analysis.
🛠 Key Features:
- 🔄 Multi-Timeframe Analysis : Leverages a timeframe multiplier to analyze levels on higher timeframes, enhancing the depth and applicability of insights.
- 🧩 Diverse Pattern Detection : Capable of detecting a wide array of patterns including Bull/Bear Engulfings, Dojis, Haramis, Piercing Lines, Dark Cloud Covers, and Morning/Evening Stars, each contributing to a robust trading strategy.
- 🔍 Dynamic Trend Filters : Utilizes three exponential moving averages (EMAs) and volume filters to decisively confirm trend directions and strength, providing a clearer picture of market dynamics.
- ⚙️ Customizable Settings : Features adjustable settings for filter period, signal thresholds, and appearance, allowing for a tailored analysis experience to fit individual trading styles.
- 📉 Swing Levels Identification : Marks significant high and low swing points on the chart, highlighting potential pivot points and trend reversals for strategic trading decisions.
📈 Quick Guide to Using the Candlestick Reversal and Trend Signals Indicator
1. 🛠 Add the Indicator : Add the indicator to your favorites. Adjust the settings to match your analysis needs.
2. 📊 Analysis : Keep an eye out for the specific symbols plotted on your chart that indicate various candlestick patterns. Use these signals to enhance your market analysis.
3. 🔔 Set Alerts : Enable alerts for the patterns you are most interested in to get notified of potential trading opportunities without needing to monitor the charts constantly.
Embark on your enhanced trading journey with this powerful tool! 🚀✨ Happy trading!
🧐 How It Works:
The Candlestick Reversal and Trend Signals indicator operates by integrating several candlestick patterns and trend analysis features to assist in making informed trading decisions. Initially, it gathers user-defined settings like the period for filtering, signal thresholds, and the desired patterns to detect. It analyzes candlestick formations such as Bull/Bear Engulfings, Dojis, Haramis, and more, by comparing the current candlestick's attributes (such as body length and direction) with previous data to identify potential market reversals or confirmations. The indicator enhances its accuracy through additional filters like volume ratios and exponential moving averages (EMAs) that help validate the strength and direction of trends. By marking these patterns and trends visually on the chart, it provides clear signals that aid traders in identifying significant market movements efficiently. The script is then complemented with the 3 EMA indicator for trend detection and swing levels for added confluence.

Dark Cloud [TradingFinder] Piercing Line Reversal chart Pattern
🔵 Introduction
"Reversal candlestick patterns" are among the Japanese candlestick patterns considered as alerts for a potential change in the current price trend. It is often assumed that by identifying reversal candlestick patterns, the price trend will definitely change, either from bullish to bearish or from bearish to bullish. However, this claim is not entirely accurate, and a change in price trend does not always mean a reversal.
Nonetheless, the importance of reversal candlestick patterns remains significant. By recognizing these patterns, you can better predict changes in the trend with higher probability and make better trading decisions.
🔵 Dark Cloud
The "Dark Cloud" pattern occurs when, after an upward trend, buyers continue to drive the price up in the first candle. However, in the next candle, with sellers entering and increasing selling pressure, the price starts to decrease compared to the close of the previous candle.
This price decrease is significant enough that in the last candle, the price goes lower than the open of the previous candle, serving as a warning sign for a potential change in price trend.
The fundamental principles for the formation of the "Dark Cloud" pattern include :
1.Two candles consisting of a positive candle (first candle) and a negative candle (second candle) whose main body should be above the halfway point of the first candle's main body but does not completely cover it.
2.The color of the main body of the second candle should be opposite to the color of the main body of the first candle.
Factors affecting the strength of the "Dark Cloud" pattern include :
1.The length of the bodies of both candles, especially the second candle, which increases the strength of the pattern.
2.The gap between the two bodies can also indicate the strength of the pattern.
3.The absence of a lower shadow in the second candle also indicates the strength of the pattern.
4.If the pattern forms in a price resistance range, it has more strength.
🔵 Piercing Line
The "Piercing Line" pattern occurs when, after a downward trend, sellers decrease the price by offering their shares on the first day. However, on the next day, with buyers entering and increasing demand, the price starts to increase compared to the close of the previous day.
This increase is significant enough that in the last candle, the price goes higher than the open of the previous day, serving as a warning sign for a reversal in the price trend. Overall, this pattern is the opposite of the "Dark Cloud" pattern and occurs under a bearish trend.
The fundamental principles for the formation of the "Piercing Line" pattern include :
1.Two candles consisting of a negative candle (first candle) and a positive candle (second candle) whose main body should be above the halfway point of the first candle's main body but does not completely cover it.
2.The color of the main body of the second candle should be opposite to the color of the main body of the first candle.
Factors affecting the strength of the "Piercing Line" pattern include :
1.The length of the bodies of both candles, especially the second candle, which increases the strength of the pattern.
2.The gap between the two bodies can also indicate the strength of the pattern.
3.The absence of an upper shadow in the second candle also indicates the strength of the pattern.
4.If the pattern forms in a price support range, it has more strength.
🔵 How to Use
The "green circle" symbol corresponds to the "Strong Piercing Line" signal, the "blue triangle" symbol corresponds to the "Weak Piercing Line" signal, the "red circle" symbol corresponds to the "Strong Dark Cloud" signal, and the "red triangle" symbol corresponds to the "Weak Dark Cloud" signal.
🔵 Setting
Using the "Show Dark Cloud" and "Show Piercing Line" buttons, you can enable or disable the display of Dark Cloud and Piercing Line.

CandleStick [TradingFinder] - All Reversal & Trend Patterns🔵 Introduction
"Candlesticks" patterns are used to predict price movements. We have included 5 of the best candlestick patterns that are common and very useful in "technical analysis" in this script to identify them automatically. The most important advantage of this indicator for users is saving time and high precision in identifying patterns.
These patterns are "Pin Bar," "Dark Cloud," "Piercing Line," "3 Inside Bar," and "Engulfing." By using these patterns, you can predict price movements more accurately and therefore make better decisions in your trades.
🔵 How to Use
Pin Bar : This pattern consists of a Candle where "Open Price," "Close Price," "High Price," and "Low Price" form the "Candle Body," and it also has "Long Shadow" and "Short Shadow." In the visual appearance of the Pin Bar pattern, we have a candle body and a pin bar shadow, where the candle body is smaller relative to the shadow.
Just as the candle body plays an important role in analysis, the pin bar shadow can also be influential. The larger the pin bar shadow, the stronger the expectation of a trend reversal.
When a "bearish pin bar" occurs at resistance or the chart ceiling, it can be predicted that the price trend will be downward. Similarly, at support points and the chart floor, a "bullish pin bar" can indicate an upward price movement.
Additionally, patterns like "Hammer," "Shooting Star," "Hanging Man," and "Inverted Hammer" are types of pin bars. Pin bars are formed in two ways: bullish pin bars have a long lower shadow, and bearish pin bars have a long upper shadow. Important: Displaying "Bullish Pin Bar" is labeled "BuPB," and "Bearish Pin Bar" is labeled "BePB."
Dark Cloud : The Dark Cloud pattern is one type of two-candle patterns that occurs at the end of an uptrend. The 2-candle pattern indicates the shape of this pattern, which actually consists of 2 candles, one bullish and one bearish. This pattern indicates a trend reversal and is quite powerful.
The Dark Cloud pattern is seen when, after a bullish candle at the end of an uptrend, a bearish candle opens at a higher level (weakly, equal, or higher) than the closing point of the bullish candle and finally closes at a point approximately in the middle of the previous candle. In this indicator, the Dark Cloud pattern is identified as "Wick" and "Strong" .
The difference between these two lies in the strictness of their conditions. Important: Strong Dark Cloud is labeled "SDC," and Weak Dark Cloud is labeled "WDC."
Piercing Line : The Piercing candlestick pattern consists of 2 candles, the first being bearish and consistent with the previous trend, and the second being bullish. The conditions of the pattern are such that the first candle is bearish and a price gap is created between the two candles upon the opening of the next candle because its opening price is below (weakly equal to or less than) the closing price of the previous candle.
Additionally, its closing price must be at least 50% above the red candle.
This means that the second candle must penetrate at least 50% into the first candle. Important: Strong Piercing Line is labeled "SPL," and Weak Piercing Line is labeled "WPL."
3 Inside Bar (3 Bar Reversal) : The 3 Inside Bar pattern is a reversal pattern. This pattern consists of 3 consecutive candles and can be either bullish or bearish. In the bullish pattern (Inside Up) formed at the end of a downtrend, the last candle must be bullish, and the third candle from the end must be bearish.
Additionally, the close price must be more than 50% of the third candle from the end. In the bearish pattern (Inside Down) formed at the end of an uptrend, the last candle must be bearish, and the third candle from the end must be bullish. Additionally, the close price must be less than 50% of the third candle from the end. Important: Bullish 3 Inside Bar is labeled "Bu3IB," and Bearish 3 Inside Bar is labeled "Be3IB."
Engulfing : The Engulfing candlestick pattern is a reversal pattern and consists of at least two candles, where one of them completely engulfs the body of the previous or following candle due to high volatility.
For this reason, the term "engulfing" is used for this pattern. This pattern occurs when the price body of a candle encompasses one or more candles before it. Engulfing candles can be bullish or bearish. Bullish Engulfing forms as a reversal candle at the end of a downtrend.
Bullish Engulfing indicates strong buying power and signals the beginning of an uptrend. This pattern is a bullish candle with a long upward body that completely covers the downward body before it. Bearish Engulfing, as a reversal pattern, is a long bearish candle that engulfs the upward candle before it.
Bearish Engulfing forms at the end of an uptrend and indicates the pressure of new sellers and their strong power. Additionally, forming this pattern at resistance levels and the absence of a lower shadow increases its credibility. Important: Bullish Engulfing is labeled "BuE," and Bearish Engulfing is labeled "BeE."
🔵 Settings
This section, you can use the buttons "Show Pin Bar," "Show Dark Cloud," "Show Piercing Line," "Show 3 Inside Bar," and "Show Engulfing" to enable or disable the display of each of these candlestick patterns.

Z-Score CandlesThe Z-Score Candles indicator is a powerful tool designed to help traders identify overbought and oversold conditions in the market. It utilizes the concept of the Z-score, which measures the deviation of a data point from its mean in terms of standard deviations.
By applying a sigmoid transformation to the Z-score values of the price candles, this indicator provides a visual representation of the market sentiment. The resulting sigmoid candles offer a clearer view of potential trend reversals and market extremes.
Parameters:
Length: The length parameter determines the number of bars used in the calculations. A higher value results in a smoother representation of the Z-scores, while a lower value makes the indicator more responsive to short-term price movements.
Features:
Sigmoid Function: The indicator incorporates a sigmoid function to transform the Z-score values, making them more suitable for visual analysis.
Original Price Candles: The indicator plots the sigmoid candles, representing the open, high, low, and close values of the price action. Green candles indicate a positive sentiment (szopen < szclose), while red candles indicate a negative sentiment (szopen >= szclose).
Oversold and Overbought Areas: The indicator creates horizontal lines at 0.1 and 0.9 on the y-axis, representing oversold and overbought levels, respectively. Additionally, it adds shaded areas to highlight the extreme regions.
Usage: Traders can utilize the Z-Score Candles indicator to identify potential market turning points, reversals, and overextended price levels. When the sigmoid candles reach the oversold or overbought areas, it may suggest a possible trend reversal or the initiation of a new trend.
Note: This indicator should be used in conjunction with other technical analysis tools and indicators to confirm trading decisions.

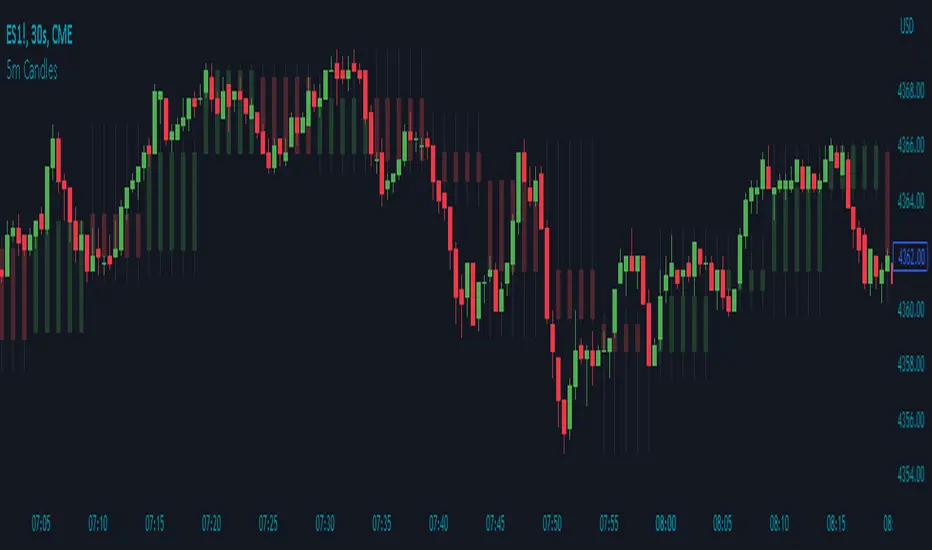
5m Candle OverlayDescription:
The 5m Candle Overlay indicator is a powerful technical analysis tool designed to overlay 5-minute candles onto your chart. This indicator enables detailed analysis of price action within the 5-minute time frame, providing valuable insights into short-term market movements.
How it Works:
The 5m Candle Overlay indicator calculates the OHLC (Open, High, Low, Close) values specifically for the 5-minute time frame. By utilizing the request.security function, it retrieves the OHLC values for each 5-minute candle. The indicator then determines the color for each candle based on a comparison between the close and open prices. Bullish candles are assigned a green color with 75% opacity, while bearish candles are assigned a red color with 75% opacity. Additionally, the indicator checks if the current bar index is a multiple of 5 to prevent overlapping and enhance visualization.
Usage:
To effectively utilize the 5m Candle Overlay indicator, follow these steps:
1. Apply the 5m Candle Overlay indicator to your chart by adding it from the available indicators.
2. Observe the overlay of 5-minute candles on your chart, providing a detailed representation of price movements within the 5-minute time frame.
3. Interpret the candles:
- Bullish candles (green by default) indicate that the close price is higher than the open price, suggesting potential buying pressure.
- Bearish candles (red by default) indicate that the close price is lower than the open price, suggesting potential selling pressure.
4. Note that the indicator plots candles with a vertical offset every fifth indicator to prevent overlapping, ensuring clarity and ease of interpretation.
5. Combine the analysis of the 5-minute candles with other technical analysis tools, such as support and resistance levels, trend lines, or indicators from different time frames, to gain deeper insights and identify potential trade setups.
6. Implement appropriate risk management strategies, including setting stop-loss orders and position sizing, to effectively manage your trades within the 5-minute time frame and protect your capital.
Candle Combo ScreenerThe Candle Combo Screener allows you to see candlestick combinations for up to 5 different tickers at the same time . If one of the candle combination is detected the corresponding cell will be highlighted to alert you.
Candle Combinations Detected
Bullish Kicker
Bullish & Bearish Oops Reversals
Open Equals High / Low
Inside Day
Select any 5 tickers. Colors and table settings are fully customizable to fit your style.
Bullish Kicker
The opening price of the current candle gaps up above the body of the prior day's candle AND the prior day's candle close was less than the open.
Oops Reversals
Bullish: Price opens below the prior day’s low and closes above.
Bearish: Price opens above the prior day's high and closes below.
Open Equals High / Low
The current candles opening price is equal to either the high or low of the day.
Inside Day
The current candles high and low are contained within the prior day's high and low.

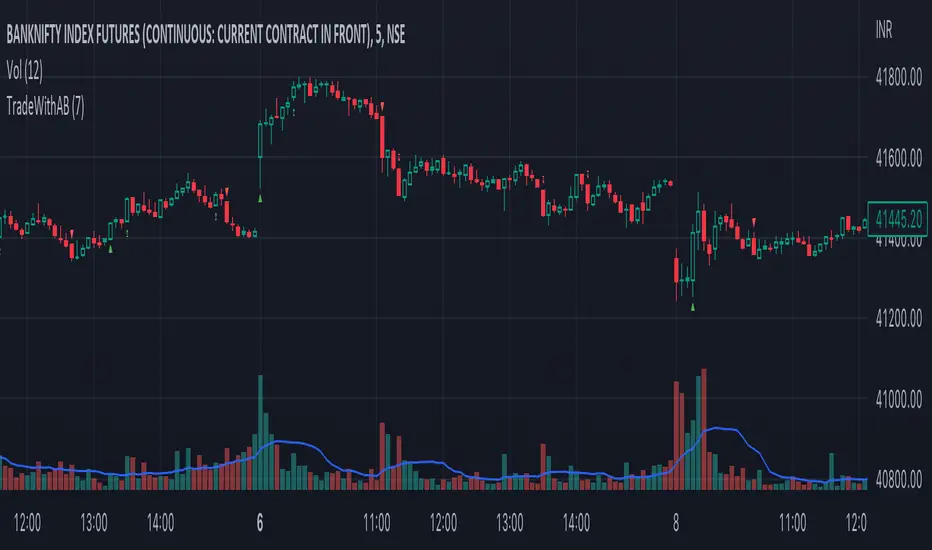
TradeWithAB SignalsThis indicator specifically designed for Momentum trading by an Intraday trader on index( Nifty , BankNifty ) and Equity stocks. This indicator works with DMI and PRICE ACTIONS which gives automated Buy and Sell signals along with Stop loss and Trailing Stop loss when certain criteria are met. It is not a Holy Grail system that gives you continuous profits and it has some limited downfalls also which can be controlled by proper risk Management and position sizing. This is a premium invite only indicator which can be use after given access to you by us. There are some guidelines on how to use this indicator which are given below and you have to follow these guidelines very strictly to get the maximum results.
Guidelines :-
1. Default Timeframe - 5 min
2. You have to take almost all the trade generated by this indicator on a particular stock/index for better results.
3. Signal confirmation is required for enter the trade as it will give you maximum profits.
4. GREEN TRIANGLE is represented as BUY Signal whereas RED TRIANGLE is represented as SELL Signal.
5. GREEN ARROW is considered as BUY TRAILING STOP LOSS as well as BUY RE-ENTRY for some scenarios.
6. RED ARROW is considered as SELL TRAILING STOP LOSS and SELL RE-ENTRY for some scenarios.
7. Ignore the signals(if any) of 1st candle(9:15)and last candle(3:25)of the day for better results.
BUY Trade Management :-
1. Trade should be initiated if and only if there is a buy signal(Green Triangle) is generated.
2. You should only enter the trade at the CLOSE of the signal generated candle.
3. Your Stop loss should be placed at the LOW of the signal generated candle.
4. There is a trailing Stop loss signal (Green Arrow) after the buying signal is generated.
5. You should trail your Stop loss at the LOW of the trailing Stop loss signal generated candle.
6. You should trail your Stop loss repeatedly until your trailing Stop loss got hit and hence Exit your buy trade.
7. After Exiting the trade you always have option to re-enter at the next trailing Stop loss signal(green arrow) generated candle CLOSE and put your Stop loss at LOW of that candle and repeat the same trailing stop loss procedures.
SELL Trade Management :-
1. Trade should be initiated if and only if there is a sell signal(Red Triangle) is generated.
2. You should only enter the trade at the CLOSE of the signal generated candle.
3. Your Stop loss should be placed at the HIGH of the signal generated candle.
4. There is a trailing Stop loss signal (Red Arrow) after the selling signal is generated.
5. You should trail your Stop loss at the HIGH of the trailing Stop loss signal generated candle.
6. You should trail your Stop loss repeatedly until your trailing Stop loss got hit and hence Exit your sell trade.
7. After Exiting the trade you have always option to re-enter at the next trailing Stop loss signal(red arrow) generated candle CLOSE and put your Stop loss at HIGH of that candle and repeat the same trailing stop loss procedures.
Disclaimer :-
*I am not a SEBI Registered Analyst and shall not be liable for any profit, loss or liability resulting, directly or indirectly from the use and results of the indicator. This is not a Holy Grail setup, sometimes the traders hit Stop loss and sometimes it gives amazing results as well.
Instructions to access to this invite-only script:-
*Send us a message if you wish to gain access to this indicator. The subscribers will get benefits of any future development or updates in the current script without any extra charges. Other trading style like swing and positional trading will also available in future updates.
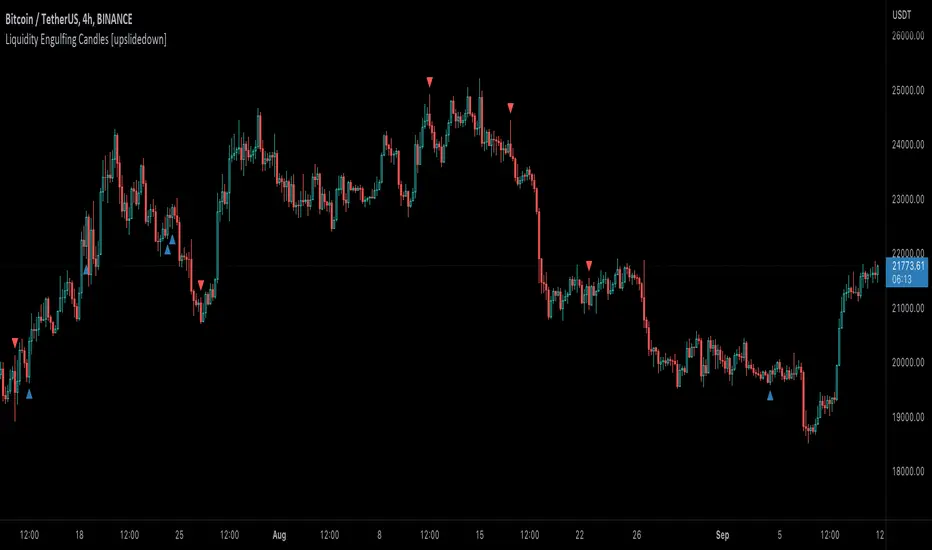
Liquidity Engulfing Candles [upslidedown]Liquidity engulfing candles (LEC) are a variant of a common candlestick pattern: engulfing candles but with a couple extra conditions applied. These conditions expect highs/lows to be taken out in order to show a continuation or reversal signal.
Filter 1: Stop Hunt Wick Filter
This filter requires the candle to wick into the prior candles high or low ( bullish = wick below prior candle lows). This is the stop hunt.
Filter 2: Close Filter
This filter requires the candle to close above or below above the prior candle ( bullish = close above prior candle high). This is the confirmation.
This idea was introduced to me by @attrk632. Thanks, mate!
((Bullish)) Candle below EMA Hello People of the Trading World...
Todays script is a basic concept of using Moving Averages and Candle Closes - this works best on Higher Timeframes and only in Bullish Conditions
"When the market is trending to the upside - we tend to see price overextend from the moving average and price revert back to the mean (Mean Reversion)"
You may ask why would you want this candle - this presents good opportunities in a trending market (NOT AN ENTRY CANDLE). This can be useful to get into existing trends which you may have missed
This candle will display when the candle close is below one of the below EMAS
9EMA
50EMA
100EMA
You can choose which one to show ie if the 21ema wasnt important but the 100ema was... turn off the 21ema and 50ema and this will display candle below the 100ema
This candle can be alerted in the settings so if price does close you wont miss it.
EXMAPLES:
If you find this script useful please leave a comment and a thumbs up :)

CANDLE FILTER Todays scripts is based on my Pullback And Rally Candles with other meaningful candles such as Hammers and Dojis.
You can choose which Candles to show on the cart and if you want to candles to appear above or below a moving average.
If you follow my work, you may recognise some of these candles which I'm about to show you however these candles are 1) more refined and 2) has moving average filters.
Ive included a D,6H,1H Candle in this script as on different timeframes - each swing low on average has a different amount of bars within the swing low / swing high so the DPB and RD will only work on the Daily
//Pullback candle
This candle is very powerful when used with simple Price Action such as Market Structure//Demand zones and support zones. (((((WORKS BEST IN UPTRENDS AND BOTTOM OF RANGES)))))
Ive included a D,6H,1H Pullback Candle in this script as on different timeframes - each swing low on average has a different amount of bars within the swing low so the DPB will only work on the Daily
//DAILY PULLBACK (Swing Traders)
snapshot
//4H PULLBACK (Swing Traders)
snapshot
- this signal will produce more signals due to the swing low filter on the 4H
//1H PULLBACK
snapshot
- this signal has been refined due to too many candle displaying in weak areas
!!!IF YOU DONT WANT TO USE PULLBACKS DURING DOWNTRENDS THEN USE THE EMA FILTER TO TURN OFF THE PULLBACKS WHEN PRICE IS BELOW THE MOVING AVERAGE!!!
//Rally candle (My personal Favourite) (((((WORKS BEST IN DOWNTRENDS AND TOP OF RANGES)))))
This candle is very powerful when used with simple Price Action such as Market Structure//Supply zones and Resistance zones.
//DAILY RALLY(Swing Traders)
snapshot
//4H RALLY(Swing Traders)
snapshot
- this signal will produce more signals due to the swing high filter on the 4H
!!!IF YOU DONT WANT TO USE RALLIES DURING UPTRENDSTHEN USE THE EMA FILTER TO TURN OFF THE RALLIES WHEN PRICE IS ABOVE THE MOVING AVERAGE!!!
//POWERFUL DOJIS (INDECISION)
snapshot
We look for indecision in key areas to see if momentum is shifting. When combined with Pullbacks or Rallys - this will enhance the odds of a probably area.
//HAMMERS
snapshot
//MOVING AVERAGES
snapshot
Short EMA = 50
Long EMA = 200
This filter can be used when the market is trending - look out for rejections off the moving averages
Also you can chance the Short And Long EMA to choose which MA cross you want to use
snapshot
ALSO ALL THE CANDLES HAVE A ALERT CONDITIONS WHICH YOU CAN ACCESS - THIS WILL ALERT ANY CANDLE YOU CHOOSE
Please leave a like/comment on this post as this is much appreciated....

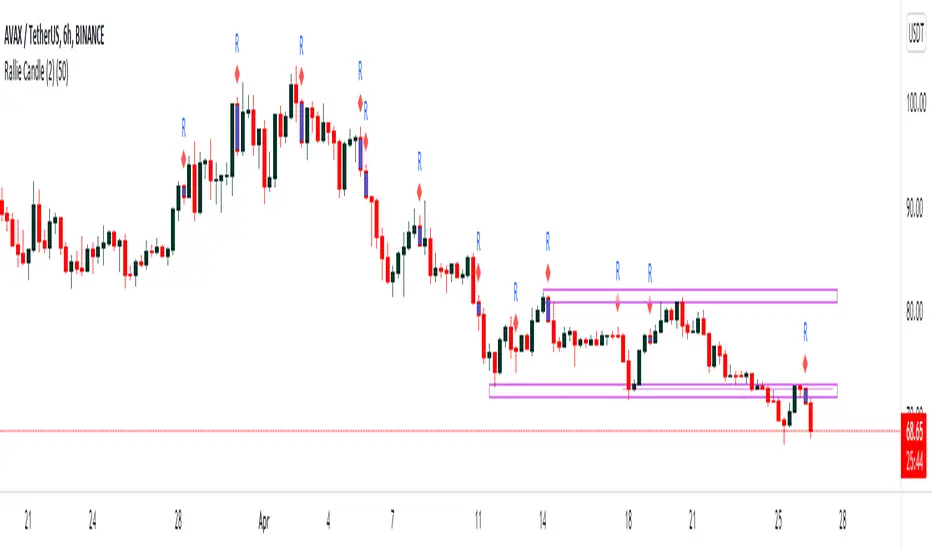
Rally HTF Candle (Candlestick Analysis) Guaranteed WinnersRally Candle will signal when price is at the end of a Rally to the upside and thus entering a balance phase in the market (works on all markets)
This candle works very efficient when the market is either trending downwards or in range markets where price is at resistance. (i would avoid in uptrends but depends on the trader)
Also we can expect this candle to form when price is overextended as the theory of this script is when there is a turning point in momentum - this candle will appear and we can look long from this signal.
This candle will only work in Swing High areas and appear when below an moving average which can be changed in the settings.
This candle will work only work pn the HTF as it provides very good rexpectancy whereas the LTF has a slightly less expectancy (i will be publishing an intraday Rally candle)
This candle can be alerted to signal the Rally Candle when the bar is confirmed and not during.
The way i trade this candle is
1) Candle signal must be in probably area to increase efficiency.
2) Enter on the second candle after candle IS CONFIRMED
3) Set stop loss below Rally Candle or use ATR value
4) Trade with the trend ie only Bearish price action
5) This candle can catch extreme points in the market ie this candle projected when ETH hit aths $4841
6) Trading with a confluence along with the Rally is better than solely trading this candle
Please leave a comment.
If we get to 100 likes i will publish the script.

Rally Candle (End Game ) 26/04/2022 Few Months ago I started wanted to code a candle which alerts me when a Rally may be over in Bearish Conditions and today I have created a candle which is 1. subjective but more importantly appears in areas where buying pressure is at either a climax or in the process of a decline and this is where the Rally Candle signals. This shows momentum may be shifting and these can provide some good entries.
They will only working when price is below the 200ema and in overextended markets - VERY IMPORTANT!!!
Works on all timeframe with HTF providing more price percentage than LTF
They aren’t a specific candle size however they will repaint when we see 4 higher close candles followed by a candle which has closed lower than the previous 4th.
//Candle Conditions
This candle has to be in a swing high area to be valid and on 1H and 6H but the 1H will repaint a lot of candles so when we have a point system of +20 we can assume this setup is a good setup.
//Candle Operators
You can change the color of the bar to your liking
There is a ema filter so if you want to candle to not show candles of the 50ema this operator will do the command.
Please post requests and any potential implementations I could port to pine script.
Hope you Enjoy :)
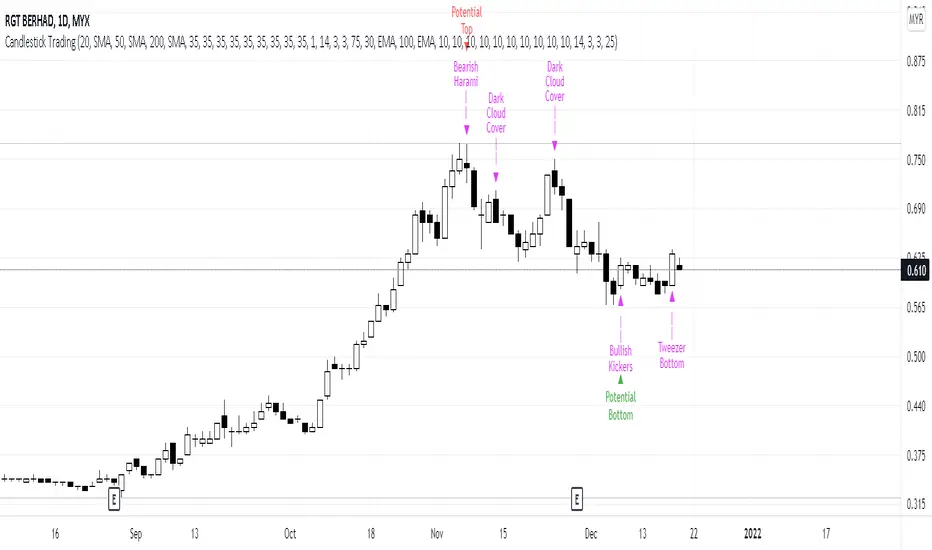
Candlestick Trading (Malaysia Stock Market)1. This indicator will indicate signals of bearish/bullish candlestick as below:
- 10 Bear Candles: Dark Cloud Cover, Bearish Kickers, Bearish Engulfing, Evening Star, Three Black Crows, Hanging Man, Shooting Star, Tweezer Top, Bearish Harami, Doji
- 10 Bull Candles: Piercing, Bullish Kickers, Bullish Engulfing, Morning Star, Three White Soldiers, Hammer, Inverted Hammer, Tweezer Bottom, Bearish Harami, Doji
2. In order for the Bear Candle signals to appear, these conditions should be met:
- Price must be above MA 1 (preset at SMA 20)
- Price must be above MA 2 (preset at SMA 50)
- Price must be above MA 3 (preset at SMA 200)
- In the range of specified trading days (preset at latest 10 days of trading)
3. For a strong bearish signal, a namely 'Potential Top' signal will appear on the top of the bearish candlestick signal. This 'Potential Top' signal will only appear under the condition of:
- Stochastic is at overbought area (preset at 75%)
4. In order for the Bull Candle signals to appear, these conditions should be met:
- Price must be in between MA 4 (preset at EMA 30) and MA 5 (preset at EMA 100)
- In the range of specified trading days (preset at latest 10 days of trading)
5. For a strong bullish signal, a namely 'Potential Bottom' signal will appear at the bottom of the bullish candlestick signal. This 'Potential Bottom' signal will only appear under the condition of:
- Stochastic is at oversold area (preset at 25%)
6. This indicator can help one to enter/exit a trade based on the bullish/bearish candlestick patterns that appear at the beginning/end of a trend, especially when the 'Potential Bottom/Top' appears with any of bullish/bearish candlestick signal.
7. However, this indicator is only designed for Malaysian Stocks Market as the script is based on the bids/pips calculation of the Malaysian Stocks Market. Nevertheless, I let the script open for everyone to modify it based on your own preference markets/instruments.
8. Hope you guys enjoy it. Thanks.
Candlestick Pattern IdentifierMy script builds upon another user-submitted script by rebuilding the logic used to identify candlestick patterns. The logic in my script is a mix of strict and lax guidelines to mitigate false flags and present valid buy and sell signals.
-To use this indicator, simply add it to any chart. It will identify trends on any time frame although the lower you go, the more signals you'll see and the higher probability of those signals being false flags. You can also disable any candlestick patterns that you feel are not as useful.
- This indicator works best with Stocks and also with Forex markets to a lesser extent.
- This indicator works the best on the Daily chart and also works (with varying degrees of success) on any timeframe at or above 1 hour. I've found that this indicator works the best when used in tandem with the Daily and Hourly charts with the Hourly chart being used to determine an entry point while the Daily chart is used for long term trend analysis.

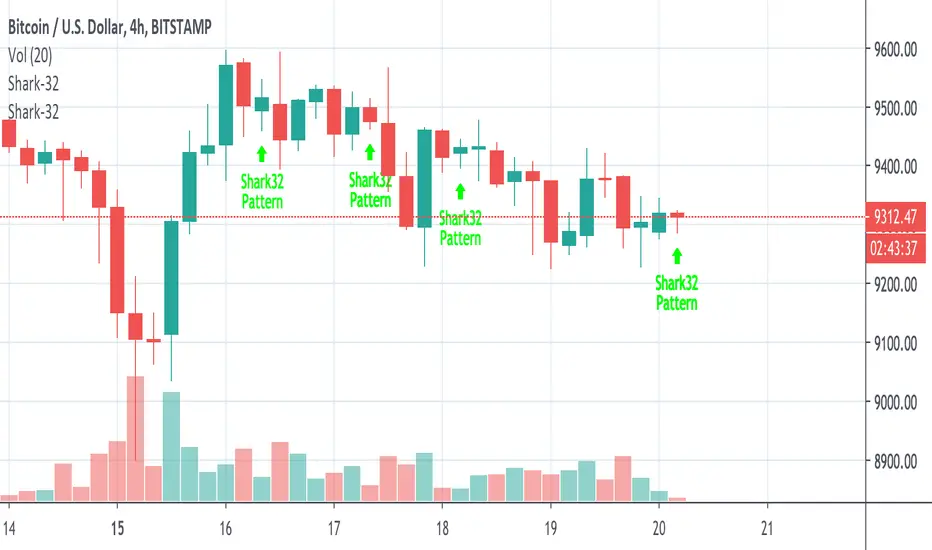
Shark-32 Pattern for Candle sticks AnalysisThis script is the perfect strategy for the all mighty shark-32 pattern.
It shows the power tussle between demand and supply before either of them finally gives up.