Elliott Wave (𝐒𝐓𝐄𝐄𝐋 𝐂𝐈𝐓𝐘 𝐂𝐑𝐄𝐀𝐓𝐎𝐑𝐒)This indicator provides a rules-based helper for visually identifying potential Elliott Wave patterns — including 1–5 impulse structures and optional A–B–C corrective moves. It automatically detects pivot highs/lows using the user-defined left/right swing settings and connects them with a ZigZag line filtered by either ATR or percentage change to reduce market noise.
When a valid 5-wave impulse structure is found (either bullish or bearish), the indicator labels waves 1–5 on the chart. After completion of the fifth wave, it optionally monitors for an A–B–C corrective pattern and labels those points when detected. Alerts are generated when an impulse or correction is confirmed.
Features
✅ Automatic pivot detection using configurable left/right swing bars.
✅ ATR or %-based swing filter to avoid small fluctuations.
✅ ZigZag plotting to visualize price structure.
✅ Automatic labeling of potential Elliott impulse waves (1–5).
✅ Optional A–B–C correction detection after wave 5.
✅ Alerts when impulses and corrections complete.
✅ Customizable visuals (colors, sensitivity, pivot length).
✅ Works on all symbols and timeframes.
Usage Tips
For best results, use larger timeframes (e.g., 1H–1D) where Elliott structures are cleaner.
Adjust Pivot Left/Right and ATR Multiplier for your chart’s volatility.
Remember: Elliott Wave theory is interpretive — this tool provides objective swing logic to assist manual analysis, not a guaranteed automatic wave count.
Candlestick analysis

Dammu AI PROType & Purpose
Multi-functional trend, swing, and smart money concept indicator.
Combines SuperTrend, SMA, ATR-based risk management, swing structures, order blocks, EQH/EQL, and Fair Value Gaps (FVG).
Designed for identifying trends, entries/exits, and support/resistance zones.
2. Trend Detection
SuperTrend with ATR smoothing (nsensitivity*7 factor) for buy/sell signals.
SMA filter (8 & 9 periods) confirms trend strength.
Bar color changes:
Green if close > supertrend.
Red if close < supertrend.
Cirrus Cloud highlights trend zones with semi-transparent colors.
3. Swing & Structure
Detects pivot highs/lows and labels them as HH/LH (Highs), HL/LL (Lows).
Generates BOS (Break of Structure) and CHoCH (Change of Character) signals.
Internal swing structures and order blocks for short-term intraday moves.
4. Order Blocks
Internal Order Blocks (iOBs) and Swing Order Blocks (OBs).
Boxes drawn for bullish/bearish zones.
Auto-delete when broken.
Option to filter blocks by ATR or Cumulative Mean Range.
5. Risk Management
TP/SL levels based on ATR and user-defined % risk.
Shows lines and labels for:
Entry
Stop Loss
TP1, TP2, TP3
Adjustable line style (solid/dashed/dotted).
6. Fair Value Gaps (FVG)
Highlights bullish and bearish gaps.
Option for auto-threshold filtering.
Extendable FVG boxes.
7. EQH/EQL
Detects Equal Highs (EQH) and Equal Lows (EQL) for potential reversals.
Dotted lines with labels.
8. Smart Money Concepts (SMC) Features
Shows:
Swings (internal & swing structure)
Internal order blocks
Premium/Discount zones
Fair Value Gaps
Highs/Lows from previous day/week/month
Configurable for historical vs present display.
9. Alerts
Buy/Sell triggers:
bull = crossover of close above SuperTrend.
bear = crossunder of close below SuperTrend.
Alerts for BOS/CHoCH, EQH/EQL, and OB breaks.
10. Visualization
Trend clouds, colored bars, SMA markers, SuperTrend labels.
Multi-layered info displayed without cluttering the chart.
Customizable colors, line styles, and transparency.
✅ Summary:
This indicator is a comprehensive trading tool for trend detection, swing structure, order block analysis, and risk management. It’s built for smart money and SMC-based trading, offering visual cues and alerts for key trading decisions.

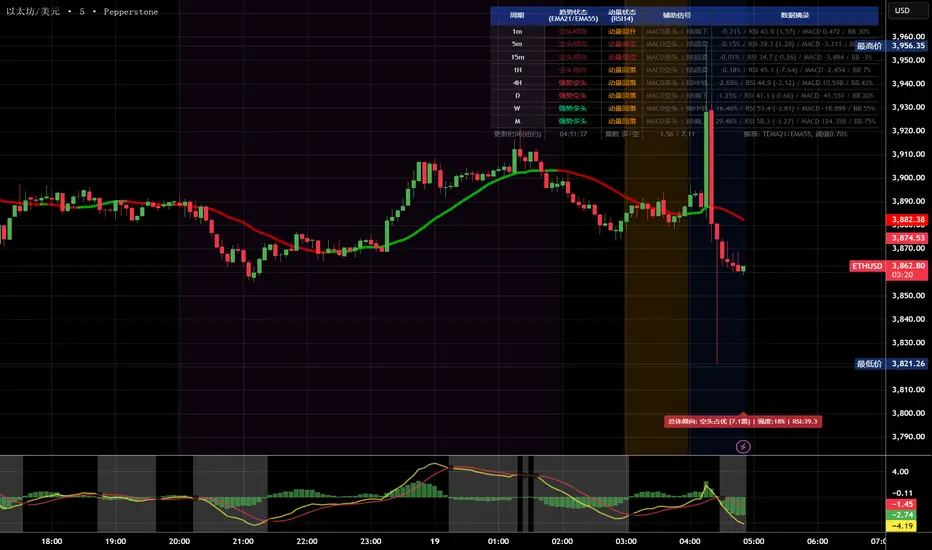
多周期趋势动量面板加强版(Multi-Timeframe Trend Momentum Panel - User Guide)多周期趋势动量面板(Multi-Timeframe Trend Momentum Panel - User Guide)(english explanation follows.)
📖 指标功能详解 (精简版):
🎯 核心功能:
1. 多周期趋势分析 同时监控8个时间周期(1m/5m/15m/1H/4H/D/W/M)
2. 4维度投票系统 MA趋势+RSI动量+MACD+布林带综合判断
3. 全球交易时段 可视化亚洲/伦敦/纽约交易时间
4. 趋势强度评分 0100%量化市场力量
5. 智能警报 强势多空信号自动推送
________________________________________
📚 重要名词解释:
🔵 趋势状态 (MA均线分析):
名词 含义 信号强度
强势多头 快MA远高于慢MA(差值≥0.35%) ⭐⭐⭐⭐⭐ 做多
多头倾向 快MA略高于慢MA(差值<0.35%) ⭐⭐⭐ 谨慎做多
震荡 快慢MA缠绕,无明确方向 ⚠️ 观望
空头倾向 快MA略低于慢MA ⭐⭐⭐ 谨慎做空
强势空头 快MA远低于慢MA ⭐⭐⭐⭐⭐ 做空
简单理解: 快MA就像短跑运动员(反应快),慢MA是长跑运动员(稳定)。短跑远超长跑=强势多头,反之=强势空头。
________________________________________
🟠 动量状态 (RSI力度分析):
名词 含义 操作建议
动量上攻↗ RSI>60且快速上升 强烈买入信号
动量高位 RSI>60但上升变慢 警惕回调,可减仓
动量中性 RSI在4060之间,平稳 等待方向明确
动量低位 RSI<40但下跌变慢 警惕反弹,可止盈
动量下压↘ RSI<40且快速下降 强烈卖出信号
简单理解: RSI就像汽车速度表。"动量上攻"=油门踩到底加速,"动量高位"=已经很快但不再加速了。
________________________________________
🟣 辅助信号:
MACD:
• MACD多头 = 柱状图>0 = 买方力量强
• MACD空头 = 柱状图<0 = 卖方力量强
布林带(BB):
• BB超买 = 价格在布林带上轨附近 = 可能回调
• BB超卖 = 价格在布林带下轨附近 = 可能反弹
• BB中轨 = 价格在中间位置 = 平衡状态
________________________________________
💡 快速上手 3步看懂面板:
第1步: 看"综合结论标签" (K线上方)
• 绿色"多头占优" → 可以做多
• 红色"空头占优" → 可以做空
• 橙色"震荡/均衡" → 观望
第2步: 看"票数 多/空" (面板最下方)
• 多头票数远大于空头 (差距>2) → 趋势强
• 票数接近 (差距<1) → 震荡市
第3步: 看"趋势强度" (综合标签中)
• 强度>70% → 强势趋势,可重仓
• 强度5070% → 中等趋势,正常仓位
• 强度<50% → 弱势,轻仓或观望
________________________________________
🎨 时段背景色含义:
• 紫色背景 = 亚洲时段 (东京交易时间) 波动较小
• 橙色背景 = 伦敦时段 (欧洲交易时间) 波动增大
• 蓝色背景 = 纽约凌晨 美盘准备阶段
• 红色背景 = 纽约关键5分钟 (09:3009:35) ⚠️ 最重要! 市场最活跃,趋势易形成
• 绿色背景 = 纽约上午后段 延续早盘趋势
交易建议: 重点关注红色关键时段,这5分钟往往决定全天方向!
________________________________________
⚙️ 三大市场推荐设置
🥇 黄金: Hull MA 12/EMA 34, 阈值0.250.35%
₿ 比特币: EMA 21/EMA 55, 阈值0.801.20%
💎 以太坊: TEMA 21/EMA 55, 阈值0.600.80%
参数优化建议
黄金 (XAUUSD)
快速MA: Hull MA 12 (超灵敏捕捉黄金快速波动)
慢速MA: EMA 34 (斐波那契数列)
RSI周期: 9 (加快反应)
强趋势阈值: 0.25%
周期: 5, 15, 60, 240, 1440
比特币 (BTCUSD)
快速MA: EMA 21
慢速MA: EMA 55
RSI周期: 14
强趋势阈值: 0.8% (波动大,阈值需提高)
周期: 15, 60, 240, D, W
外汇 EUR/USD
快速MA: TEMA 10 (快速响应)
慢速MA: T3 30, 因子0.7 (平滑噪音)
RSI周期: 14
强趋势阈值: 0.08% (外汇波动小)
周期: 5, 15, 60, 240, 1440
📖 Indicator Function Details (Concise Version):
🎯 Core Functions:
1. MultiTimeframe Trend Analysis Monitors 8 timeframes simultaneously (1m/5m/15m/1H/4H/D/W/M)
2. 4Dimensional Voting System Comprehensive judgment based on MA trend + RSI momentum + MACD + Bollinger Bands
3. Global Trading Sessions Visualizes Asia/London/New York trading hours
4. Trend Strength Score Quantifies market strength from 0100%
5. Smart Alerts Automatically pushes strong bullish/bearish signals
📚 Key Term Explanations:
🔵 Trend Status (MA Analysis):
| Term | Meaning | Signal Strength |
| | | |
| Strong Bull | Fast MA significantly > Slow MA (Diff ≥0.35%) | ⭐⭐⭐⭐⭐ Long |
| Bullish Bias | Fast MA slightly > Slow MA (Diff <0.35%) | ⭐⭐⭐ Caution Long |
| Ranging | MAs intertwined, no clear direction | ⚠️ Wait & See |
| Bearish Bias | Fast MA slightly < Slow MA | ⭐⭐⭐ Caution Short |
| Strong Bear | Fast MA significantly < Slow MA | ⭐⭐⭐⭐⭐ Short |
Simple Understanding: Fast MA = sprinter (fast reaction), Slow MA = longdistance runner (stable). Sprinter far ahead = Strong Bull, opposite = Strong Bear.
🟠 Momentum Status (RSI Analysis):
| Term | Meaning | Trading Suggestion |
| | | |
| Momentum Up ↗ | RSI >60 & rising rapidly | Strong Buy Signal |
| Momentum High | RSI >60 but rising slower | Watch for pullback, consider reducing position |
| Momentum Neutral | RSI between 4060, stable | Wait for clearer direction |
| Momentum Low | RSI <40 but falling slower | Watch for rebound, consider taking profit |
| Momentum Down ↘ | RSI <40 & falling rapidly | Strong Sell Signal |
Simple Understanding: RSI = car speedometer. "Momentum Up" = full throttle acceleration, "Momentum High" = already fast but not accelerating further.
🟣 Auxiliary Signals:
MACD:
MACD Bullish = Histogram >0 = Strong buyer power
MACD Bearish = Histogram <0 = Strong seller power
Bollinger Bands (BB):
BB Overbought = Price near upper band = Possible pullback
BB Oversold = Price near lower band = Possible rebound
BB Middle = Price near middle band = Balanced state
💡 Quick Start 3 Steps to Understand the Panel:
Step 1: Check "Composite Conclusion Label" (Above the chart)
Green "Bulls Favored" → Consider Long
Red "Bears Favored" → Consider Short
Orange "Ranging/Balanced" → Wait & See
Step 2: Check "Votes Bull/Bear" (Bottom of the panel)
Bull votes significantly > Bear votes (Difference >2) → Strong Trend
Votes close (Difference <1) → Ranging Market
Step 3: Check "Trend Strength" (In the composite label)
Strength >70% → Strong Trend, consider heavier position
Strength 5070% → Moderate Trend, normal position size
Strength <50% → Weak Trend, light position or wait & see
🎨 Trading Session Background Color Meanings:
Purple = Asian Session (Tokyo hours) Lower volatility
Orange = London Session (European hours) Increased volatility
Blue = NY Early Morning US session preparation phase
Red = NY Critical 5 Minutes (09:3009:35) ⚠️ Most Important! Market most active, trends easily form
Green = NY Late Morning Continuation of early session trend
Trading Tip: Focus on the red critical period; these 5 minutes often determine the day's direction!
⚙️ Recommended Settings for Three Major Markets
🥇 Gold (XAUUSD):
Fast MA: Hull MA 12 (Highly sensitive for gold's fast moves)
Slow MA: EMA 34 (Fibonacci number)
RSI Period: 9 (Faster reaction)
Strong Trend Threshold: 0.25%
Timeframes: 5, 15, 60, 240, 1440
₿ Bitcoin (BTCUSD):
Fast MA: EMA 21
Slow MA: EMA 55
RSI Period: 14
Strong Trend Threshold: 0.8% (High volatility, requires higher threshold)
Timeframes: 15, 60, 240, D, W
💎 Ethereum (ETHUSD):
Fast MA: TEMA 21
Slow MA: EMA 55
RSI Period: 14
Strong Trend Threshold: 0.600.80%
Timeframes: 15, 60, 240, D, W
💱 Forex EUR/USD:
Fast MA: TEMA 10 (Fast response)
Slow MA: T3 30, Factor 0.7 (Smooths noise)
RSI Period: 14
Strong Trend Threshold: 0.08% (Forex has low volatility)
Timeframes: 5, 15, 60, 240, 1440
多周期趋势动量面板(Multi-Timeframe Trend Momentum Panel - User Guide)多周期趋势动量面板(Multi-Timeframe Trend Momentum Panel - User Guide)(english explanation follows.)
📖 指标功能详解 (精简版):
🎯 核心功能:
1. 多周期趋势分析 同时监控8个时间周期(1m/5m/15m/1H/4H/D/W/M)
2. 4维度投票系统 MA趋势+RSI动量+MACD+布林带综合判断
3. 全球交易时段 可视化亚洲/伦敦/纽约交易时间
4. 趋势强度评分 0100%量化市场力量
5. 智能警报 强势多空信号自动推送
________________________________________
📚 重要名词解释:
🔵 趋势状态 (MA均线分析):
名词 含义 信号强度
强势多头 快MA远高于慢MA(差值≥0.35%) ⭐⭐⭐⭐⭐ 做多
多头倾向 快MA略高于慢MA(差值<0.35%) ⭐⭐⭐ 谨慎做多
震荡 快慢MA缠绕,无明确方向 ⚠️ 观望
空头倾向 快MA略低于慢MA ⭐⭐⭐ 谨慎做空
强势空头 快MA远低于慢MA ⭐⭐⭐⭐⭐ 做空
简单理解: 快MA就像短跑运动员(反应快),慢MA是长跑运动员(稳定)。短跑远超长跑=强势多头,反之=强势空头。
________________________________________
🟠 动量状态 (RSI力度分析):
名词 含义 操作建议
动量上攻↗ RSI>60且快速上升 强烈买入信号
动量高位 RSI>60但上升变慢 警惕回调,可减仓
动量中性 RSI在4060之间,平稳 等待方向明确
动量低位 RSI<40但下跌变慢 警惕反弹,可止盈
动量下压↘ RSI<40且快速下降 强烈卖出信号
简单理解: RSI就像汽车速度表。"动量上攻"=油门踩到底加速,"动量高位"=已经很快但不再加速了。
________________________________________
🟣 辅助信号:
MACD:
• MACD多头 = 柱状图>0 = 买方力量强
• MACD空头 = 柱状图<0 = 卖方力量强
布林带(BB):
• BB超买 = 价格在布林带上轨附近 = 可能回调
• BB超卖 = 价格在布林带下轨附近 = 可能反弹
• BB中轨 = 价格在中间位置 = 平衡状态
________________________________________
💡 快速上手 3步看懂面板:
第1步: 看"综合结论标签" (K线上方)
• 绿色"多头占优" → 可以做多
• 红色"空头占优" → 可以做空
• 橙色"震荡/均衡" → 观望
第2步: 看"票数 多/空" (面板最下方)
• 多头票数远大于空头 (差距>2) → 趋势强
• 票数接近 (差距<1) → 震荡市
第3步: 看"趋势强度" (综合标签中)
• 强度>70% → 强势趋势,可重仓
• 强度5070% → 中等趋势,正常仓位
• 强度<50% → 弱势,轻仓或观望
________________________________________
🎨 时段背景色含义:
• 紫色背景 = 亚洲时段 (东京交易时间) 波动较小
• 橙色背景 = 伦敦时段 (欧洲交易时间) 波动增大
• 蓝色背景 = 纽约凌晨 美盘准备阶段
• 红色背景 = 纽约关键5分钟 (09:3009:35) ⚠️ 最重要! 市场最活跃,趋势易形成
• 绿色背景 = 纽约上午后段 延续早盘趋势
交易建议: 重点关注红色关键时段,这5分钟往往决定全天方向!
________________________________________
⚙️ 三大市场推荐设置
🥇 黄金: Hull MA 12/EMA 34, 阈值0.250.35%
₿ 比特币: EMA 21/EMA 55, 阈值0.801.20%
💎 以太坊: TEMA 21/EMA 55, 阈值0.600.80%
参数优化建议
黄金 (XAUUSD)
快速MA: Hull MA 12 (超灵敏捕捉黄金快速波动)
慢速MA: EMA 34 (斐波那契数列)
RSI周期: 9 (加快反应)
强趋势阈值: 0.25%
周期: 5, 15, 60, 240, 1440
比特币 (BTCUSD)
快速MA: EMA 21
慢速MA: EMA 55
RSI周期: 14
强趋势阈值: 0.8% (波动大,阈值需提高)
周期: 15, 60, 240, D, W
外汇 EUR/USD
快速MA: TEMA 10 (快速响应)
慢速MA: T3 30, 因子0.7 (平滑噪音)
RSI周期: 14
强趋势阈值: 0.08% (外汇波动小)
周期: 5, 15, 60, 240, 1440
📖 Indicator Function Details (Concise Version):
🎯 Core Functions:
1. MultiTimeframe Trend Analysis Monitors 8 timeframes simultaneously (1m/5m/15m/1H/4H/D/W/M)
2. 4Dimensional Voting System Comprehensive judgment based on MA trend + RSI momentum + MACD + Bollinger Bands
3. Global Trading Sessions Visualizes Asia/London/New York trading hours
4. Trend Strength Score Quantifies market strength from 0100%
5. Smart Alerts Automatically pushes strong bullish/bearish signals
📚 Key Term Explanations:
🔵 Trend Status (MA Analysis):
| Term | Meaning | Signal Strength |
| | | |
| Strong Bull | Fast MA significantly > Slow MA (Diff ≥0.35%) | ⭐⭐⭐⭐⭐ Long |
| Bullish Bias | Fast MA slightly > Slow MA (Diff <0.35%) | ⭐⭐⭐ Caution Long |
| Ranging | MAs intertwined, no clear direction | ⚠️ Wait & See |
| Bearish Bias | Fast MA slightly < Slow MA | ⭐⭐⭐ Caution Short |
| Strong Bear | Fast MA significantly < Slow MA | ⭐⭐⭐⭐⭐ Short |
Simple Understanding: Fast MA = sprinter (fast reaction), Slow MA = longdistance runner (stable). Sprinter far ahead = Strong Bull, opposite = Strong Bear.
🟠 Momentum Status (RSI Analysis):
| Term | Meaning | Trading Suggestion |
| | | |
| Momentum Up ↗ | RSI >60 & rising rapidly | Strong Buy Signal |
| Momentum High | RSI >60 but rising slower | Watch for pullback, consider reducing position |
| Momentum Neutral | RSI between 4060, stable | Wait for clearer direction |
| Momentum Low | RSI <40 but falling slower | Watch for rebound, consider taking profit |
| Momentum Down ↘ | RSI <40 & falling rapidly | Strong Sell Signal |
Simple Understanding: RSI = car speedometer. "Momentum Up" = full throttle acceleration, "Momentum High" = already fast but not accelerating further.
🟣 Auxiliary Signals:
MACD:
MACD Bullish = Histogram >0 = Strong buyer power
MACD Bearish = Histogram <0 = Strong seller power
Bollinger Bands (BB):
BB Overbought = Price near upper band = Possible pullback
BB Oversold = Price near lower band = Possible rebound
BB Middle = Price near middle band = Balanced state
💡 Quick Start 3 Steps to Understand the Panel:
Step 1: Check "Composite Conclusion Label" (Above the chart)
Green "Bulls Favored" → Consider Long
Red "Bears Favored" → Consider Short
Orange "Ranging/Balanced" → Wait & See
Step 2: Check "Votes Bull/Bear" (Bottom of the panel)
Bull votes significantly > Bear votes (Difference >2) → Strong Trend
Votes close (Difference <1) → Ranging Market
Step 3: Check "Trend Strength" (In the composite label)
Strength >70% → Strong Trend, consider heavier position
Strength 5070% → Moderate Trend, normal position size
Strength <50% → Weak Trend, light position or wait & see
🎨 Trading Session Background Color Meanings:
Purple = Asian Session (Tokyo hours) Lower volatility
Orange = London Session (European hours) Increased volatility
Blue = NY Early Morning US session preparation phase
Red = NY Critical 5 Minutes (09:3009:35) ⚠️ Most Important! Market most active, trends easily form
Green = NY Late Morning Continuation of early session trend
Trading Tip: Focus on the red critical period; these 5 minutes often determine the day's direction!
⚙️ Recommended Settings for Three Major Markets
🥇 Gold (XAUUSD):
Fast MA: Hull MA 12 (Highly sensitive for gold's fast moves)
Slow MA: EMA 34 (Fibonacci number)
RSI Period: 9 (Faster reaction)
Strong Trend Threshold: 0.25%
Timeframes: 5, 15, 60, 240, 1440
₿ Bitcoin (BTCUSD):
Fast MA: EMA 21
Slow MA: EMA 55
RSI Period: 14
Strong Trend Threshold: 0.8% (High volatility, requires higher threshold)
Timeframes: 15, 60, 240, D, W
💎 Ethereum (ETHUSD):
Fast MA: TEMA 21
Slow MA: EMA 55
RSI Period: 14
Strong Trend Threshold: 0.600.80%
Timeframes: 15, 60, 240, D, W
💱 Forex EUR/USD:
Fast MA: TEMA 10 (Fast response)
Slow MA: T3 30, Factor 0.7 (Smooths noise)
RSI Period: 14
Strong Trend Threshold: 0.08% (Forex has low volatility)
Timeframes: 5, 15, 60, 240, 1440

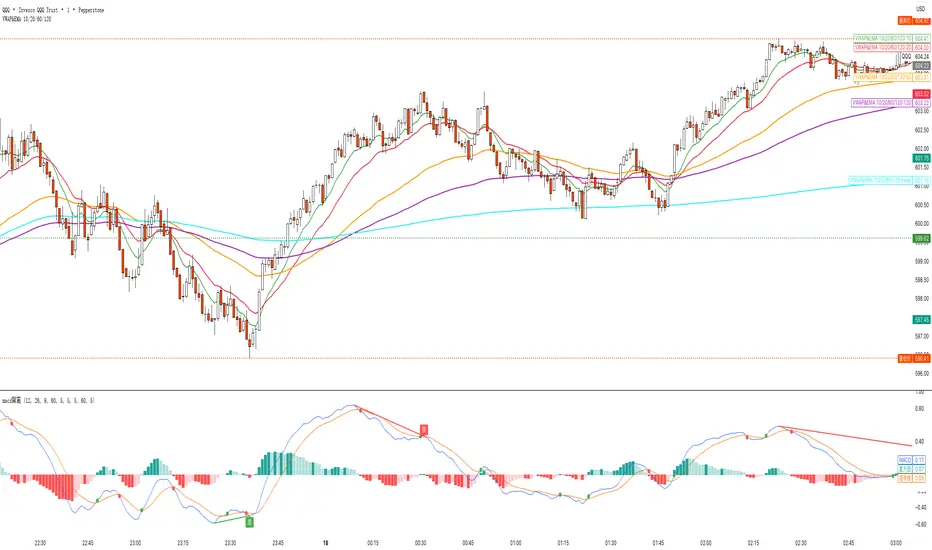
VWAP&EMA 10/20/60/120his script is a clean and straightforward technical analysis tool designed to provide traders with a clear view of market trends and key price levels by overlaying five essential moving averages onto your chart:
Volume Weighted Average Price (VWAP)
Four (4) Exponential Moving Averages (EMAs) at lengths 10, 20, 60, and 120.
By combining these indicators, traders can quickly assess short-term momentum, medium-term trends, and long-term direction, all while referencing the volume-weighted average price as a key benchmark for institutional activity.
Features & Components
This indicator plots five distinct lines on your chart, each color-coded for easy identification:
VWAP (Volume Weighted Average Price)
Plot: Plotted as a bright blue line.
Purpose: The VWAP represents the true average price of an asset for the day (or session), weighted by volume. It is a critical level for many day traders and institutions.
Prices above VWAP are often considered bullish.
Prices below VWAP are often considered bearish.
It frequently acts as a dynamic level of support or resistance.
EMA 10 (Short-Term Momentum)
Plot: Plotted as a green line.
Purpose: This is the fastest-moving average, reflecting the most recent price action and short-term momentum.
EMA 20 (Short-Term Trend)
Plot: Plotted as a red line.
Purpose: Often used in conjunction with the EMA 10, this average helps confirm the immediate trend. Crossovers between the 10 and 20 EMAs can signal potential entry or exit points.
EMA 60 (Medium-Term Trend)
Plot: Plotted as an orange line.
Purpose: This average provides a clearer picture of the medium-term trend, filtering out much of the short-term noise. It often serves as a significant dynamic support or resistance level.
EMA 120 (Long-Term Trend)
Plot: Plotted as a purple line.
Purpose: This is the slowest-moving average in the script, defining the major underlying trend. As long as the price remains above the EMA 120, the long-term bias is generally considered bullish, and vice-versa.
How to Use This Indicator
This indicator is versatile and can be adapted to various trading strategies:
Trend Confirmation: Use the alignment of the EMAs to determine the trend.
Strong Bullish Trend: Price > EMA 10 > EMA 20 > EMA 60 > EMA 120.
Strong Bearish Trend: Price < EMA 10 < EMA 20 < EMA 60 < EMA 120.
Dynamic Support & Resistance: Watch how the price reacts to each of the five lines. In an uptrend, the EMAs and VWAP will often act as "bounces" or support levels for pullbacks. In a downtrend, they will act as resistance.
Entry & Exit Signals (Crossovers):
A bullish crossover (e.g., EMA 10 crossing above EMA 20) can signal buying interest.
A bearish crossover (e.g., EMA 10 crossing below EMA 20) can signal selling pressure.
VWAP Confluence: Pay special attention to areas where an EMA (like the 20 or 60) crosses or travels close to the VWAP. This "confluence" can create a very strong and significant price level. For example, if the price pulls back to the VWAP and also finds support at the EMA 60, it can be a high-probability trade setup.
G_GMMA• Comprehensive GMMA Visualization: It plots six fast EMAs and six slow EMAs, clearly distinguishing short term and long term trends. The indicator fills the space between the fastest and slowest EMAs in each group, turning the moving averages into easily identifiable ribbons rather than a mass of overlapping lines.
• Customizable Appearance: Users can adjust the colors of the fast and slow EMA lines, the fill colors of each ribbon, and the overall line thickness. This makes it easy to tailor the chart to personal preferences or trading templates.
• Dynamic Background Shading: The script can shade the chart’s background depending on whether the fast ribbon is above or below the slow ribbon, giving a quick visual cue for trend direction (uptrend vs. downtrend).
• Touch Alert System: Up to three different EMA lengths can be monitored for “touch” events. When price touches a selected EMA (e.g., 20 , 50 or 200 period EMA), the indicator triggers an alert condition and plots a small circle on the chart at the contact point. This helps traders catch precise entry or exit signals without staring at the screen.
• Flexible Input: Both fast and slow EMA lengths, colors, and alert parameters are user adjustable from the indicator’s settings. This allows the same script to be used on different instruments (e.g., Gold, forex pairs) and time frames by simply changing the period values.
• Trend Sensitive Support/Resistance: By treating the slow EMA ribbon as a dynamic support/resistance zone, the indicator helps traders identify where price is likely to stall or reverse. Combining this with the touch alerts makes it well suited for scalping or intraday trades.


Turtle Soup Multi Timeframe (D + 30m)
This indicator indicates when there is a turtle soup with a 30-minute timeframe aligned with a one-day timeframe.

HTF Control Shift + Prev Candle Break Sequence 🧭 HTF Control Shift + Previous Candle Break Sequence
Overview
The HTF Control Shift + Previous Candle Break Sequence indicator identifies high-probability shift candles that suggest a potential change in market control — from sellers to buyers or vice versa — and then tracks whether price confirms that shift by breaking the previous candle’s high or low.
This tool is designed to help traders detect institutional control shifts and confirm them with price structure breaks, providing a framework for spotting early trend reversals or strong continuation moves.
How It Works
Control Shift Candle Detection
A Bullish Control Shift occurs when a candle shows:
A long lower wick (≥ Wick % Threshold of total range).
A close near the high (within Body % Threshold of the top).
A Bearish Control Shift occurs when a candle shows:
A long upper wick (≥ Wick % Threshold of total range).
A close near the low (within Body % Threshold of the bottom).
These candles are highlighted in green (bullish) or red (bearish), and optionally labeled on the chart.
Previous Candle High/Low Tracking
The script automatically plots horizontal lines at the previous candle’s high (green) and low (red).
These act as key reference levels for breakout confirmation.
Breakout Confirmation Sequence
A Bullish Sequence triggers when a Bullish Control Shift candle is followed by a break above the previous candle’s high.
A Bearish Sequence triggers when a Bearish Control Shift candle is followed by a break below the previous candle’s low.
When either sequence completes, the indicator can send a TradingView alert confirming the directional breakout.
How to Use
Timeframe:
Optimized for higher timeframes (1H, 4H, Daily) to filter out intraday noise and identify structural market shifts.
Trend Reversal Identification:
Watch for Control Shift candles at major highs/lows, order blocks, or liquidity zones — a confirmed breakout often signals a trend reversal or new directional push.
Continuation Confirmation:
In trending markets, a Control Shift candle that breaks in the direction of trend can validate a strong continuation setup.
Alert Usage:
Set alerts for:
Bullish Control Shift Confirmed Breakout
Bearish Control Shift Confirmed Breakdown
Optional: raw Control Shift or Break alerts.
Customization
Wick % Threshold: Adjusts the required wick size to define a control shift.
Body % Threshold: Controls how close the close must be to the high/low for confirmation.
Label Toggle: Optionally display labels only on control shift candles.
Best Practices
Combine with higher-timeframe trend filters.
Avoid using it alone in tight consolidation zones.
Strongest signals occur when:
Control Shift appears at key structure levels.
The breakout bar closes firmly beyond the previous high/low.
Volume supports the breakout.
Summary
✅ Detects when market control flips (buyers ↔ sellers).
✅ Confirms shift with breakout above/below previous candle.
✅ Ideal for 1H–4H swing or position trading.
✅ Provides visual, structural, and alert-based confirmation.

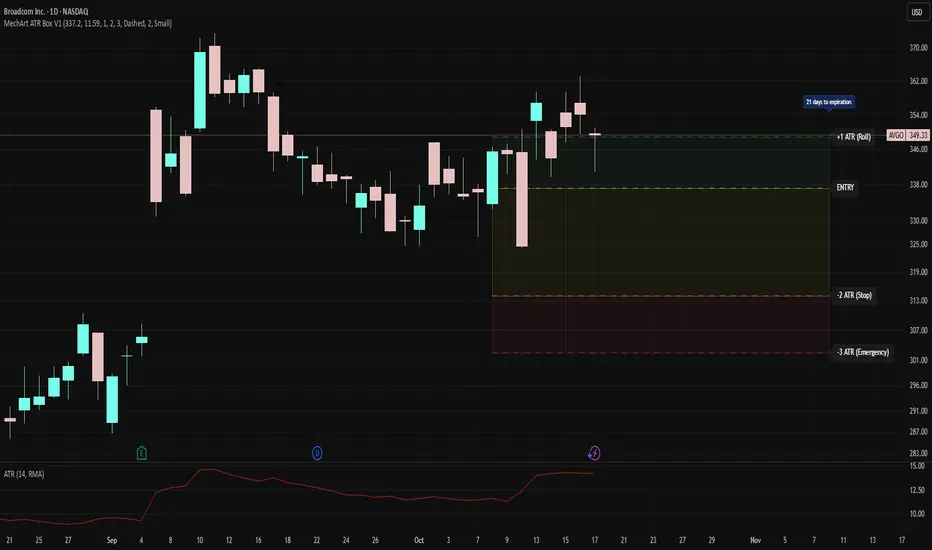
MechArt ATR Box V1MechArt ATR Box V1
Description:
The MechArt ATR Box V1 is a precision trade-planning and risk-management tool that visualizes your entire position framework using customizable ATR-based zones.
It automatically plots your key decision levels from a defined entry price and ATR value — helping you clearly see when to roll, hold, or exit a trade.
Features:
Configurable ATR multipliers for roll, stop, and emergency zones.
Automatically updates labels and price levels based on your custom ATR settings.
Distinct color-coded boxes for:
✅ +1 ATR (Roll Zone) – visualize profit or roll targets.
⚠️ –2 ATR (Stop Zone) – manage risk boundaries.
🚨 –3 ATR (Emergency Stop) – mark hard exit thresholds.
Adjustable ATRs, line style, width, color, and opacity for visual clarity.
Optional Days Until Expiration label for time-sensitive trades.
Ideal for:
Traders using mechanical, ATR driven systems (like OVTLYR Plan M), or anyone who wants a clear, rule-based visualization of risk vs. reward directly on the chart.

Experimental Supertrend [CHE]Experimental Supertrend — Combines EMA crossovers for trend regime detection with an adaptive ATR-based hull that selects the narrowest band to contain recent highs and lows, minimizing false breaks in varying volatility.
Summary
This indicator overlays a dynamic supertrend boundary around a midline derived from dual EMAs, using EMA crossovers to switch between bullish and bearish regimes. The hull adapts by evaluating multiple ATR periods and selecting the tightest one that fully encloses price action over a specified window, which helps in creating more stable trend lines that hug price without excessive gaps or breaches. Fills between the midline and hull provide visual cues for trend strength, darkening temporarily after regime changes to highlight transitions. Alerts trigger on crossovers, and markers label entry points, making it suitable for trend-following setups where standard supertrends might whipsaw. Overall, it offers robustness through auto-adjustment, reducing sensitivity to noise while maintaining responsiveness to genuine shifts.
Motivation: Why this design?
Standard supertrend indicators often flip prematurely in choppy markets due to fixed multipliers that do not account for localized volatility patterns, leading to frequent false signals and eroded confidence in trends. This design addresses that by incorporating an EMA-based regime filter for directional bias and an auto-adaptive hull that dynamically tunes the band width based on recent price containment needs. By prioritizing the narrowest effective enclosure, it avoids over-wide bands in calm periods that cause lag or under-wide ones in volatility spikes that invite breaks, providing a more consistent trailing reference without manual tweaking.
What’s different vs. standard approaches?
- Reference baseline: Diverges from the classic ATR-multiplier supertrend, which uses a single fixed period and constant factor applied to close or high/low deviations.
- Architecture differences:
- Auto-selection from candidate ATR lengths to find the optimal period for current conditions.
- Dynamic multiplier clamped between floor and cap values, adjusted by padding to ensure reliable containment.
- Regime-gated rendering, where hull position flips based on EMA relative positioning.
- Post-transition visual fading to emphasize change points without altering core logic.
- Practical effect: Charts show tighter, more reactive bands that rarely breach during trends, reducing visual clutter from flips; the adaptive nature means less intervention across assets, as the hull self-adjusts to volatility clusters rather than applying a one-size-fits-all scale.
How it works (technical)
The indicator first computes two EMAs from close prices using lengths derived from a preset pair or manual inputs, establishing a midline as their average. This midline serves as the central reference for the hull. True range values are then smoothed into multiple ATR candidates using exponential weighting over the specified lengths. For each candidate, deviations of recent highs and lows from the midline are ratioed against the ATR to determine a required multiplier that would enclose all extremes in the containment window—the highest ratio plus padding sets the base, clamped to user-defined bounds. Among valid candidates (those with sufficient history), the one yielding the narrowest overall band width is selected. The hull boundaries are then offset from the midline by this multiplier times the chosen ATR, and further smoothed with a fixed EMA to reduce jitter. Regime direction from EMA comparison gates which boundary acts as support or resistance, with initialization seeding arrays on the first bar to handle state persistence. No higher timeframe data is used, so all logic runs on the chart's native bars without lookahead.
Parameter Guide
EMA Pair — Selects preset lengths for fast and slow EMAs, influencing regime sensitivity and midline stability. Default: "21/55". Trade-offs/Tips: Faster pairs like "9/21" increase cross frequency for scalping but raise false signals; slower like "50/200" smooths for swings, potentially missing early turns. Use Manual for fine control.
Manual Fast — Sets fast EMA length when Manual mode is active; shorter values make regime switches quicker. Default: 21. Trade-offs/Tips: Lower than 10 risks over-reactivity; pair with slow at least double for clear separation.
Manual Slow — Sets slow EMA length when Manual mode is active; longer values anchor the midline more firmly. Default: 55. Trade-offs/Tips: Above 100 adds lag in trends; balance with fast to avoid perpetual neutrality.
ATR Lengths (comma-separated) — Defines candidate periods for ATR smoothing; more options allow finer auto-selection. Default: "7,10,14,21,28,35". Trade-offs/Tips: Fewer candidates speed computation but may miss optimal fits; keep under 10 for efficiency.
Containment Window — Number of recent bars the hull must fully enclose highs/lows of; larger windows favor stability. Default: 50. Trade-offs/Tips: Shorter (under 20) adapts faster to breaks but increases breach risk; longer smooths but delays response.
Min Multiplier Floor — Lowest allowed multiplier for hull width; prevents overly tight bands in low volatility. Default: 0.5. Trade-offs/Tips: Raise to 0.75 for conservative enclosures; too low allows pinches that flip easily.
Max Multiplier Cap — Highest allowed multiplier; caps expansion in spikes to avoid wide, lagging bands. Default: 1.0. Trade-offs/Tips: Lower to 0.75 tightens overall; higher permits more room but risks detachment from price.
Padding (+) — Adds buffer to the auto-multiplier for safer containment without exact touches. Default: 0.05. Trade-offs/Tips: Increase to 0.10 in gappy markets; minimal values hug closer but may still breach on outliers.
Fill Between (Mid ↔ Supertrend) — Toggles shaded area between midline and active hull for trend visualization. Default: true. Trade-offs/Tips: Disable for cleaner charts; pairs well with transparency tweaks.
Base Fill Transparency (0..100) — Sets default opacity of fills; higher values make them subtler. Default: 80. Trade-offs/Tips: Under 50 overwhelms price action; adjust with darken boost for emphasis.
Darken on Trend Change — Enables temporary opacity increase after regime shifts to spotlight transitions. Default: true. Trade-offs/Tips: Off for steady visuals; on aids spotting reversals in real-time.
Darken Fade Bars — Duration in bars for the darken effect to ramp back to base; longer prolongs highlight. Default: 8. Trade-offs/Tips: Shorter (4-6) for fast-paced charts; longer holds attention on changes.
Darken Boost at Change (Δ transp) — Intensity of opacity reduction at crossover; higher values make shifts more prominent. Default: 50. Trade-offs/Tips: Cap at 70 to avoid blackout; tune down if fades obscure details.
Show Supertrend Line — Displays the active hull boundary as a line. Default: true. Trade-offs/Tips: Hide for fill-only views; linewidth fixed at 3 for visibility.
Show EMA Cross Markers — Places circles and labels at crossover points for entry cues. Default: true. Trade-offs/Tips: Disable in clutter; labels show "Buy"/"Sell" at absolute positions.
Alert: EMA Cross Up (Long) — Triggers notification on bullish crossover. Default: true. Trade-offs/Tips: Pair with filters; once-per-bar frequency.
Alert: EMA Cross Down (Short) — Triggers notification on bearish crossover. Default: true. Trade-offs/Tips: Use for exits; ensure broker integration.
Show Debug — Reveals internal diagnostics like selected ATR details (if implemented). Default: false. Trade-offs/Tips: Enable for troubleshooting selections; minimal overhead.
Reading & Interpretation
Bullish regime shows a green line below price as support, with upward fill from midline; bearish uses red line above as resistance, downward fill. Crossovers flip the active boundary, marked by tiny green/red circles and "Buy"/"Sell" labels at the hull level. Fills start at base transparency but darken sharply at changes, fading over the specified bars to signal fresh momentum. If the hull rarely breaches during trends, containment is effective; frequent touches without flips indicate tight adaptation. Debug mode (when enabled) overlays text or plots for selected length and multiplier, helping verify auto-choices.
Practical Workflows & Combinations
- Trend following: Enter long on green "Buy" label above prior low structure; confirm with higher high. Trail stops along the green hull line, tightening as fills stabilize post-fade.
- Exits/Stops: Conservative exit on opposite crossover or hull breach; aggressive hold until fade completes if volume supports. Use darken boost as a volatility cue—high delta suggests waiting for confirmation.
- Multi-asset/Multi-TF: Defaults suit forex/stocks on 15m-4h; for crypto, widen containment to 75 for gaps. Layer on volume oscillator for cross filters; avoid on low-liquidity assets where ATR candidates skew.
Behavior, Constraints & Performance
Closed-bar logic ensures signals confirm at bar end, with live bars updating hull adaptively but no repaints since no future data or security calls are used. Arrays persist ATR states across bars, initialized once with candidates parsed from string. Small fixed loops (over 6 lengths max, inner up to 50) run per bar, capped by max_bars_back=500 for history needs. Resources stay low with 500 labels/lines limits, but dense charts may hit on markers. Known limits include initial lag until containment history builds (50+ bars), potential wide bands on gaps, and suboptimal selections if candidates omit ideal lengths.
Sensible Defaults & Quick Tuning
Start with "21/55" pair, 50-window, 0.5-1.0 multipliers, and 80% transparency for balanced responsiveness on daily charts. For too many flips, raise min floor to 0.75 or add lengths like "42"; for sluggishness, shorten window to 30 or pick faster pair. In high-vol environments, boost padding to 0.10; for smoother visuals, extend fade bars to 12.
What this indicator is—and isn’t
This is a visualization and signal layer for trend regime and adaptive boundaries, aiding entry/exit timing in directional markets. It is not a standalone system—pair with price structure, risk sizing, and broader context. Not predictive of turns, just reactive to containment and crosses.
Disclaimer
The content provided, including all code and materials, is strictly for educational and informational purposes only. It is not intended as, and should not be interpreted as, financial advice, a recommendation to buy or sell any financial instrument, or an offer of any financial product or service. All strategies, tools, and examples discussed are provided for illustrative purposes to demonstrate coding techniques and the functionality of Pine Script within a trading context.
Any results from strategies or tools provided are hypothetical, and past performance is not indicative of future results. Trading and investing involve high risk, including the potential loss of principal, and may not be suitable for all individuals. Before making any trading decisions, please consult with a qualified financial professional to understand the risks involved.
By using this script, you acknowledge and agree that any trading decisions are made solely at your discretion and risk.
Do not use this indicator on Heikin-Ashi, Renko, Kagi, Point-and-Figure, or Range charts, as these chart types can produce unrealistic results for signal markers and alerts.
Happy trading
Chervolino

Dollar Volume Ownership Gauge Dollar Volume Ownership Gauge (DVOG)
By: Mando4_27
Version: 1.0 — Pine Script® v6
Overview
The Dollar Volume Ownership Gauge (DVOG) is designed to measure the intensity of real money participation behind each price bar.
Instead of tracking raw share volume, this tool converts every bar’s trading activity into dollar volume (price × volume) and highlights the transition points where institutional capital begins to take control of a move.
DVOG’s mission is simple:
Show when the crowd is trading vs. when the institutions are buying control.
Core Concept
Most retail traders focus on share count (volume) — but institutions think in dollar exposure.
A small-cap printing a 1-million-share candle at $1 is very different from a 1-million-share candle at $10.
DVOG normalizes this by displaying total traded dollar value per bar, then color-codes and alerts when the volume of money crosses key thresholds.
This exposes the exact moments when ownership is shifting — often before major breakouts, reclaims, or exhaustion reversals.
How It Works
Dollar Volume Calculation
Each candle’s dollar volume is computed as close × volume.
Data is aggregated from the 5-minute timeframe regardless of your current chart, allowing consistent institutional-flow detection on any resolution.
Threshold Logic
Two customizable levels define interest zones:
$500K Threshold → Early or moderate institutional attention.
$1M Threshold → High-conviction or aggressive accumulation.
Both levels can be edited to fit different market caps or trading styles.
Bar Coloring Scheme
Red = Dollar Volume ≥ $1,000,000 → Significant institutional activity / control bar.
Green = Dollar Volume ≥ $500,000 and < $1,000,000 → Emerging accumulation / transition bar.
Black = Below $500,000 → Retail or low-interest zone.
(Colors are intentionally inverted from standard expectation: when volume intensity spikes, the bar turns hotter in tone.)
Plot Display
Histogram style plot displays 5-minute aggregated dollar volume per bar.
Dotted reference lines mark $500K and $1M levels, with live right-hand labels for quick reading.
Optional debug label shows current bar’s dollar value, closing price, and raw volume for transparency.
Alerts & Conditions
DVOG includes three alert triggers for hands-off monitoring:
Alert Name Trigger Message Purpose
Green Bar Alert – Dollar Volume ≥ $500K When dollar volume first crosses $500K “Institutional interest starting on ” Signals early money entering.
Dollar Volume ≥ $500K Same as above, configurable “Early institutional interest detected…” Broad alert option.
Dollar Volume ≥ $1M When dollar volume first crosses $1M “Significant money flow detected…” Indicates heavy institutional presence or ignition bar.
You can enable or disable alerts via checkbox inputs, allowing you to monitor just the levels that fit your style.
Interpretation & Use Cases
Identify Institutional “Ignition” Points:
Watch for sudden green or red DVOG bars after long low-volume consolidation — these often precede explosive continuation moves.
Confirm Breakouts & Reclaims:
If price reclaims a key level (HOD, neckline, or coil top) and DVOG flashes green/red, odds strongly favor follow-through.
Spot Trap Exhaustion:
After a flush or low-volume fade, the first strong green/red DVOG bar can mark the institutional reclaim — the moment retail control ends.
Filter Noise:
Ignore standard volume spikes. DVOG only reacts when dollar ownership materially changes hands, not when small traders churn shares.
Customization
Setting Default Description
$500K Threshold 500,000 Lower limit for “Green” institutional attention.
$1M Threshold 1,000,000 Upper limit for “Red” heavy institutional control.
Show Alerts ✅ Enable or disable global alerts.
Alert on Green Bars ✅ Toggle only the $500K crossover alerts.
Adjust thresholds to match the liquidity of your preferred tickers — for example, micro-caps may use $100K/$300K, while large-caps might use $5M/$20M.
Reading the Output
Black baseline = Noise / retail chop.
First Green bar = Smart money starts building position.
Red bar(s) = Ownership shift confirmed — institutions active.
Flat-to-rising pattern in DVOG = Sustained accumulation; often aligns with strong trend continuation.
Summary
DVOG transforms raw volume into actionable context — showing you when capital, not hype, is moving.
It’s particularly effective for:
Momentum and breakout traders
Liquidity trap reclaims (Kuiper-style setups)
Identifying early ignition bars before halts
Confirming frontside strength in micro-caps
Use DVOG as your ownership radar — the visual cue for when the market stops being retail and starts being real.
Outside Candle Session Breakout [CHE]Outside Candle Session Breakout
Session - anchored HTF levels for clear market-structure and precise breakout context
Summary
This indicator is a relevant market-structure tool. It anchors the session to the first higher-timeframe bar, then activates only when the second bar forms an outside condition. Price frequently reacts around these anchors, which provides precise breakout context and a clear overview on both lower and higher timeframes. Robustness comes from close-based validation, an adaptive volatility and tick buffer, first-touch enforcement, optional retest, one-signal-per-session, cooldown, and an optional trend filter.
Pine version: v6. Overlay: true.
Motivation: Why this design?
Short-term breakout tools often trigger during noise, duplicate within the same session, or drift when volatility shifts. The core idea is to gate signals behind a meaningful structure event: a first-bar anchor and a subsequent outside bar on the session timeframe. This narrows attention to structurally important breaks while adaptive buffering and debouncing reduce false or mid-run triggers.
What’s different vs. standard approaches?
Baseline: Simple high-low breaks or fixed buffers without session context.
Architecture: Session-anchored first-bar high/low; outside-bar gate; close-based confirmation with an adaptive ATR and tick buffer; first-touch enforcement; optional retest window; one-signal-per-session and cooldown; optional EMA trend and slope filter; higher-timeframe aggregation with lookahead disabled; themeable visuals and a range fill between levels.
Practical effect: Cleaner timing at structurally relevant levels, fewer redundant or late triggers, and better multi-timeframe situational awareness.
How it works (technical)
The chart timeframe is mapped to an analysis timeframe and a session timeframe.
The first session bar defines the anchor high and low. The setup becomes active only after the next bar forms an outside range relative to that first bar.
While active, the script tracks these anchors and checks for a breakout beyond a buffered threshold, using closing prices or wicks by preference.
The buffer scales with volatility and is limited by a minimum tick floor. First-touch enforcement avoids mid-run confirmations.
Optional retest requires a pullback to the raw anchor followed by a new close beyond the buffered level within a user window.
Optional trend gating uses an EMA on the analysis timeframe, including an optional slope requirement and price-location check.
Higher-timeframe data is requested with lookahead disabled. Values can update during a forming higher-timeframe bar; waiting and confirmation mitigate timing shifts.
Parameter Guide
Enable Long / Enable Short — Direction toggles. Default: true / true. Reduces unwanted side.
Wait Candles — Minimum bars after outside confirmation before entries. Default: five. More waiting increases stability.
Close-based Breakout — Confirm on candle close beyond buffer. Default: true. For wick sensitivity, disable.
ATR Buffer — Enables adaptive volatility buffer. Default: true.
ATR Multiplier — Buffer scaling. Default: zero point two. Increase to reduce noise.
Ticks Buffer — Minimum buffer in ticks. Default: two. Protects in quiet markets.
Cooldown Bars — Blocks new signals after a trigger. Default: three.
One Signal per Session — Prevents duplicates within a session. Default: true.
Require Retest — Pullback to raw anchor before confirming. Default: false.
Retest Window — Bars allowed for retest completion. Default: five.
HTF Trend Filter — EMA-based gating. Default: false.
EMA Length — EMA period. Default: two hundred.
Slope — Require EMA slope direction. Default: true.
Price Above/Below EMA — Require price location relative to EMA. Default: true.
Show Levels / Highlight Session / Show Signals — Visual controls. Default: true.
Color Theme — “Blue-Green” (default), “Monochrome”, “Earth Tones”, “Classic”, “Dark”.
Time Period Box — Visibility, size, position, and colors for the info box. (Optional)
Reading & Interpretation
The two level lines represent the session’s first-bar high and low. The filled band illustrates the active session range.
“OUT” marks that the outside condition is confirmed and the setup is live.
“LONG” or “SHORT” appears only when the breakout clears buffer, debounce, and optional gates.
Background tint indicates sessions where the setup is valid.
Alerts fire on confirmed long or short breakout events.
Practical Workflows & Combinations
Trend-following: Keep close-based validation, ATR buffer near the default, one-signal-per-session enabled; add EMA trend and slope for directional bias.
Retest confirmation: Enable retest with a short window to prioritize cleaner continuation after a pullback.
Lower-timeframe scalping: Reduce waiting and cooldown slightly; keep a small tick buffer to filter micro-whips.
Swing and position context: Increase ATR multiplier and waiting; maintain once-per-session to limit duplicates.
Timeframe Tiers and Trader Profiles
The script adapts its internal mapping based on the chart timeframe:
Under fifteen minutes → Analysis: one minute; Session: sixty minutes. Useful for scalpers and high-frequency intraday reads.
Between fifteen and under sixty minutes → Analysis: fifteen minutes; Session: one day. Suits day traders who need intraday alignment to the daily session.
Between sixty minutes and under one day → Analysis: sixty minutes; Session: one week. Serves intraday-to-swing transitions and end-of-day planning.
Between one day and under one week → Analysis: two hundred forty minutes; Session: two weeks. Fits swing traders who monitor multi-day structure.
Between one week and under thirty days → Analysis: one day; Session: three months. Supports position traders seeking quarterly context.
Thirty days and above → Analysis: one day; Session: twelve months. Provides a broad annual anchor for macro context.
These tiers are designed to keep anchors meaningful across regimes while preserving responsiveness appropriate to the trader profile.
Behavior, Constraints & Performance
Signals can be validated on closed bars through close-based logic; enabling this reduces intrabar flicker.
Higher-timeframe values may evolve during a forming bar; waiting parameters and the outside-bar gate reduce, but do not remove, this effect.
Resource footprint is light; the script uses standard indicators and a single higher-timeframe request per stream.
Known limits: rare setups during very quiet periods, sensitivity to gaps, and reduced reliability on illiquid symbols.
Sensible Defaults & Quick Tuning
Start with close-based validation on, ATR buffer on with a multiplier near zero point two, tick buffer two, cooldown three, once-per-session on.
Too many flips: increase the ATR multiplier and cooldown; consider enabling the EMA filter and slope.
Too sluggish: reduce the ATR multiplier and waiting; disable retest.
Choppy conditions: keep close-based validation, increase tick buffer, shorten the retest window.
What this indicator is—and isn’t
This is a visualization and signal layer for session-anchored breakouts with stability gates. It is not a complete trading system, risk framework, or predictive engine. Combine it with structured analysis, position sizing, and disciplined risk controls.
Disclaimer
The content provided, including all code and materials, is strictly for educational and informational purposes only. It is not intended as, and should not be interpreted as, financial advice, a recommendation to buy or sell any financial instrument, or an offer of any financial product or service. All strategies, tools, and examples discussed are provided for illustrative purposes to demonstrate coding techniques and the functionality of Pine Script within a trading context.
Any results from strategies or tools provided are hypothetical, and past performance is not indicative of future results. Trading and investing involve high risk, including the potential loss of principal, and may not be suitable for all individuals. Before making any trading decisions, please consult with a qualified financial professional to understand the risks involved.
By using this script, you acknowledge and agree that any trading decisions are made solely at your discretion and risk.
Do not use this indicator on Heikin-Ashi, Renko, Kagi, Point-and-Figure, or Range charts, as these chart types can produce unrealistic results for signal markers and alerts.
Best regards and happy trading
Chervolino

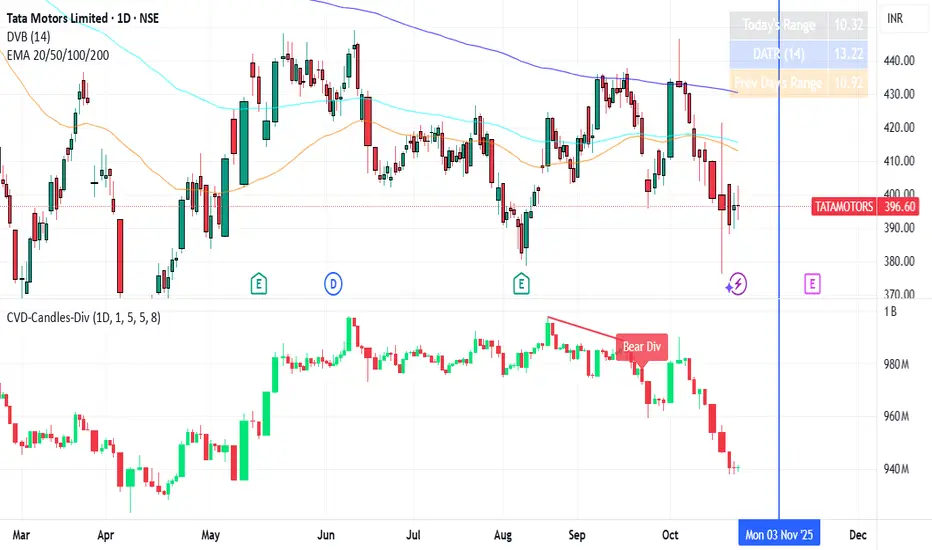
CVD Candles + Divergence (Pane) [NIRALA]This indicator provides a powerful way to analyze market dynamics by visualizing Cumulative Volume Delta (CVD) as candlesticks and automatically detecting divergences between price and order flow. It is designed to help traders spot potential trend exhaustion and reversals that may not be apparent from price action alone.
Key Concepts
Cumulative Volume Delta (CVD): CVD is a running total of the difference between buying and selling volume from market orders. A rising CVD indicates aggressive buying, while a falling CVD indicates aggressive selling. Unlike price, which can be influenced by passive limit orders, CVD shows the raw intent of aggressive market participants.
Divergence: A divergence occurs when price and CVD move in opposite directions. This signals a potential conflict between price action and the underlying order flow, often preceding a reversal.
Bearish Divergence: Price makes a new high, but CVD fails to make a new high (or makes a lower high). This suggests buying aggression is weakening despite the higher price, and a reversal to the downside may be imminent.
Bullish Divergence: Price makes a new low, but CVD fails to make a new low (or makes a higher low). This suggests selling pressure is drying up, and a reversal to the upside may be coming.
Features
CVD as Candlesticks: Plots CVD in a familiar OHLC candlestick format in a separate pane, providing a more intuitive view of order flow momentum and volatility compared to a simple line.
Automatic Divergence Detection: The script automatically identifies classic bullish and bearish divergences between price pivots and CVD pivots, drawing lines on both the main price chart and the indicator pane to clearly highlight them.
Multi-Timeframe Analysis: Calculates CVD from a user-defined lower timeframe, offering a more granular and precise view of the order flow that builds up a single candle on your chart.
Customizable Pivot Lookbacks: Allows you to adjust the sensitivity of the pivot detection for finding both short-term and long-term divergences.
Alerts: Includes built-in alerts that can notify you when a new bullish or bearish divergence is confirmed.
How to Use
Look for High-Probability Setups: This indicator is most powerful when its signals appear at key areas of support or resistance. A divergence at a major price level is a much stronger signal than one in the middle of a range.
Confirm with Price Action: Do not trade on a divergence signal alone. Wait for a confirmation candle (e.g., a bearish engulfing candle after a bearish divergence, or a bullish hammer after a bullish divergence) before considering an entry.
Combine with Your Strategy: Use this indicator as a confirmation tool to enhance your existing trading strategy. For example, if your primary strategy gives a sell signal and this indicator simultaneously prints a bearish divergence, it significantly increases the probability of the trade.
This tool is designed for discretionary traders looking to add a layer of order flow analysis to their decision-making process.
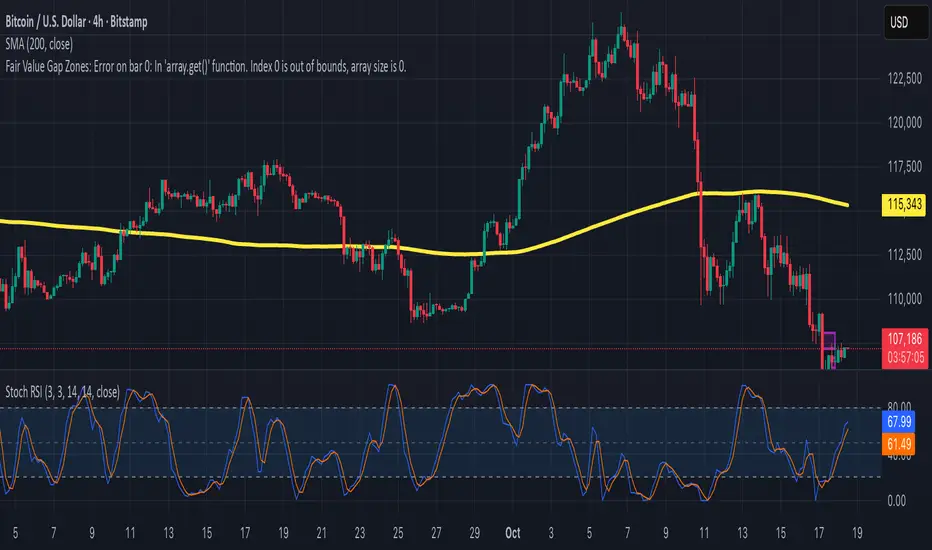
Fair Value Gap ZonesDescription
This script automatically detects and highlights Fair Value Gaps (FVGs) on any chart and timeframe.
It identifies bullish and bearish imbalance zones using candle-to-candle price displacement and shades them visually on the chart for easy reference.
Bullish FVGs are marked with dark green zones, showing areas where price may later return before continuing upward.
Bearish FVGs are shaded in light red, indicating potential retracement zones in downtrends.
All zones extend forward automatically, updating dynamically as new candles form.
Designed for traders who use Smart Money Concepts (SMC) or ICT-style analysis, this tool helps visualize market inefficiencies and potential reaction points with clear, minimal visuals.