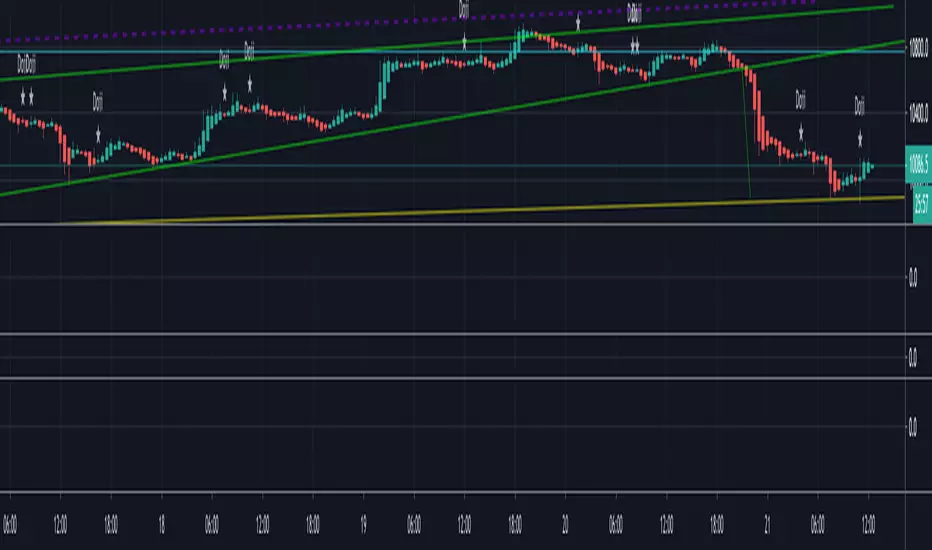
TD - HA Trend ReversalVery script to identify Doji's for trend reversal and alerting. I intentionally left out identification of other candle types to make it simple for people who are using HA candles in particular.
Candlestick-Analysen
[RESEARCH] Renko Chart IdentifierDespite I am not a big fan of Renko I spent some time to solve a common problem of chart type identification using absolutely obvious technique: Renko bricks have the same size. That's all. Not a cutting-edge maths.
This tool allows to identify:
ATR Renko charts (see ^)
Traditional Renko charts
Here is example for Traditional Renko:
It also works correctly with other chart types:
Classic Candles
Heikin-Ashi
Kagi
PnF
Range Bars
Remember @everget !
And pay attention to the license before use)

Dark Cloud Cover Pattern Trading Setupthis study is another script based on the candlestick pattern . there are a few filters implemented to be applied to the output result to clear out noises. it sounds like finding real Dark Cloud Cover instances are too rare (interesting though!).
Dark Cloud Cover
it is a bearish reversal candlestick pattern where a down candle (typically bearish) opens above the close of the prior up candle (typically bullish) and then closes below the midpoint of the up candle. The five criteria for the Dark Cloud Cover pattern are:
An existing bullish uptrend.
An up (bullish) candle within that uptrend.
A gap up on the following day.
The gap up turns into a down (bearish) candle.
The bearish candle closes below the midpoint of the previous bullish candle.
all these criteria are implemented in code to produce a more accurate result.
please provide me with your valuable comments,
thanks for your attention,

Piercing Line Pattern Trading Setupthis study is the first one of a series of scripts based on the candlesticks pattern which will be published over time. There are several such scripts out there that can be found on TradingView but they seem to be inaccurate with a lot of noises and messy hard to understand code. In this script, I've tried to have a clean and easy to get
of the pattern itself and the method for detecting it with enough parameters to filter out the noises.
Piercing Pattern
A piercing pattern is a technical trading signal that is formed by a closing down day with a good-sized trading range, followed by a trading gap lower the following day with a bullish candlestick that covers at least half of the upward length of the previous day's bearish candlestick body, finishing with a close higher for the day. A piercing pattern often signals the end of a small to moderate downward trend. A piercing pattern can serve as a potential indicator for a bullish reversal. This pattern is formed by two consecutive candlestick marks. The first candlestick is bearish signifying a down day and the second is bullish signifying an up day. When a trader is watching for a bullish reversal any red candlestick followed by a green candlestick could be an alert. There are a few things that set a piercing pattern apart from a general red candlestick green candlestick pattern. In a piercing pattern, a green candlestick follows a red one with a significant gap in the red candlestick close and green candlestick open. On the second-day green candlestick, the candlestick’s body must also lengthen to cover at least half of the previous day’s red candlestick . Generally, the gap down and substantial increase to the closing price are good signs for a reversal. In a piercing pattern, the second-day green candlestick will close at or above the midpoint of the previous day’s red candlestick.
please provide me with your valuable comments,
thanks for your attention,

Candle Patterns StrategyThe script allows you to test popular candlestick patterns on various instruments and timeframes. In addition, you can configure risk management (if the value is zero, it means the function is disabled), and you can also specify the time of the trading session (for example, so that the positions are not transferred to the next day).
The author is grateful to JayRogers and Phi35, their code examples helped a lot in writing the strategy.


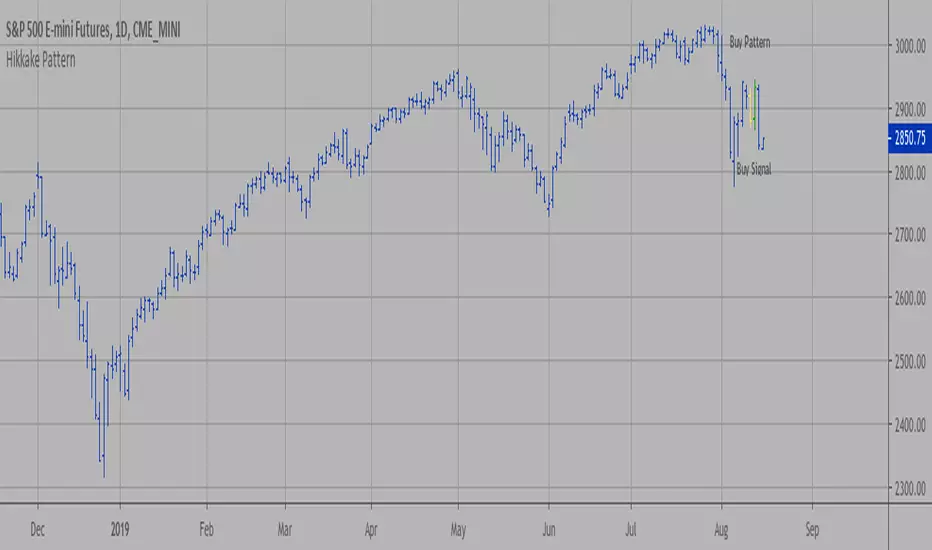
Hikkake Pattern The hikkake pattern is a price pattern used by technical analysts and traders
hoping to identify a short-term move in the market's direction. The pattern
has two different setups, one implying a short-term downward movement in price
action, and a second setup implying a short-term upward trend in price.
The Hikkake pattern (pronounced Hĭ KAH kay) is a complex bar or candle pattern
that begins to move in one direction but reverses quickly and is said to establish
a forecast for a move in the opposite direction. This pattern was developed by Daniel L.
Chesler, CMT, who published a description of the pattern first in 2003.
Filtered Waves [NXT2017] #Linda Raschke #basics on Arthur MerrilHI BIG PLAYERS,
this script I wrote for an enquiry of a tradingview-user. It should represent the Filtered Waves idea from Arthur Merril and used by Linda Raschke.
It's similar like a visualization of Elliott Waves.
On YouTube title "MTA UK Chapter Presentation with Linda Raschke" between 34-36 minutes Linda Raschke shows the rules for her Filterd Waves.
Any questions? Ask me!
King regards
NXT2017
========
TO MY PERSON
I'm the second winner of the official German Forex Trading Competition in 2018.
Look here to the ranks:
deutsche-trading-meisterschaften.de
I speak german, english and russian.
My strength in trading are Wolfe Wave pattern.

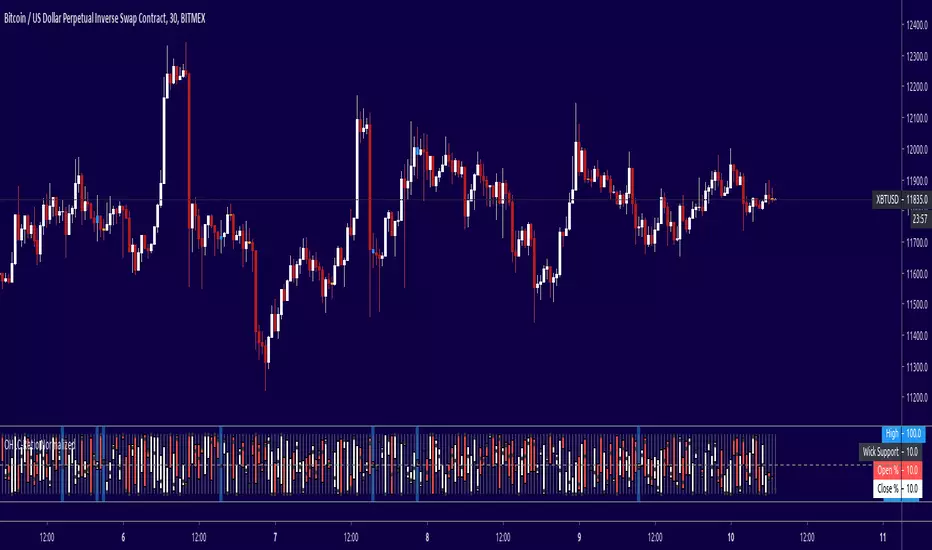
OHLC-RatioThis one is quite useful to quickly see candle length, full range compared to closing range and difference.

Golden Cross by -Westy-Quick Guide
- Yellow cross and green MA on top = Potential uptrend
- Yellow cross and red MA on top = Potential downtrend
A simple golden cross indicator of the green 50 and red 200 SMA with a yellow cross for ease of visibility and backtesting.
Generally, longer time frames more powerful signals but are less frequent. I typically use it on the 4 hour, daily and weekly.

Engulfing Pattern Hello Traders,
Sharing one of my favorite candlestick pattern with everyone. Feel free to use it.
Regards,
Intraday Guruji

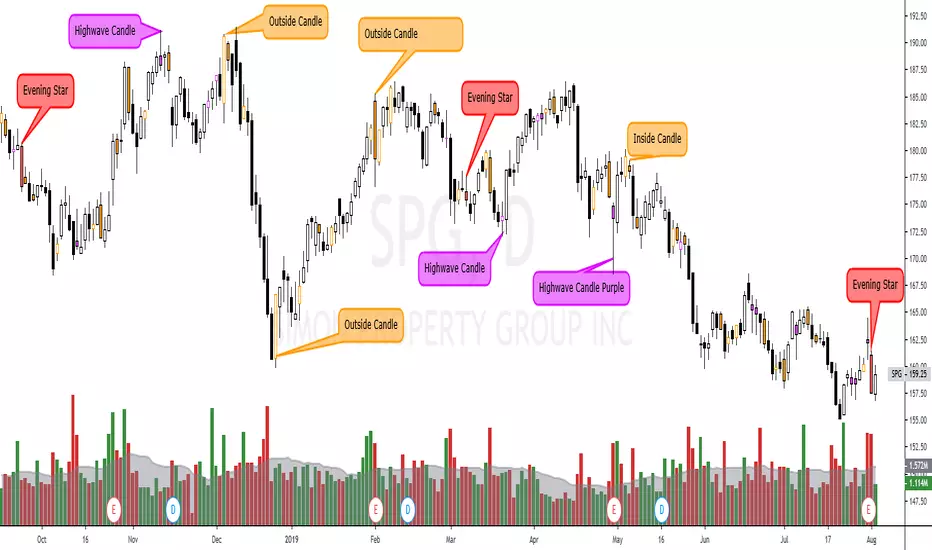
Custom Candle color Inside/Outside candles, Highwave, Star Patt.This script paints outside and inside candles (orange), highwave candles (purple, and morning and evening star patterns (red). You should use hollow candle sticks with this script. I use it to find change in trends or where indecision is present.
Renko Plot StrategyThis strategy lets you plot Renko open and close values, based on your preferred Renko size brick, on normal candle chart. You can use it on any timeframe, define your preferred brick size and trailing stop.

Micro Daily CandlesThis helps me visualize the daily candles on a micro scale by looking at the intraday chart.
The open and close are filled red and green making the body of the daily candle. The current day high and low are marked and represents the daily candle wick.

No Shadow Candles - Alertsalert script to detect candles with no wick, for testing.
scripted on request.

MACD Profit CandlesThis tool is simple yet very effective. It creates new candles on the chart based on the MACD.
Candles are green when MACD is increasing and red when it is decreasing. All lengths can be adjusted in the input menu and there is an option to plot the signal line.
The rules for using it are pretty simple:
1.Buy on Green
2.Sell on red
~Happy Trading~

AntiRekt RibbonThis script is a fork of the Madrid Ribbon, the only difference is that you can color your bars depending on the trend.

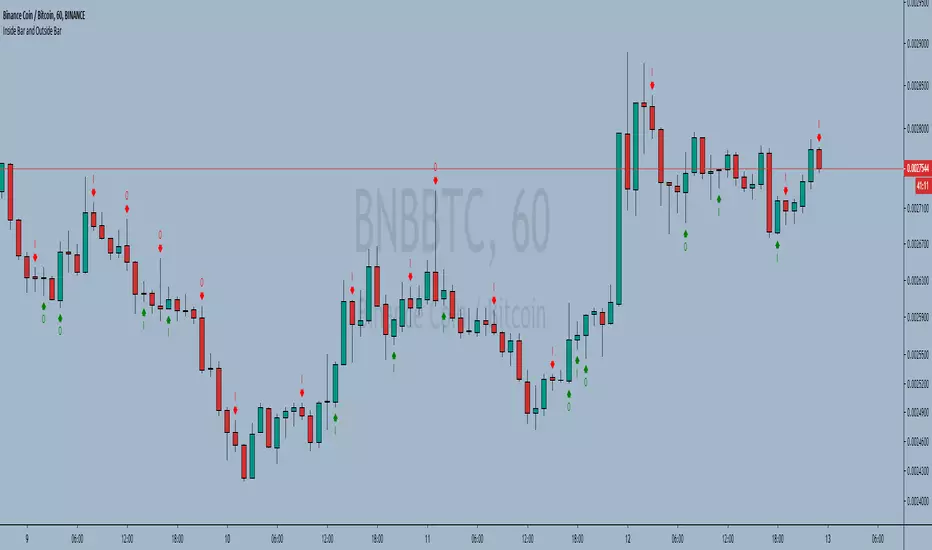
Inside Bar and Outside Bar Simple indicator, to show outside bars and inside bars
inside sellbar = "I" in red color
inside buybar = "I" in green color
Outside sellbar = "O" in red color
Outside buybar = "O" in green color
----------//---------------
PT-BR
Indicador simples, para mostrar outside bars e inside bars
inside sellbar = "I" na cor vermelha
inside buybar = "I" na cor verde
Outside sellbar = "O" na cor vermelha
Outside buybar = "O" na cor verde
MTFCSome people have asked me about this indicator when they see it in my charts so im sharing it for those who are curious. Have a nice day.
