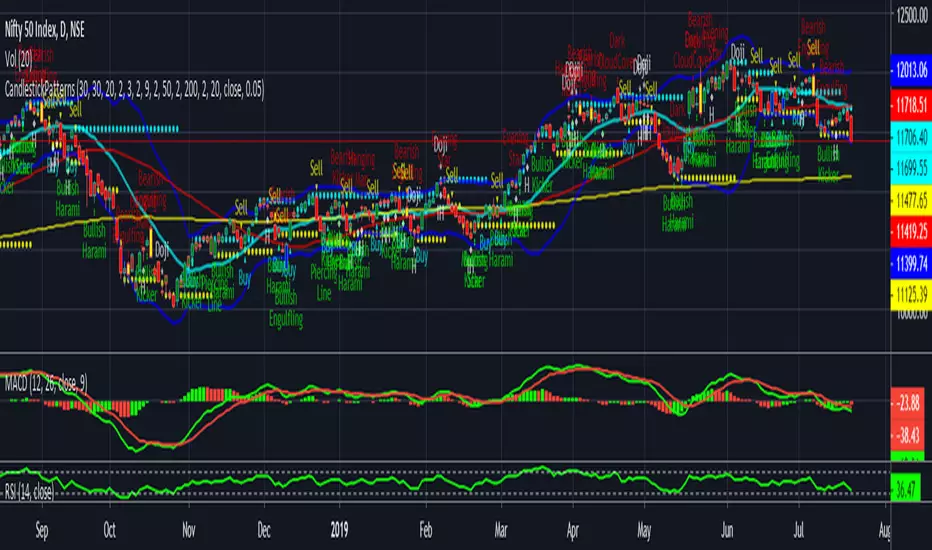
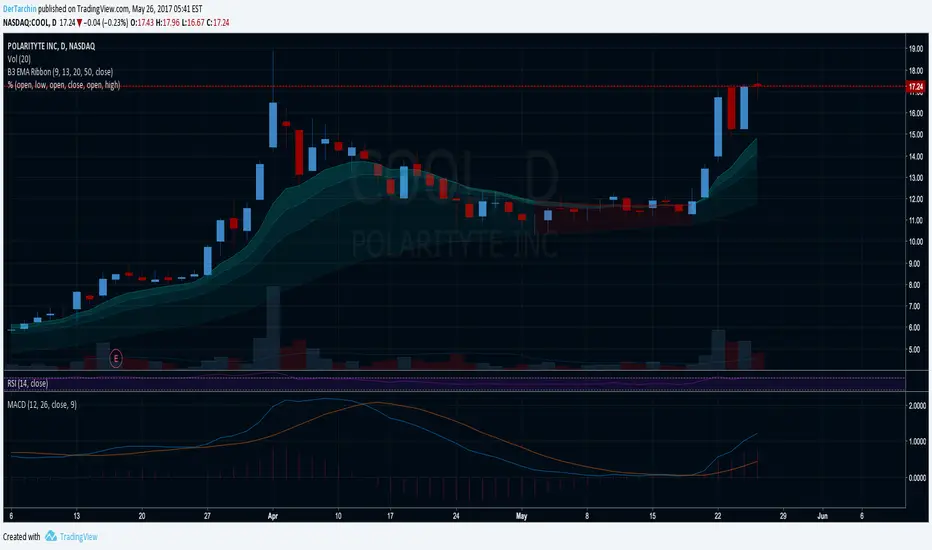
CandlestickPatternsIf moving average SMA (green line) crosses above SMA (red line) is uptrend , stock price will move up gradually. If suppose moving average SMA (green line) crosses below SMA (red line) is downtrend, stock price will move down. Also please validate with MACD & RSI for reference will get more clarification.
The default script have:
1) Bollinger Bands
2) Moving Average
3) Buy & Sell Signals
4) Engulfing patterns (like Doji , Bearish Harami, Bullish Harami, Bearish Engulfing , Bullish Engulfing , Piercing Line, Bullish Belt, Bullish Kicker, and Bearish Kicker)
The Piercing Line, Bullish Belt, and the Kickers will usually show up better in the daily charts.
Candle
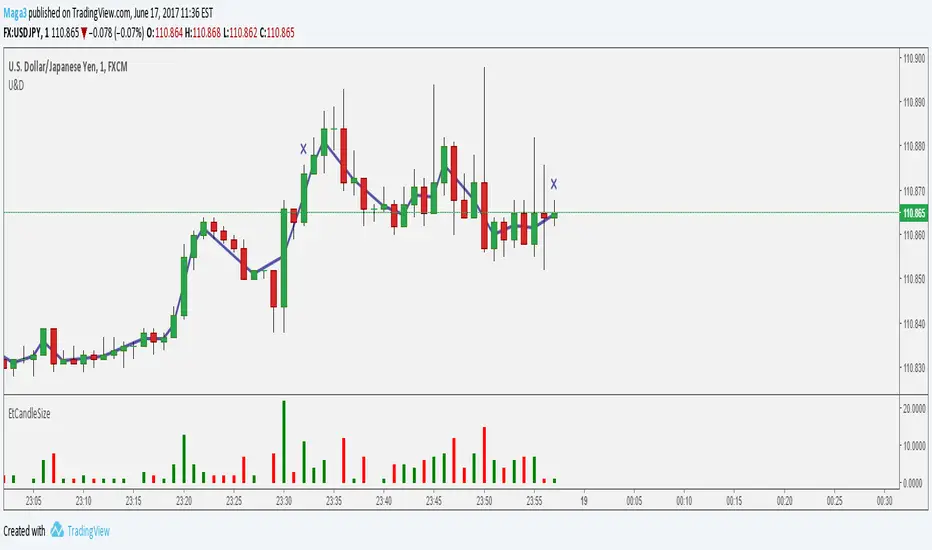
Small candle indicatorI've modified the original script by WiscoDish to show candles as green while they are smaller than the median of the past 10 candles. Once they become larger than the median they'll change to gray.
I've also added a horizontal median line so you can see how close the candle is to the median candle size.
This is very useful if you're stalking a trade and waiting for the candle to close small.

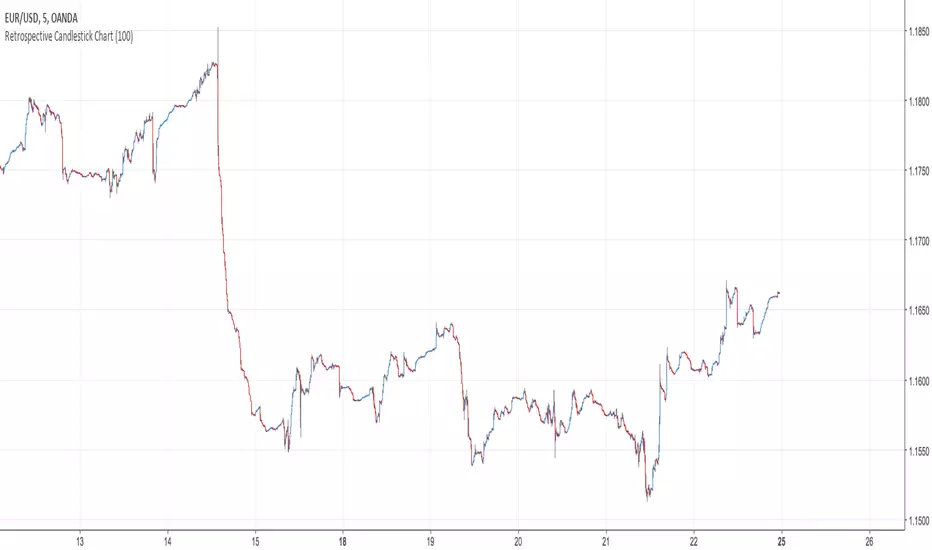
Retrospective Candlestick ChartWhen i was in Japan with some traders colleagues we talked about traditional charting tools from this country and how they changed the way we look at our charts today. Then suddenly one of the japanese traders i have met earlier said "Why not making another charting tool ? Smoother than Heikin-Ashi and including all the information a trader may need but easier to interpret".
So i had the idea of averaging the input and the output of the respective close / open / high and low price using a recursive exponential window functions, each values will be closer to their true value if they are volatile, if they are not then those values will look smoother, the length input represents the reactivity of the candles, high values represents smoother results but less reactive.The goal of those candles is to make all the information easier to interpret by a trader.
500 input length , the price look smoother, supports and resistances are easier to make.
The interpretation of highs and lows are important, the Retrospective Candlestick Chart save you time by showing only huge movements.
DRS - Daily Range SystemAn indicator that visualizes the evolution of a daily candle, inspired by a thread on forexfactory: www.forexfactory.com
Applied on a timeframe lower than D (actually lower than H4), it visualizes the evolution of the day's high and low, as well as mid and 25% and 75% lines.
The sole input parameters are the hour at which a day is supposed to start, and the extent of the "trade allowed" region as explained in the FF -1.44% thread.

Deep CandleAccess two chart resolutions and/or securities with crystal clarity. Have your one minute candles built right into your one hour candles, or whatever other combinations you'd like. Use "Fade Mode" to accentuate low res candles when zoomed out and mute them when zoomed in. Choose any security/exchange and any resolution.
If you'd like to plug this concept into another indicator, I'm at your service.
~jdhadwin
Two resolutions, same exchange, one chart:
Two resolutions, Coinbase 1m & Bitfinex 30m, one chart:
Fade Mode Off
Fade Mode On
1 Minute Chart with 1 Day Candles applied
15 Minute Chart with 1 Day Candles applied (zoomed out)
15 Minute Chart with 1 Day Candles applied (zoomed in) with Fade Mode Off
15 Minute Chart with 1 Day Candles applied (zoomed in) with Fade Mode On

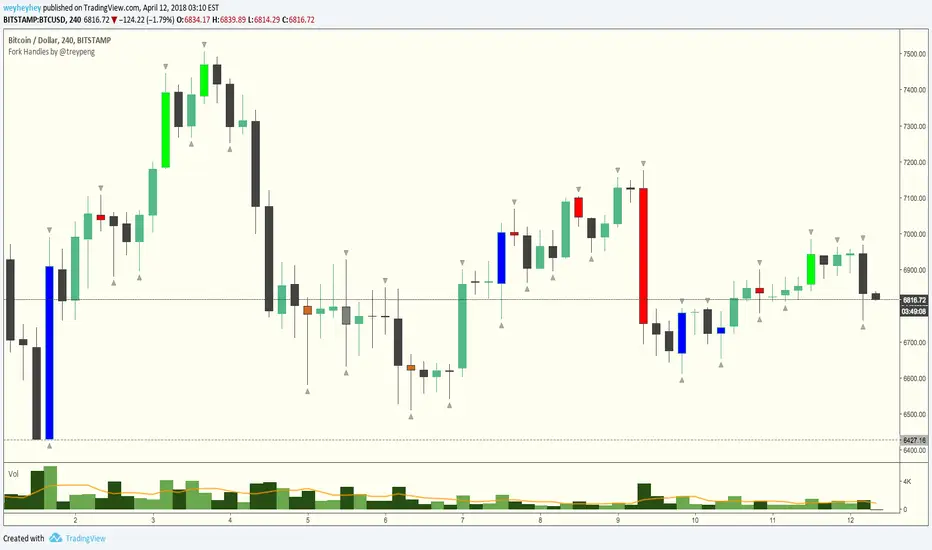
Fork Handles by @treypeng
Candle based indicator that shows swing highs and lows (pivots).
It draws an up or down arrow for simple three candle 'single' swings.
For stronger five candle 'double' swings, it colours the candle. Good for highlighting stronger reversals.
Both of these stylings can be toggled on/off individually.
Default colours
Swing HIGH on an UP candle: bright green
Swing HIGH on an DOWN candle: bright red
Swing LOW on an UP candle: blue
Swing LOW on an DOWN candle: brown
Double swings are grey or white.
Regular candles are just kept to your own default colours as specified in the chart settings.
👏 for anyone who gets the 'fork handles' joke reference.

Candle FMTFMultitimeframe candlesticks with shadows. Script draws each next candle gradually. Sorry for bad english. Good Luck in tradework!

EMA_Cross_Trading_JHVer3.0
- EMA14 and EMA50 Cross detection
- HA 1st profit taking
- Overshoot detection
- Candle shape and Wick analysis

Not closed yet scriptI made this to serve as a reminder if a candle is not closed yet. This is to avoid entering a trade based on a candle that is not closed because this candle could look alot different by the time it closes. Good luck.

Bearish Engulfing StrictMost of the engulfing indicators i tried seemed to only look at the candle bodies which i didnt like. This one takes into account the highs and lows as well. You get less signals but each one seem to be more reliable.

Closing bars arrowsSimple script which adds arrows above or below bars.
Triangles will appear if close prices is in a above 80% or below 20% of tick price bar.
Default values can be changed from settings.

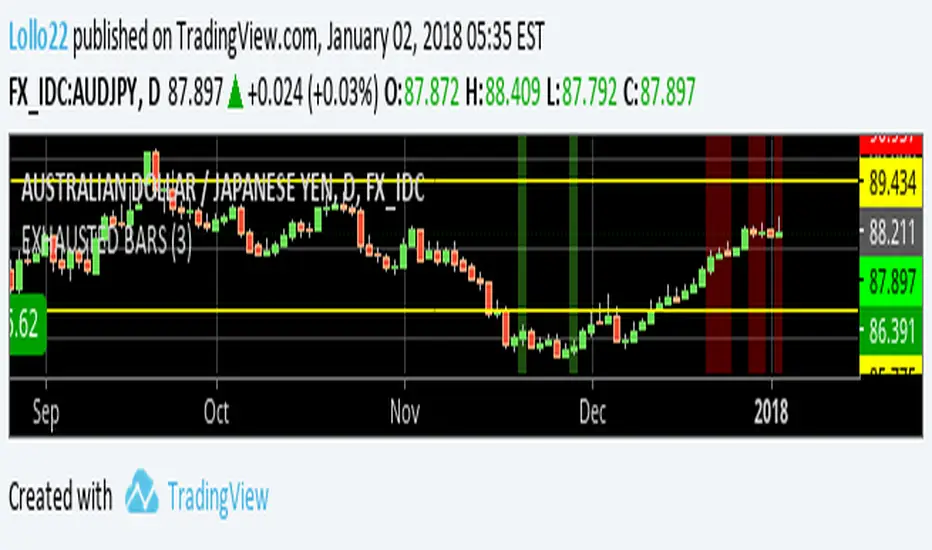
EXHAUSTED BARS - Exit candlestickThis script can spot the candle to exit a trade
it works only on 1d timeframe
Do not trade the signal, just use it to exit the trade in profit (it's not a reversal signal)
NO REPAINT - it' based on current candle close
You can try it for a limited period, ask for access in comments
CandleCounter - Amazingly simple strategyThis might sound like a crazy idea, but actually seems to work, on all time scales nonetheless!

MTF Previous Open/Close/RangeThis indicator will simply plot on your chart the Daily/Weekly/Monthly previous candle levels.
The "Auto" mode will allow automatic adjustment of timeframe displayed according to your chart.
Otherwise you can select manually.
Indicator plots the open/close and colors the high-low range area in the background.
Hope this simple indicator will help you !
You can check my indicators via my TradingView's Profile : @PRO_Indicators

Percent Change per CandleThis indicator allows you to quickly view the true % change per candlestick (prev close > current close), but it also has 3 other customizable values for you to set your own % change conditions (such as open > high). Feel free to edit the script to suit your own needs as well.
Indecision Candle IdentifierThis script helps identify indecision candles on for better entries into trade reversals. Note that I don't believe this signal/indicator should be used as a sole basis for entering/exiting a trade. This is simply to help you have an edge in terms of your chart/candle analysis when your brain fails to keep up with your trades.

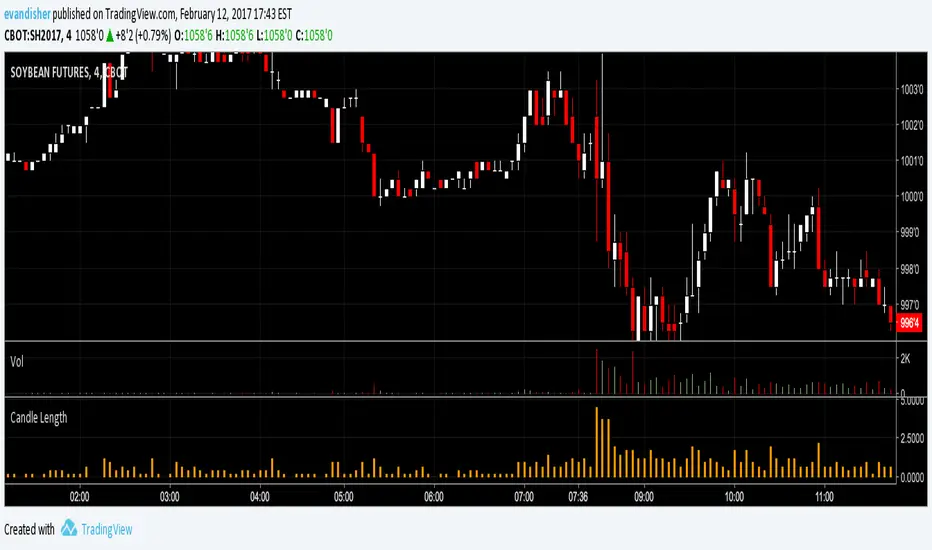
Candle Length by WiscoDishMeasure of the total candle length, including the upper and lower wicks. Works best as a histogram in my opinion. Used as a quick reference for the high minus the low of each candle.

Spirit CandlesSpirit candles are my kinda approach for smoothing the regular candles and I use them always. I coded them in Meta Trader years ago and was a nightmare. Thanks to Tradingview's tools it was a very easy task to be honest. How to use them can not be explained here. But one way is basicly look the tails and wicks. They give an idea if market is trending if uniformly up or down. Fluctuations happen at the trend changes with mixed tails and wicks. Monitoring the price action market will deciede the way and the wick heavy pattern turns to tail or vice versa.
Use inheritence value to fine tune for different time frames or smoothing the price action more...

JC_MacD_RSI_Candle_Strat_public//
// Author : Jacques CRETINON
// Last Version : V1.0 11-22-2016
//
// Risk disclaimer : Do not use this script in production environment. We assume no liability or responsibility for any damage to you, your computer, or your other property, due to the use of this script.
//
// Purpose of this script :
// 1- use same pine code for strategy or study script (with simple modifications)
// 2- be able to send alerts : enterlong, entershort, exitlong, exitshort, stoplosslong, stoplossshort, takeprofitlong, takeprofitshort in a study script like a strategy script should do
// 3- do not repaint (I HOPE)
//
// RoadMap :
// 1- manage : Trailing Stop Loss and Trailing Stop Loss offset
//
// I use this script :
// 1- with default value for XAUUSD, current chart resolution : 1mn, large timeframe : 15mn.
// 2- That's why I hard code MACD5 (5mn average), MACD15 (15mn average), MACD60 (1h average) ...
// 3- MACD, RSI (1mn and 15mn) and Candles info are my inputs to take any decisions
//
// I do not publish my enterLong, enterShort, exitLong and exitShort conditions (lines 204 to 207 are sample !) as they are not as perfect as I'd like. Fell free to use your own conditions :)
//
// Please, report me any bug, fell free to discuss and share. English is not my natural language, so be clement ;) Happy safe trading :)
