CME Gap Oscillator [CryptoSea]Introducing the CME Gap Oscillator , a pioneering tool designed to illuminate the significance of market gaps through the lens of the Chicago Mercantile Exchange (CME). By leveraging gap sizes in relation to the Average True Range (ATR), this indicator offers a unique perspective on market dynamics, particularly around the critical weekly close periods.
Key Features
Gap Measurement : At its core, the CME Oscillator quantifies the size of weekend gaps in the context of the market's volatility, using the ATR to standardize this measurement.
Dynamic Levels : Incorporating a dynamic extreme level calculation, the tool adapts to current market conditions, providing real-time insights into significant gap sizes and their implications.
Band Analysis : Through the introduction of upper and lower bands, based on standard deviations, traders can visually assess the oscillator's position relative to typical market ranges.
Enhanced Insights : A built-in table tracks the frequency of the oscillator's breaches beyond these bands within the latest CME week, offering a snapshot of recent market extremities.
Settings & Customisation
ATR-Based Measurement : Choose to measure gap sizes directly or in terms of ATR for a volatility-adjusted view.
Band Period Adjustability : Tailor the oscillator's sensitivity by modifying the band calculation period.
Dynamic Level Multipliers : Adjust the multiplier for dynamic levels to suit your analysis needs.
Visual Preferences : Customise the oscillator, bands, and table visuals, including color schemes and line styles.
In the example below, it demonstrates that the CME will want to return to the 0 value, this would be considered a reset or gap fill.
Application & Strategy
Deploy the CME Oscillator to enhance your market analysis
Market Sentiment : Gauge weekend market sentiment shifts through gap analysis, refining your strategy for the week ahead.
Volatility Insights : Use the oscillator's ATR-based measurements to understand the volatility context of gaps, aiding in risk management.
Trend Identification : Identify potential trend continuations or reversals based on the frequency and magnitude of gaps exceeding dynamic levels.
The CME Oscillator stands out as a strategic tool for traders focusing on gap analysis and volatility assessment. By offering a detailed breakdown of market gaps in relation to volatility, it empowers users with actionable insights, enabling more informed trading decisions across a range of markets and timeframes.
BTCUSDT

Blackrock Spot ETF Premium BTCUSD (COINBASE) V1I created an indicator that takes the spot BTC/USD pair from major exchanges and compares it to the Spot BTC/USD pair on Coinbase that institutions will use for their Spot ETFs.
Blackrock Spot ETF Premium BTCUSD (COINBASE)
I suspect we will see a new "Kimchi Premium" where the Spot ETF pressures from institutions will raise the Coinbase Bitcoin price by a factor of 10-50% premium to the other exchanges.
Naturally excess coins from other exchanges will flow into Coinbase to capture this.
This indicator should be good for some time until one of the other exchanges delist or stop using BTCUSD "spot" If it breaks it I will update it if I remember.
FederalXBT,

Rainbow Drift BetaRainbow Drift Beta is an indicator that detects the triggers of long and short positions at any TF.
It's based on two different type of approaches to the EMAs periods:
- Classic EMAs periods: 10 and 50
- Cycle EMAs perdios: 16, 64 and 256
The 256 period EMA (Annual Cycle) detects the trend: if the EMA 64 (Three-Weekly Cycle) is above, it shows an uptrend; while the EMA 64 is below, it means that the price action is in downtrend.
10 and 16 periods EMAs are working together as well as the 50 and the 64. The first couple reacts faster than the second one and as soon as the 10 is above the 16, the band shows the first attempt of the price action to go in the uptrend direction. The same concept is applied to the second couple (50, 64): when EMA 50 > EMA 64 it's a confirmation of the faster EMAs long direction. Viceverca happens for the downtrend but with the same concept.
As the EMA periods taken in consideration are quite often a sensitive level of reaction of the price, the indicator detects when there is trigger of a long or a short set up and plots a label on the chart. It's possibile to set up an alert as well.
Quite important, the indicator is looking for sideways patterns as the breakout of them shows a clear direction of the price.
Moreover, in order to privide the first and the best entry possibile, the indicator has a function that is triggering only one time as the trend reverted: for example, a long entry on the EMA 10-16 happens only one time since they crossover the EMA 64.
As included in the name, this is a beta version and new improvements will be added in the near future like suggested price entry, SL and TP, and the focus of the development is to avoid as much as possibile the false triggers.
Of course the best way to improve the code is to receive the users' feedbacks, so please feel free to post your comments and questions.

Crypto Uptrend Script + Pullback//Volume CandlesDescription: his is an adaption of my Pullback candle - This works on all timeframes and Markets (Forex//Stocks//)
Crypto Uptrend Script with Pullback Candle allows traders to get into a trend when the price is at end of a pullback and entering a balance phase in the market (works on all markets). The use of Moving averages to help identify a Trends and the use of Key levels to help traders be aware of where strong areas are in the market.
This script can work really well in Crypto Bull Runs when used on HTF and with confluences
The script has key support and resistance zones which are made up of quarterly data. Price reacts to these areas but patience is required as price will take time to come into these areas
I have updated the Pullback Candle with the use of Volume to filter out the weak Pullback Candles -
There are new candles to the script.
The First candle is the Bullish Volume Candle - This candle is set to a multiplier of 2x with a crossover of 50/100 on Volume - this then will paint a purple candle.
Uses of the Bullish Volume Candle:
Breakthrough of key areas // special chart patterns
Rejection of key areas
End of a impulse wave (Profit Takers)
The second candle is a Hammer - I prefer using the Hammers on Higher Timeframes however they do work on all timeframes. .
The third candle is a Exhaustion of impulse downward move.
Uses of this candle - can denote a new trend but has to be with confluence to a demand area // support area or with any use of technical analysis - using this alone is not advised
The fourth candle is a indecision candle in the shape of a Doji - this candle can help identify if the trend is in a continuation or a reversal
This script can work really well in Crypto Bull Runs
Disclaimer: There will be Pullbacks with High Volume (Breakouts) and not go the way as intended but this script is to allow traders to get into trends at good price levels. The script can paint signals in areas where price is too expensive so please do your own due diligence on the markets as this script is to help get into good areas of price
Please leave a thumbs up if you like this script and message me for information on how to use the script.

BB_MDL_V1Simple indicator that is based on the average line of the bollinger bands and the exponential average of 200 periods.
The customizable variable is bollinger bands length, currently the default is 35, you can tweak it to your liking and see how trend identification changes.
My recommendation is to work in 5-minute time frames in values such as SOL, FTM or MASK (cryptos)
This simple strategy can be combined with many others to gain more insight and get better market entries and exits.

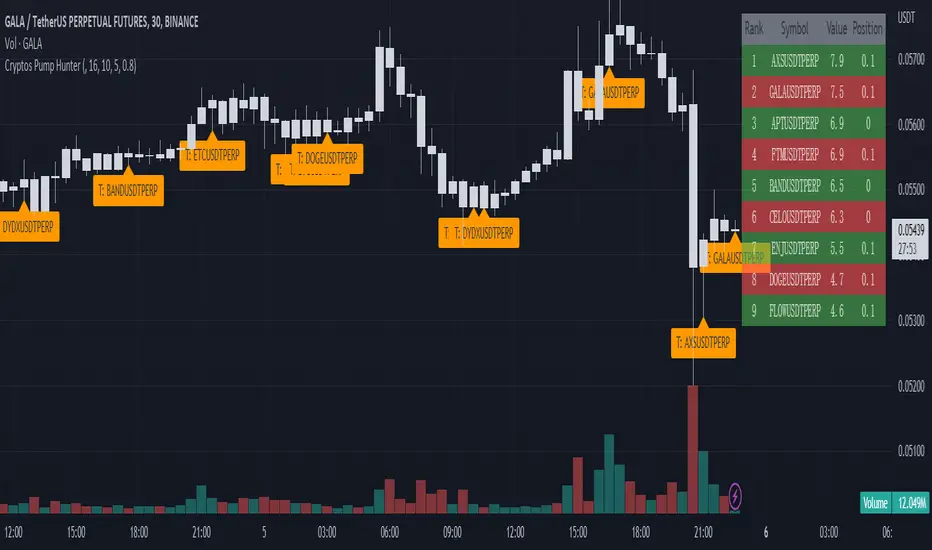
Cryptos Pump Hunter[liwei666]🔥 Cryptos Pump Hunter captured high volatility symbols in real-time, Up to 40 symbols can be monitored at same time.
Help you find the most profitable symbol with excellent visualization.
🔥 Indicator Design logic
🎯 The core pump/dump logic is quite simple
1. calc past bars highest and lowest High price, get movement by this formula
" movement = (highest - lowest) / lowest * 100 "
2. order by 'movement' value descending, you will get a volatility List
3. use Table tool display List, The higher the 'movement', the higher the ranking.
🔥 Settings
🎯 2 input properties impact on the results, 2 input impact on display effects, others look picture below.
pump_bars_cnt : lookback bar to calc pump/dump
resolution for pump : 1min to 1D
show_top1 : when ranking list top1 change, will draw a label
show pump : when symbol over threhold, draw a pump lable
🔥 How TO USE
🎯 only trade high volatility symbols
1. focus on top1 symbol on Table panel at top-right postion, trading symbols at label in chart.
2. Short when 'postion' ~ 0, Long when 'postion' ~ 1 on Table Cell
🎯 Monitor the symbols you like
1. 100+ symbols added in script, cancel remarks in code line if symbol is your want
2. add 1 line code if symbol not exist. if you want monitor 'ETHUSDTPERP ', then add
" ETHUSDTPERP = create_symbol_obj('BINANCE:ETHUSDTPERP'), array.unshift(symbol_a, ETHUSDTPERP ) "
🎯 Alert will be add soon, any questions or suggestion please comment below, I would appreciate it greatly.
Hope this indicator will be useful for you :)
enjoy! 🚀🚀🚀
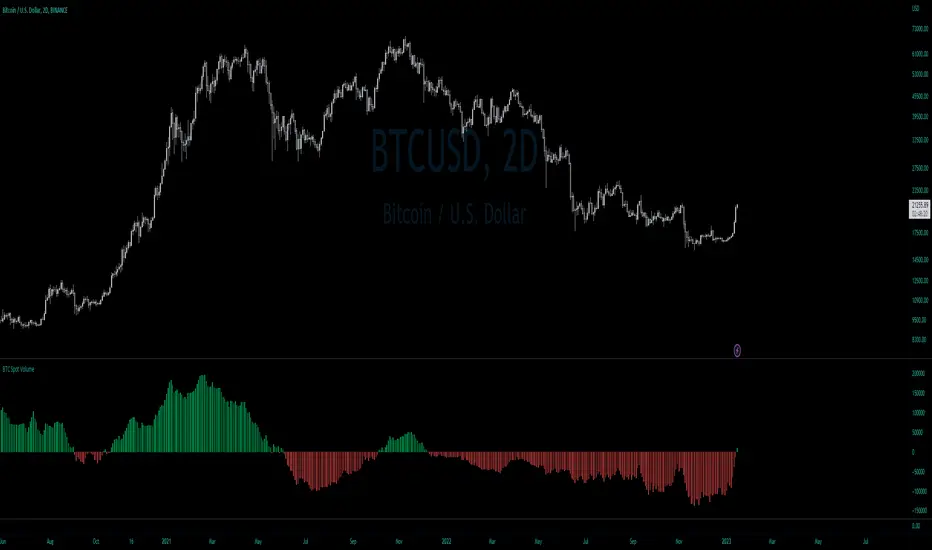
BTC Net Volume (Spot) (by JaggedSoft, fixed by SLN)• WHAT:
This indicator plots the aggregated net volume delta of BTC spot pairs from 8 exchanges over the last 60 periods (default settings).
Tracks the following pairs:
"BINANCE:BTCUSDT"
"BITFINEX:BTCUSD"
"POLONIEX:BTCUSDT"
"BITTREX:BTCUSDT"
"COINBASE:BTCUSD"
"BITSTAMP:BTCUSD"
"KRAKEN:XBTUSD"
"BITGET:BTCUSDT"
"GEMINI:BTCUSD"
• HOW TO USE:
Used for confirmation when watching futures that can experience quick movements in the form of liquidation-events. If the oscillator is green or trending upward, it's confirming a positive bias. The inverse is true for a negative bias. This is especially true on higher timeframes.
Can also be used to find correlations between different tech-assets.
• NOTES:
I forked JaggedSofts indicator to fix the data-source error it was having. Let me know if you want to customize exchanges or add more pairs, maybe I can add that in the future!
This indicator replaces the outdated alternative linked here : Please only use this one
• LIMITATIONS:
Only tested with normal japanese candlesticks .
• THANKS:
to the creator of this script, JaggedSoft. It's a great indicator!
• DISCLAIMER:
Not financial Advice, use at your own risk.
Volume Buy/Sell (by iammaximov)Buy/Sell Volume
Buy/Sell volume based on total bar amplitude (high/low price) and close/open (for calculate vbuy > vsell or vbuy < vsell)

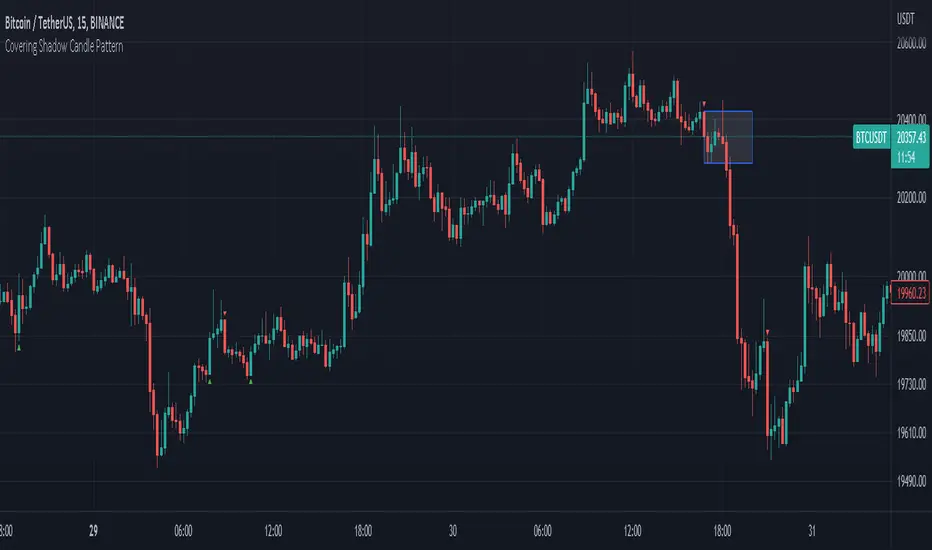
Covering Shadow Candle PatternThis indicator shows 3 types of objects on chart:
1. downward red triangle above a candle: 3 green candles followed by a fourth red candle of which the low price is lower than the low of the 3 previous green candles, this is usually the sign of reversal from upward movement to a downward one.
2. 1. upward green triangle below a candle: 3 red candles followed by a fourth green candle of which the high price is higher than the high of the 3 previous red candles, this is usually the sign of reversal from downward movement to a upward one.
3. boxes: these boxes are drawn when the patterns of cases 1 and 2 fails to perform as expected which means we have some important areas at that level so it can be a resistance or support zone .
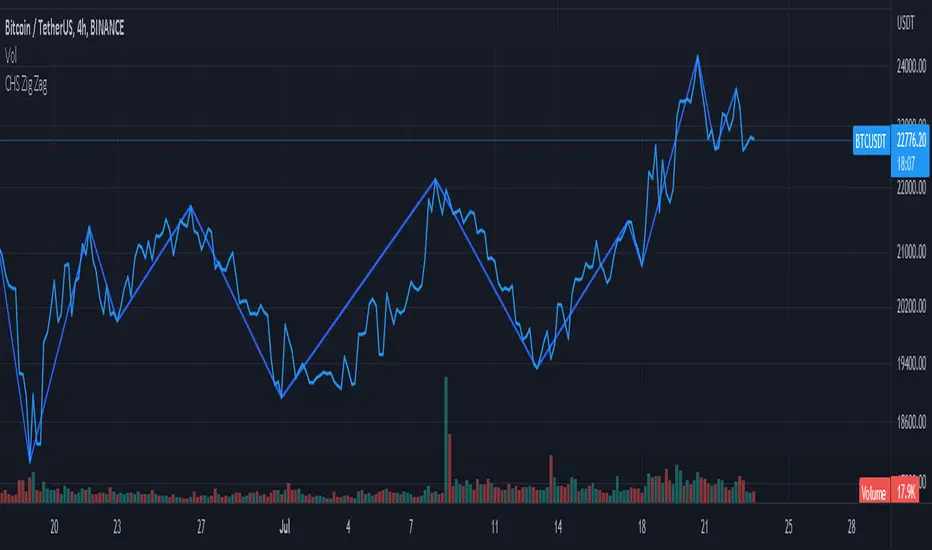
CHS Zig ZagCHS ZigZag stands for Changeable Source ZigZag
The original ZigZag indicator offered by TradingView doesn't have the ability to measure the tips and troughs based on closing prices (line chart), however, this indicator is capable of receiving an input from user that determines the price source used for further calculations.
The default inputs of the original ZigZag indicator have been also changed in order to make it adapt to pivots formed on line chart but users can change arbitrarily.
RSI OverlayThis is the stock RSI index using the Price as the midline.
It can be useful to view information normally displayed in a second pane overlaid on the price chart. As far as I know, this has not been done for one of the most widely used indicators, the Relative Strength Index.
This can be overlaid anywhere on the chart and every parameter is variable. If you'd like to change the position, the RSI, midline, upper line, and lower line are scaled with a factor "*close/x"
To change the position on the chart, simply change the "X" until you are pleased with the location.
The RSI MA was distracting so I removed it. I also published this indicator including the MA, titled "RSI Overlay with MA."

[MACLEN] VolumenTotal
With this indicator, it is intended to know the total volume of the market, adding the volume of the different exchanges in a single indicator.

Trend Day IndentificationVolatility is cyclical, after a large move up or down the market typically "ranges" during the next session. Directional order flow that enters the market during this subsequent session tends not to persist, this non-persistency of transactions leads to a non-trend day which is when I trade intraday reversionary strategies.
This script finds trend days in BTC with the purpose of:
1) counting trend day frequency
2) predicting range contraction for the next 1-2 days so I can run intraday reversion strategies
Trend down is defined as daily bar opening within X% of high and closing within X% of low
Trend up is defined as daily bar opening within X% of low and closing within X% of high
default parameters are:
1) open range extreme = 15% (open is within 15% of high or low)
2) close range extreme = 15% (close is within 15% of high or low)
There is also an atr filter that checks that the trend day has a larger range than the previous 4 bars this is to make sure we find true range expansion vs recent ranges.
Notes:
If a trend day occurs after a prolonged sideways contraction it can signal a breakout - this is less common but is an exception to the rule. These types of occurrences can lead to the persistency of order flow and result in extended directional daily runs.
If a trend day occurs close to 20 days high or low (stopping just short OR pushing slightly through) then wait an additional day before trading intraday reversion strategies.

DashBoard Alt Season by KziHere is a Dashboard to have an overview of the Alt Season oportunity.
Multiple time frame (Month / Week / Daily /4H)
How to use it?
You have 4 columns
TOTAL Crypto / Btc dominance / Btc Price / Alt ?
The alt? column is the resulte of the price and dominance of btc + 1 point with the total crypto
BTC Dominance UP ? Yes = Négatif for ALTS
/// Btc Price UP ?= > Yes = Positif for ALTS
NO = super négatif for ALTS
No = Positif for ALTS
/// Btc Price UP ?= > Yes = super Positif for ALTS
NO = Neutral
The total market just smooth the total.
If Alt columm is Green= It's OK
If Alt columm is orange = carrefull
If Alt Columm is red = leave the alt
You have to considered that you look on the time frame where you want to trade.
The overtime frame help to understand the bigger view.
Hop you like it and give comment to help the évolutions.

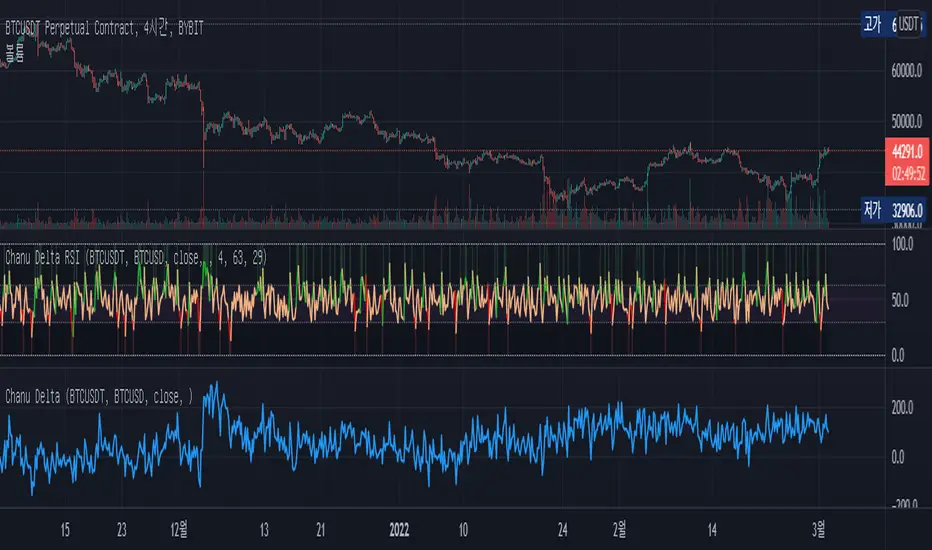
Chanu Delta RSIThis Chanu Delta RSI indicates the strength of the Bitcoin market. The problem with the previous Chanu Delta Indicator was that it was simply based on the price difference between the two Bitcoin markets, so there was no universality. However, this new Chanu Delta RSI solves the problem by introducing an RSI that compares the price difference trend.
This indicator is selectable from both reference and large amplitude BTCUSD markets. I recommend using BYBIT:BTCUSDT for the reference market and COINBASE:BTCUSD for the large amplitude market.
_____________________________________________________________
이 지표는 비트코인 시장의 단기적인 추세를 판단하는데 도움을 줄 수 있습니다. 기존 Chanu Delta 지표의 문제점은 단순히 두 비트코인 시장의 가격차를 기준으로 하여 보편성이 없었다는 점이다. 하지만 이번 새로운 Chanu Delta RSI는 가격차이 추세를 비교하는 RSI를 도입해 문제를 해결했습니다.
이 지표는 레퍼런스 및 큰 진폭 BTCUSD 시장에서 모두 선택할 수 있습니다. 레퍼런스 시장에는 BYBIT:BTCUSDT를 사용하고 큰 진폭 시장에는 COINBASE:BTCUSD를 사용하는 것이 좋습니다.
ROC vs BTCThis is a modification of my Rate of Change Percentile script, used to compare the current ticker (e.g. Altcoins) to BTC.
Essentially we are looking at (Current Ticker ROC percentile) vs (Bitcoin ROC percentile).
In other words, we are using the ROC value of both the current ticker and BTC, and ranking each based on their previous ROC.
We compare the rankings to gauge the relative overperformance or underperformance of the current ticker vs BTC.
The blue line is BTC, the columns are the current ticker.
Green columns above the blue line indicate positive ROC and current ticker has higher ROC ranking than BTC.
Red columns below the blue line indicate negative ROC and current ticker has a higher ROC ranking than BTC.
*** PLEASE LEAVE A LIKE AND FOLLOW IF YOU ENJOY THE SCRIPT ***
Any questions, comments or feedback I'd love to hear from you below!

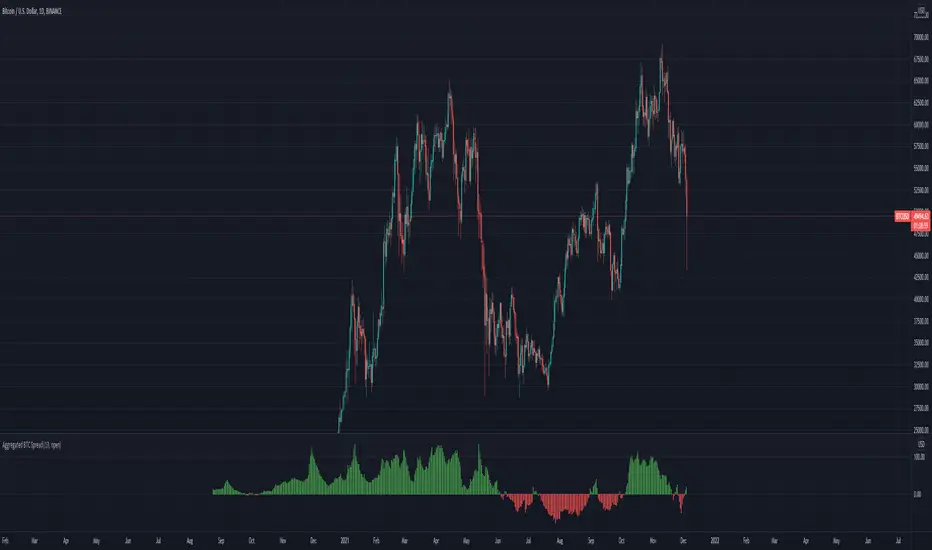
Aggregated BTC SpreadThis script is used to aggregate the bitcoin spread on futures contracts on different platforms.
It works by averaging the for every selected exchange, and apply an EMA of .
It is supporting
Binance (USD / USDT)
Okex
FTX
Huobi
Deribit
Ascendex
CME (BTC1!)
[CP]Pivot Boss Floor Pivots with ATR Dilation and Dynamic LevelsINTRODUCTION:
Compared to all the Pivot Indicators available on Trading View Public Library, this Floor Pivots Indicator differentiates itself in two major original ways:
Dilates the Pivot Support/Resistance Levels into Support/Resistance Bands based on volatility
Displays the S/R Levels Dynamically , that is, only those levels will be shown that are close enough to the price resulting in much cleaner looking charts.
There were a few features whose logic I had figured out, but I could not implement them due Pine Script’s Limitation (they should really work on increasing Pine Script’s capacity instead of adding more and more features to the language in order to make it look ‘better’):
Showing multiple timeframe pivots at the same time (not possible due to Pine Script’s limitation on the ‘Max Number of Outputs’ )
Automatic Detection of highly profitable Double Hot Pivot Zones (DPZ), also due to the ‘Max Number of Outputs’ limit
GENERAL USER INPUTS:
Most of the settings are self-explanatory, however, a few of them need some explanation:
Show Floor Pivots Dynamically – This will turn ON the dynamic pivot levels, please note that this function will work ONLY IN INTRADAY timeframes.
Dynamic Pivot ATR Period – Period over which the ATR value is calculated to show the pivots dynamically.
ATR Threshold for Dynamic Floor Pivots – Simply put, the indicator will start displaying Pivot Levels if they fall within the 2*ATR distance (default value) of the price. You can increase this number if the volatility increases and vice-versa.
Use ATR to Dilate Intraday Pivot Levels – This will turn ON Floor Pivot Dilation, turning pivot ‘lines’ into ‘bands’ .
ATR Dilation Factor – This number decides the width of the Pivot bands. Larger this number, thicker the bands. Typically, high volatility stocks will require a higher number.
ATR Period – Same as Dynamic Pivot ATR Period, but for Pivot Level Dilation.
INDICATOR USAGE EXAMPLES:
This indicator works great in conjunction with my Pivot Boss Candlestick Scanner indicator.
There are a lot of optimizations I have done in the code, although it looks trivial at first glance, but it's fairly complex.
Feel free to use it and modify it as you wish.
Here are a few examples where the indicator has shown great entries and exits, with the default settings:
NIFTY 5m Chart
Reliance 5m Chart
Tesla 5m Chart
Bitcoin-USDT 15m Chart
FINAL WORDS:
Please understand that I have Cherry Picked the examples to showcase the capability of the indicator and its usage.
DO NOT conflate the accuracy of examples with the accuracy of this indicator.
Once you start using floor pivots, you will realize that a lot of days simply don’t give any high probability setups and you will simply sit out of the market and do nothing (which is a good thing).
If you really want to learn how to use Pivots, read the book ’Secrets of a Pivot Boss’ . This book can change your life.

Crypto Scannner for Traffic Lights StrategyI allways try to make trading easier. Developing Scripts for a quick backtest and improvement of a strategy, getting alerts for entry and exit a position. Loading data to a spreadsheet is also important and takes time.
In this case finding good parameters in different markets or assets to enter in a position, is a bit exhausting. It is something you have to do everyday, and sometimes in different moments of the day.
So I manage to develop a Screener, to take a quick look at specific hours, and tell if I have a buy or sell condition in an specific asset. Obviously this is not an alert to make a trade instantaneusly, but this help you filter a lot of information in matters of seconds. Then open those specific charts and make a better analisys.
A few weeks ago, I published a scrpipt called "Traffic Lights Strategy", that uses 4 emas to get a buy or a sell condition.
It is easy to understand and use, but if you don´t want to missed some opportunities, and don't want to be look at the screen in all the time looking for them, I have here a simple solution.
This script works plotting 2 labels. The first one plots all the assets in which the condition is true (fastema > medema > slowema > filterema or fastema < medema < slowema < filterema)
The second one plots the assets were the condition is true only if happened up to 5 candles back, so you can be in time to enter a trade.
You can take the script and customize it for a different strategy or assets. I coded like this because I backtested this strategy in this specific assets, and statistics suggest that it might be profitable.
I hope this works for you. In other time I'll try to code a script for the others strategies I published.

Kimchi Premium Indicator with Selectable SymbolsThis indicator is the Korea Premium, also known as “Kimchi Premium” indicator, which shows how expensive and cheap the bitcoin price of the bitcoin exchange in Korea as compared to the bitcoin price traded in dollars or tether. Previously, the Kimchi premium indicator in TradingView does not have the recently added Upbit BTCKRW market, and it is not possible to select markets. In addition to the recently added Upbit BTCKRW market, this indicator is convenient because you can select all markets offered by TradingView. Therefore, not only bitcoin but also altcoin kimchi premium can be plotted.
▶ Usefulness and Originality
- Users can choose from various BTCKRW and BTCUSD markets.
- Users can plot altcoin Kimchi Premium in addition to Bitcoin.
_____________________________________________________________
이 지표는 달러 혹은 테더로 거래되고 있는 비트코인 가격 대비 한국에 있는 비트코인 거래소의 비트코인 원화 가격이 얼마나 비싸고 싼 지를 나타내는 코리아 프리미엄, 일명 "김치 프리미엄" 지표입니다. 이전에 트레이딩뷰에 있는 김치 프리미엄 지표는 최근에 추가된 업비트 BTCKRW 시장이 없을 뿐만 아니라 마켓을 선택할 수가 없습니다. 이 지표는 최근에 추가된 업비트 BTCKRW 마켓과 더불어 트레이딩뷰에서 제공하는 모든 마켓을 선택할 수 있어 편리합니다. 따라서 비트코인 뿐 만 아니라 알트코인의 김치 프리미엄도 plot할 수가 있습니다.
▶ 유용성과 독창성
- 사용자가 다양한 BTCKRW 및 BTCUSD 마켓을 선택할 수 있음
- 사용자가 비트코인 외에 알트코인 김치프리미엄도 plot 할 수 있음

Chanu Delta IndicatorThe Chanu Delta Indicator was created as the price difference between the two markets using the principle that the Bitcoin price fluctuations in the BTCUSD market on the BYBIT exchange are greater in the BTCUSDT market. This indicator shows the strength of the current market's buys and sells, and helps in short-term trading.
Chanu Delta Indicator (Δ) = BTCUSD ($) - BTCUSDT ($) (Unit: Dollar, Source: Close)
● Δ > 100 : Strong Buy
● 20 < Δ < 100 : Buy
● -20 < Δ < 20 : Neutral
● -100 < Δ < -20 : Sell
● Δ < -100 : Strong Sell

BTC Health (OHLC and TEMA)The "health" (ie, price trend) of Bitcoin has a major influence on the whole cryptocurrency market. Therefore, it can be useful to check the price and trend of BTC prior to entering a new position. This indicator displays BTC candles plus a fast & slow TEMA below the primary chart, so you can check how BTC is behaving.
BTC quote is from BINANCE, using the timeframe of the main chart. TEMA periods can be customized.

BTC Multi Exchange Perpetual PremiumThis script tracks the premium/discount of Bitcoin perpetual contracts at various exchanges.
The premium/discount is calculated against an index price. The index price is calculated from spot exchange prices and are weighted as follows:
Bitstamp:28,81%
Bittrex:5,5%
Coinbase: 38,07%
Gemini: 7,34%
Kraken: 20,28
The difference between this script and other available scripts, is that exciting script seems to only focus on one exchange. This script is also open source.
