Multi-Purpose All in One [SignalCave]Multi-Purpose All in One Indicator Functions
1) Technical Analysis, Technical Ratings
2) Pivots, Primary & Secondary Trends
3) Swings, Engulfs, Golden & Death Crosses, Price Squeezes, Pullbacks, Breakout & Breakdowns, Volume Rushes
4) Momentum Strength
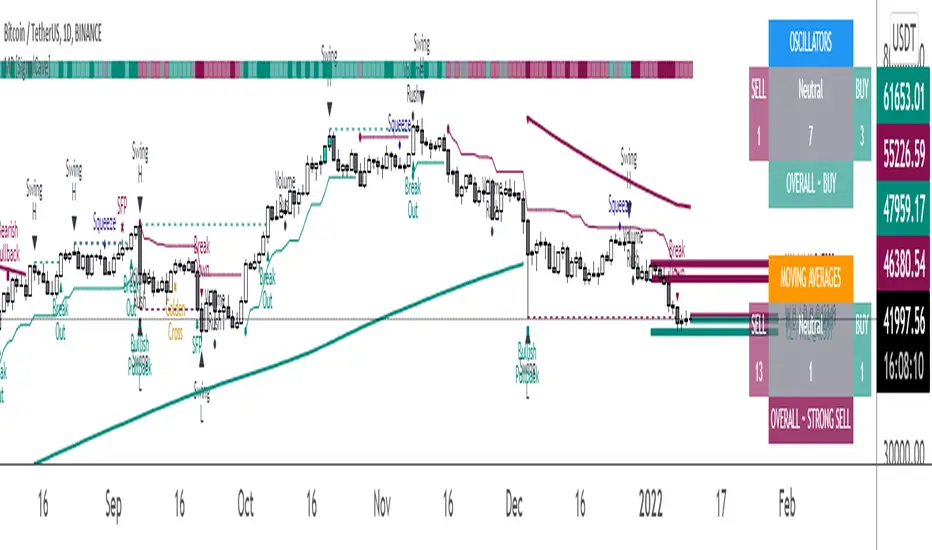
1) Technical Analysis, Technical Ratings
Technical analysis display real-time ratings. It based on the most popular technical indicators such as RSI, Stochastic, CCI, ADX, AO, Momentum, MACD, Stochastic RSI, Williams %, Ichimoku Cloud, SMA, EMA, VWMA and HMA.
Technical analysis is a built-in function on TradingView. You can access any asset’s technical analysis page and see it’s performance in real time.
"Multi-Purpose All in One" indicator brings this function into your TradingView charting screen. Indicator allows you to see the same output without visiting any external web page in TradingView. Indicator also works on every timeframe and asset class.
Technical Ratings is a technical analysis tool that combines the ratings of several technical indicators to make it easier for traders and investors to find profitable trades.
Technical Ratings can be a valuable technical analysis tool for many analysts or traders. Many traders use a selection of complementary indicators to make better decisions. Technical Ratings simplifies this task by combining the most popular indicators and their signals.
2) Pivots, Primary & Secondary Trends
Helps you to identify primary and secondary trends and potential support/resistance zones.
Trend detection have three modes which are “Aggressive, Moderate and Conservative” . You can customize the mode on settings screen.
3) Swings, Engulfs, Golden & Death Crosses, Price Squeezes, Pullbacks, Breakout & Breakdowns, Volume Rushes
A swing low is when price makes a low and is immediately followed by consecutive higher lows. Likewise, a swing high is when price makes a high and is followed by consecutive lower highs.
Swing Failure Pattern (SFP) is a type of reversal pattern that can be used as buy or sell signals.
Engulfing candles tend to signal a reversal of the current trend in the market. This specific pattern involves two candles with the latter candle 'engulfing' the entire body of the candle before it.
On this indicator, bullish engulfs visible only on downtrend and oversold conditions. Bearish engulfs visible only on uptrend and overbought conditions.
The death cross and golden cross are technical analysis terms for when a moving average (MA) intersects with another from either above or below.
The cross, depending on which it is, can signal the start of a new trend or the end of one.
Squeeze signs signifies low volatility, market preparing itself for an explosive move up or down direction.
Bullish Pullbacks are widely seen as buying opportunities after an asset has experienced a large upward price movement. Most pullbacks involve an asset's price moving to an area of technical support , such as a moving average, before resuming their uptrend.
Bearish Pullbacks are widely seen as selling opportunities after an asset has experienced a large downward price movement. Most pullbacks involve an asset's price moving to an area of technical resistance , such as a moving average, before resuming their downtrend.
A breakout refers to when the price of an asset moves above a resistance area, breakdown refers to when the price of an asset moves below a support area.
Breakouts/breakdowns indicate the potential for the price to start trending in the breakout direction.
For example, a breakout to the upside from a chart pattern could indicate the price will start trending higher.
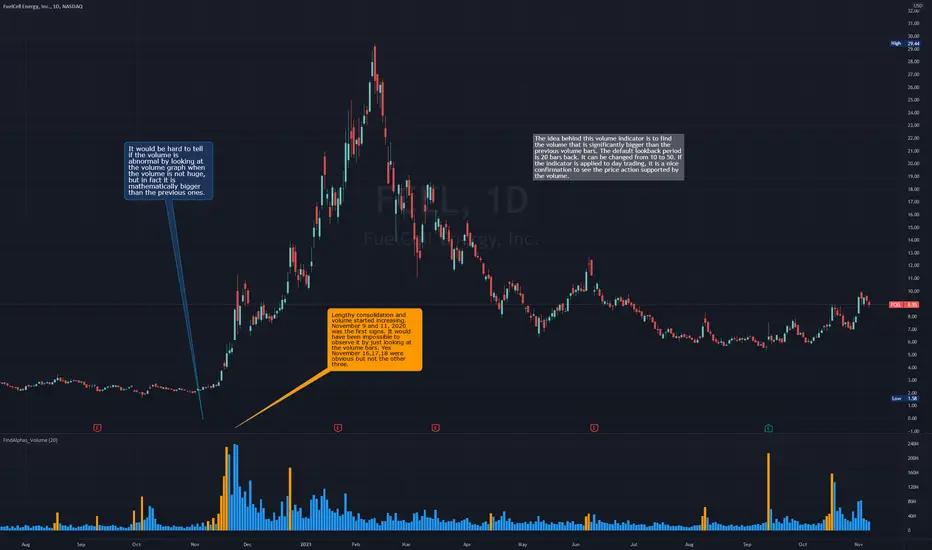
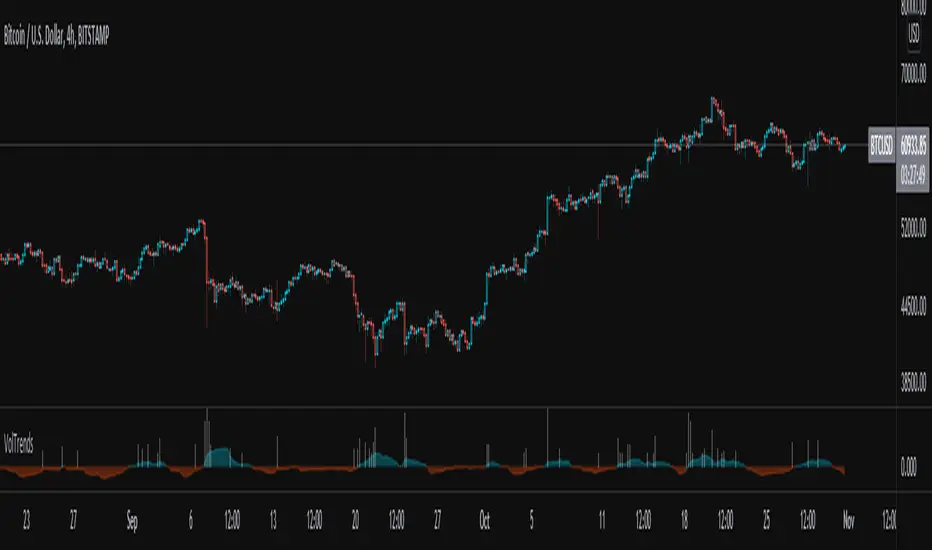
Volume rush signs appears when the trading volume increases more then a usual period. It can be useful with combining breakout signals as a confirmation.
4) Momentum Strength
Momentum Indicator helps you to identify potential reversal areas .
Calculation done with using Relative Strength Index (RSI), Money Flow Index (MFI) and Average Directional Movement Index (ADX) indicators.
On full strength bearish movement bars paints as light red , full strength bullish movement bars paints as light green color.
They indicates that trend can be change to opposite direction in a short period of time.
Momentum Strength have three modes which are "Aggressive, Moderate and Conservative" . You can customize the mode on settings screen.
Pine Script® Indikator