RSI - (R.A Trader)Of course. Here is a descriptive text in English for the custom RSI indicator, written for the students of R.A. Trader.
The R.A. Trader Custom RSI Indicator
1. Overview
Welcome, students of R.A. Trader!
This is the official custom Relative Strength Index (RSI) indicator designed specifically to support the analytical methods taught by Rudá Alves. This tool replaces the standard RSI with a specialized configuration, providing a more nuanced view of market momentum that aligns directly with the R.A. Trader strategy.
Its purpose is to help you quickly and accurately identify key zones of strength, weakness, and potential market exhaustion.
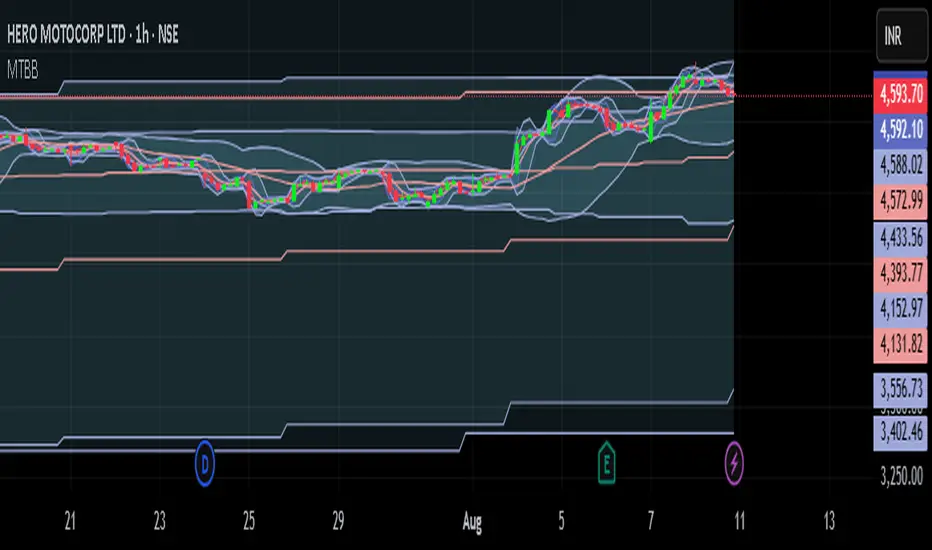
Breitenindikatoren

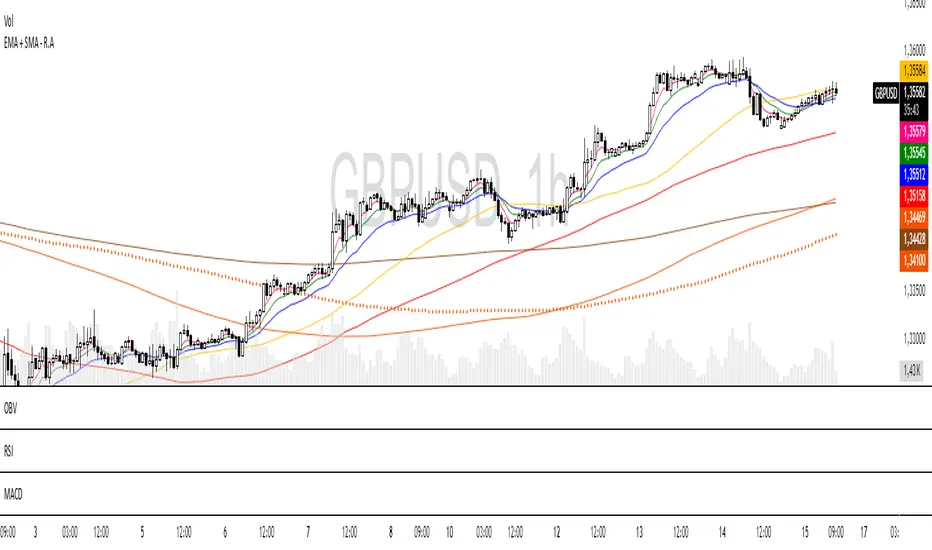
EMA + SMA - R.AR.A. Trader - Multi-MA Suite (EMA & SMA)
1. Overview
Welcome, students of R.A. Trader!
This indicator is a powerful and versatile tool designed specifically to support the trading methodologies taught by Rudá Alves. The R.A. Trader Multi-MA Suite combines two fully customizable groups of moving averages into a single, clean indicator.
Its purpose is to eliminate chart clutter and provide a clear, at-a-glance view of market trends, momentum, and dynamic levels of support and resistance across multiple timeframes. By integrating key short-term and long-term moving averages, this tool will help you apply the R.A. Trader analytical framework with greater efficiency and precision.
2. Core Features
Dual Moving Average Groups: Configure two independent sets of moving averages, perfect for separating short-term (EMA) and long-term (SMA) analysis.
Four MAs Per Group: Each group contains four fully customizable moving averages.
Multiple MA Types: Choose between several types of moving averages for each group (SMA, EMA, WMA, HMA, RMA).
Toggle Visibility: Easily show or hide each group with a single click in the settings panel.
Custom Styling: Key moving averages are styled for instant recognition, including thicker lines for longer periods and a special dotted line for the 250-period SMA.
Clean and Efficient: The code is lightweight and optimized to run smoothly on the TradingView platform.
Group 1 (Default: EMAs)
This group is pre-configured for shorter-term Exponential Moving Averages but is fully customizable.
Setting Label Description
MA Type - EMA Select the type of moving average for this entire group (e.g., EMA, SMA).
EMA 5 Sets the period for the first moving average.
EMA 10 Sets the period for the second moving average.
EMA 20 Sets the period for the third moving average.
EMA 400 Sets the period for the fourth moving average.
Show EMA Group A checkbox to show or hide all MAs in this group.
Exportar para as Planilhas
Group 2 (Default: SMAs)
This group is pre-configured for longer-term Simple Moving Averages, often used to identify major trends.
Setting Label Description
MA Type - SMA Select the type of moving average for this entire group.
SMA 50 Sets the period for the first moving average.
SMA 100 Sets the period for the second moving average.
SMA 200 Sets the period for the third moving average.
SMA 250 Sets the period for the fourth moving average (styled as a dotted line).
Show SMA Group A checkbox to show or hide all MAs in this group.
Exportar para as Planilhas
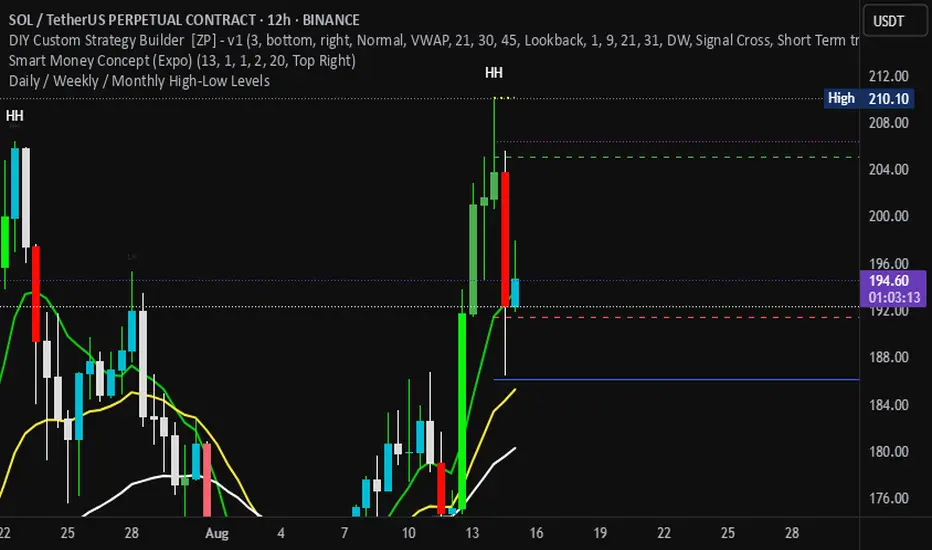
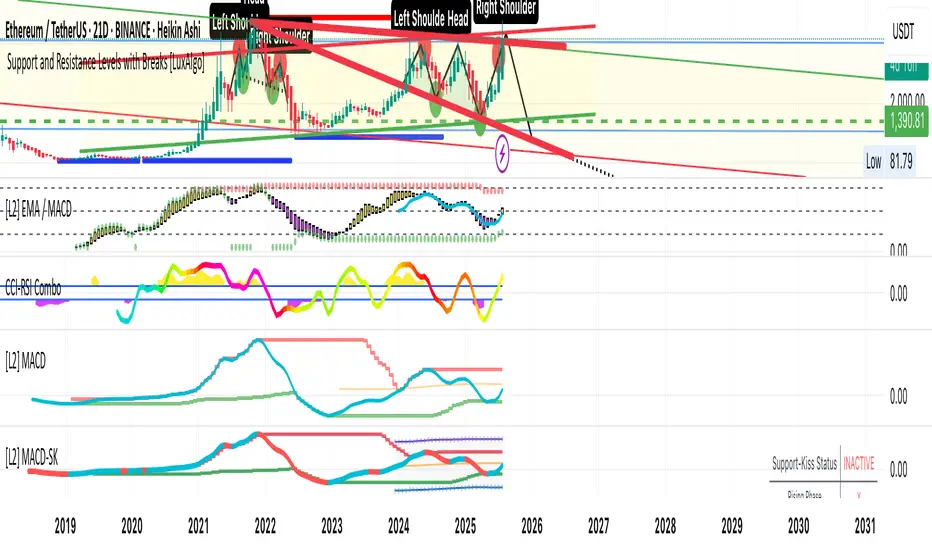
Daily / Weekly / Monthly High-Low Levels (Arindam )How it works:
Daily levels are taken from the previous day.
Weekly levels are from the previous week.
Monthly levels are from the previous month.
They extend across the chart for visual reference.
You can customize colors, line styles, or whether they reset each session.
Do you want me to also add labels on the right side (e.g., “Daily High”, “Weekly Low”) so the lines are clearly marked?
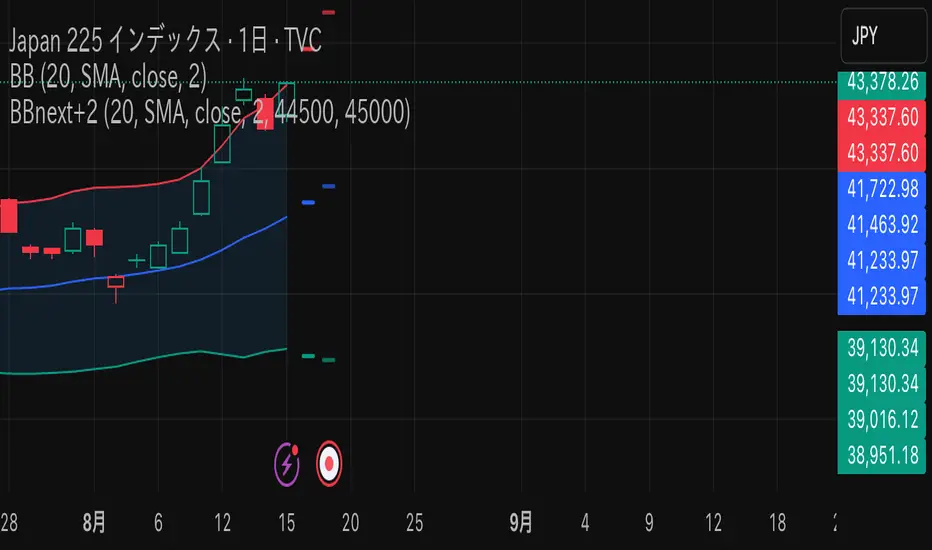
BB next+2This indicator extends the standard Bollinger Bands by allowing you to project future Bollinger Bands based on assumed closing prices for the next trading day (+1) and the day after (+2).
Key Features:
Plots standard Bollinger Bands (supports SMA, EMA, etc.)
Allows manual input of assumed closing prices for the next trading day (+1) and the day after (+2)
Displays projected Bollinger Bands (basis, upper, and lower) based on the input values
Option to restrict display to the latest bar or confirmed bars only
RSI + Estocástico con Flechas y Divergencias RSIThis indicator combines the Relative Strength Index (RSI) and the Stochastic Oscill ator in one panel, displaying arrows at key overbought and oversold points. It helps traders identify potential reversal zones using two momentum indicators for confirmation.

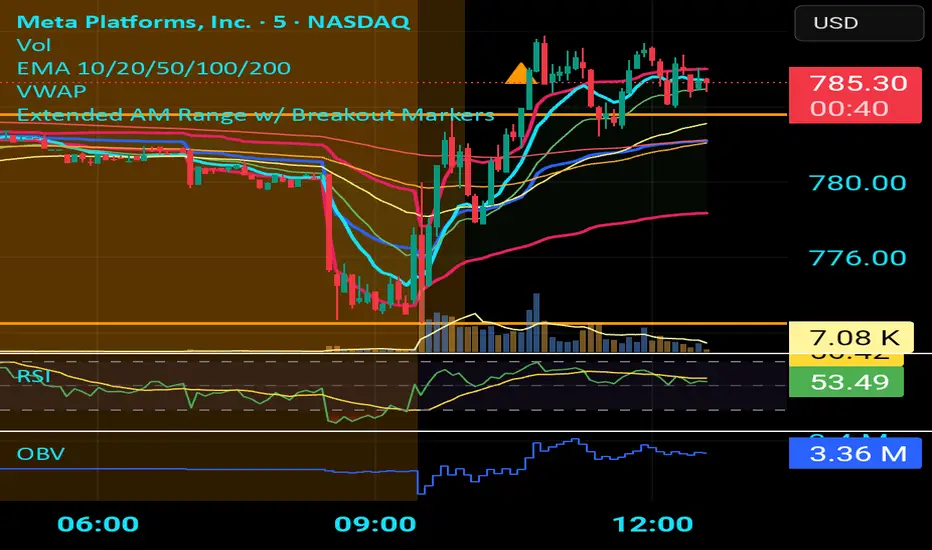
Extended AM Range w/ Breakout Markerscreates a range from market starting till 10 am (half an hour into the market
Trading Sessionsconst string TZ_TOOLTIP_TEXT = "The session's time zone, specified in either GMT notation (e.g., 'GMT-5') or as an IANA time zone database name (e.g., 'America/New_York')."

Trading bot gridsGuide: Price Lines – Arithmetic vs. Geometric
This script draws horizontal price lines (grids) between a start price and an end price.
You can choose whether the lines are distributed evenly (arithmetic) or by percentage (geometric).
🔧 Inputs
Start Price → Lower or upper boundary of the price range.
End Price → Opposite boundary of the price range.
Number of Lines → Total number of lines to be drawn between the start and end prices.
Distribution →
Arithmetic: Fixed USDT distance between each line.
Geometric: Fixed percentage distance between each line.
Grid Color → Color of the drawn lines.
📈 How it Works
The script calculates the lower (lo) and upper (hi) boundaries, regardless of which is entered first.
Arithmetic distribution: Each line is spaced by a fixed amount in USDT.
Geometric distribution: Each line is spaced by the same percentage difference from the previous one.
Lines are created only once at the first bar and remain on the chart.
All lines are extended across the entire visible chart.
💡 Tips
Useful for Grid Bot backtesting or visualizing price zones.
Works for both long and short price ranges.
In geometric mode, lines appear closer together near the lower price range and farther apart toward the upper range.

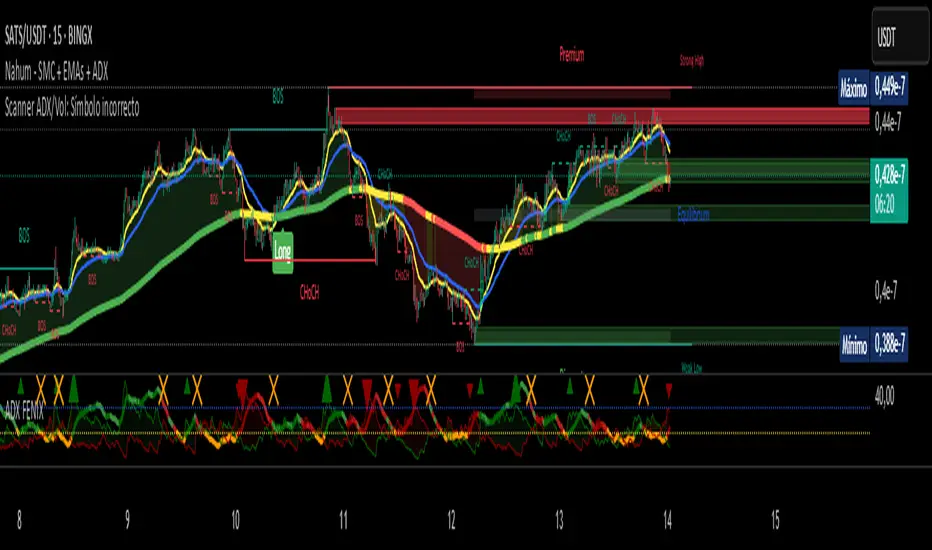
Scanner ADX & VolumenThis indicator is a market scanner specifically designed for scalping traders. Its function is to simultaneously monitor 30 cryptocurrency pairs from the BingX exchange to identify entry opportunities based on the start of a new, strengthening trend.
Strategy and Logic:
The scanner is based on the combination of two key conditions on a 15-minute timeframe:
Trend Strength (ADX): The primary signal is generated when the ADX (Average Directional Index) crosses above the 20 level. An ADX moving above this threshold suggests that the market is breaking out of a consolidation phase and that a new trend (either bullish or bearish) is beginning to gain strength.
Volume Confirmation: To validate the ADX signal, the indicator checks if the current candle's volume is higher than its simple moving average (defaulting to 20 periods). An increase in volume confirms market interest and participation, adding greater reliability to the emerging move.
How to Use It:
The indicator displays a table in the top-right corner of your chart with the following information:
Par: The name of the cryptocurrency pair.
ADX: The current ADX value. It turns green when it exceeds the 20 level.
Volume: Shows "OK" if the current volume is higher than its average.
Signal: This is the most important column. When both conditions (ADX crossover and high volume) are met, it will display the message "¡ENTRADA!" ("ENTRY!") with a highlighted background, alerting you to a potential trading opportunity.
In summary, this scanner saves you the effort of manually analyzing 30 charts, allowing you to focus solely on the assets that present the best conditions for a scalping trade.
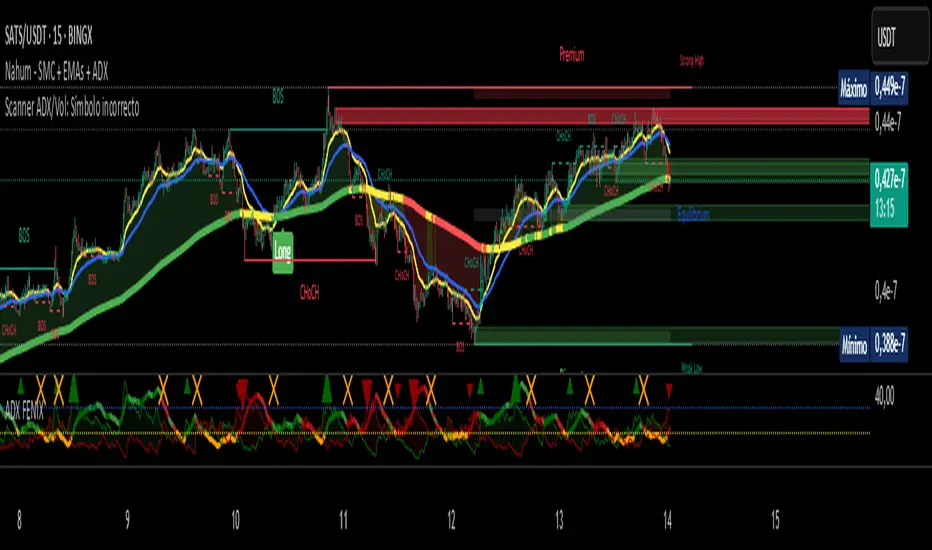
Scanner ADX & Volumen This indicator is a market scanner specifically designed for scalping traders. Its function is to simultaneously monitor 30 cryptocurrency pairs from the BingX exchange to identify entry opportunities based on the start of a new, strengthening trend.
Strategy and Logic:
The scanner is based on the combination of two key conditions on a 15-minute timeframe:
Trend Strength (ADX): The primary signal is generated when the ADX (Average Directional Index) crosses above the 20 level. An ADX moving above this threshold suggests that the market is breaking out of a consolidation phase and that a new trend (either bullish or bearish) is beginning to gain strength.
Volume Confirmation: To validate the ADX signal, the indicator checks if the current candle's volume is higher than its simple moving average (defaulting to 20 periods). An increase in volume confirms market interest and participation, adding greater reliability to the emerging move.
How to Use It:
The indicator displays a table in the top-right corner of your chart with the following information:
Par: The name of the cryptocurrency pair.
ADX: The current ADX value. It turns green when it exceeds the 20 level.
Volume: Shows "OK" if the current volume is higher than its average.
Signal: This is the most important column. When both conditions (ADX crossover and high volume) are met, it will display the message "¡ENTRADA!" ("ENTRY!") with a highlighted background, alerting you to a potential trading opportunity.
In summary, this scanner saves you the effort of manually analyzing 30 charts, allowing you to focus solely on the assets that present the best conditions for a scalping trade.
Fabian Z-ScoreFabian Z-Score — % Distance & Z-Scores for SPX / DJI / XLU
What it does
This indicator measures how far three market proxies are from a moving average and standardizes those distances into z-scores so you can spot stretch/mean-reversion and relative out/under-performance.
Universe: S&P 500 (SPX), Dow Jones (DJI) and Utilities (XLU). You can change any of these in Inputs.
Anchor MA: user-selectable MA type (SMA/EMA/RMA/WMA/VWMA/HMA/LSMA/ALMA) and length (default 39; a popular weekly anchor).
Outputs
% from MA: 100 × (𝐶𝑙𝑜𝑠𝑒 − 𝑀𝐴) / 𝑀𝐴
Time-series Z: z-score of the last N % distances (default 39) → “how stretched vs its own history?”
Cross-sectional Z: z-score of each % distance within the trio on this bar → “who’s strongest vs the others right now?”
A compact mini table (top-right) shows the latest values for each symbol: % from MA, Z(ts) and Z(xsec).
Panels & Visualization
Toggle what you want to see in View:
Plot % distance — raw % above/below the MA (0% line shown).
Plot time-series Z — standardized stretch with ±Threshold guides (default ±2σ).
Plot cross-sectional Z — relative z across SPX, DJI, XLU (0 = at the trio’s mean).
Smoothing — optional light MA on the plotted series (set to 1 for none).
A price-panel Moving Average is drawn with your chosen type/length for visual context.
Colors: SPX = teal, DJI = orange, XLU = purple.
Alerts
Two built-in alert conditions (time-series Z only):
“Z(ts) crosses up +Thr” — any of the three crosses above +Threshold.
“Z(ts) crosses down -Thr” — any crosses below −Threshold.
When enabled, the chart background tints faint green (up cross) or red (down cross) on those bars.
How to use (ideas, not advice)
On weekly charts, a 39-length MA/Z lookback often captures major risk-on/off swings. (Fabian Timing)
Deep negative Z(ts) (e.g., ≤ −2σ or −3σ) frequently accompanies panic and mean-reversion setups.
High positive Z(ts) suggests over-extension; watch for momentum fades.
Cross-sectional Z helps rank leadership today:
Z(xsec) > 0 → stronger than the trio’s mean this bar; Z(xsec) < 0 → weaker.
Utilities (XLU) turning positive x-sec while the others are negative can hint at defensive rotation.
If all 3 are above 0, go long, if below 0 go cash.
Combine: look for extreme Z(ts) aligning with lead/lag Z(xsec) to time entries/exits or hedges.
Inputs (quick reference)
Symbols: SPX / DJI / XLU (editable).
MA type & length: SMA, EMA, RMA, WMA, VWMA, HMA, LSMA, ALMA; default EMA(39).
Z-score lookback (ts): default 39.
Smoothing on plots: default 1 (off).
Z threshold (±): default 2.0 (guide lines & alerts).

RSI DJ GUTO 2025RSI do Samuca, tem de trocar as cores, esse e o usado nas lives, tem de trocar as cores pra ficar igual ao do Samuca pois aqui nao consegui trocar as cores.
Samuca's RSI, you have to change the colors, this is the one used in the lives, you have to change the colors to be the same as Samuca's because I couldn't change the colors here.

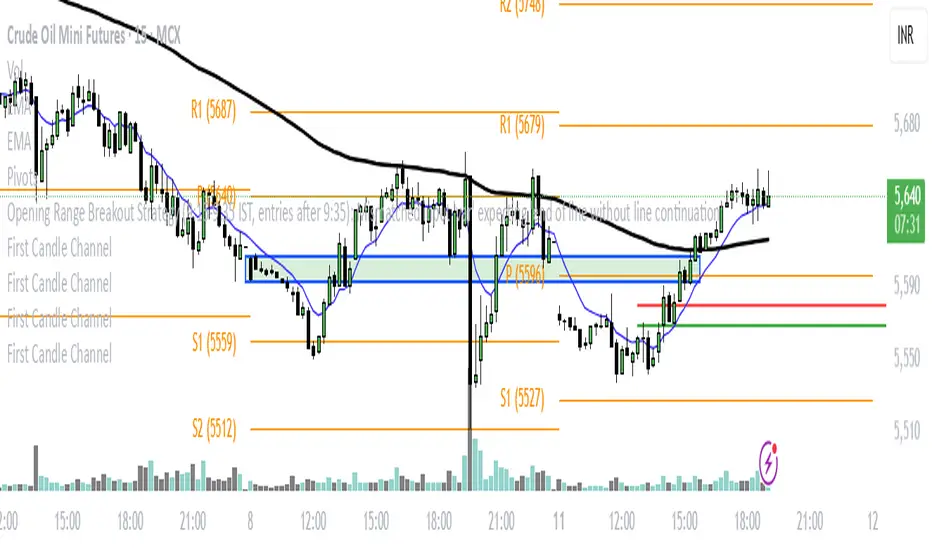
First Candle ChannelTo create a price channel on the 15-minute timeframe based on the first candle's highest and lowest points, follow these steps:
Identify the first 15-minute candle of the trading session or your observation period.
Note the high and low prices of this first candle.
Draw two horizontal lines on the chart:
The upper line at the highest price of the first candle.
The lower line at the lowest price of the first candle.
These two lines form the channel boundaries for subsequent price action.
You can use this channel to observe price movement, noting when price breaks above (bullish breakout) or below (bearish breakdown) the channel formed by the first candle.
This method creates a simple visual range reference based on the initial price movement of the session or period, often used to gauge early strength or rarity of breakout events.
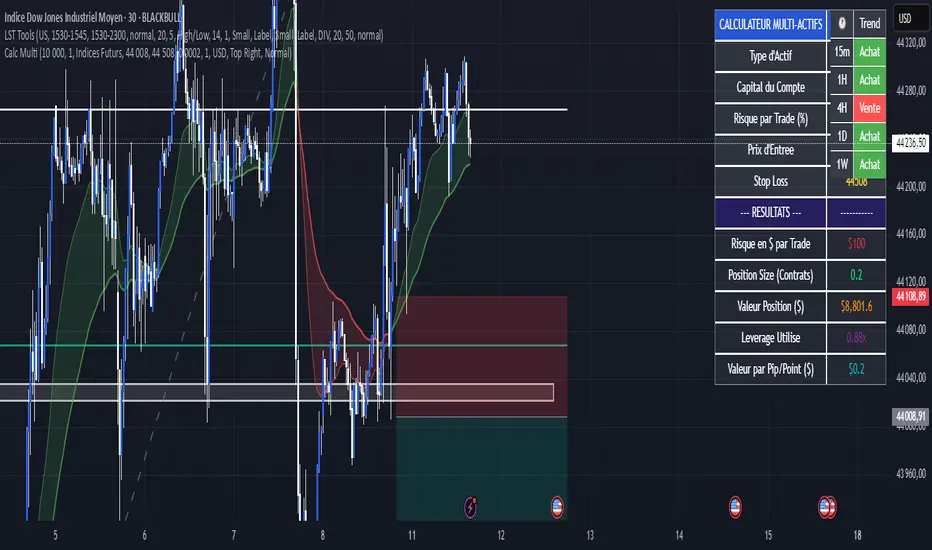
Calculateur Position Size Multi-ActifsThe Multi-Asset Position Size Calculator v6 is a fully customizable Pine Script indicator designed to help you determine the optimal position size based on your risk tolerance across any market: Forex, stocks, crypto, futures indices, or commodities. Features include:
Asset Type Selector: Choose between Forex, Stocks, Crypto, Futures Indices, or Commodities
Account Capital & Risk: Set your total account size and risk percentage per trade
Entry Price & Stop-Loss: Configure your entry and stop-loss levels directly
Automatic or Custom Pip/Point Value: Automatically calculates pip/point value by asset class or enter your own
Contract Size Adjustment: Define contract sizes (e.g., 100,000 units for Forex, 1 for stocks/crypto)
Margin & Leverage Display: View your used leverage and position value in real time
Risk Alerts: Warnings for invalid inputs, high leverage (>10×), and asset-specific risk settings (e.g., crypto leverage)
Integrated Table Interface: On-chart table with adjustable position and text size
Optional Price Level Drawing: Display entry and stop-loss lines on the chart
Trade any market confidently with precise, asset-tailored position sizing and risk management.
連騰カウントCount arbitrary winning streaks and calculate their occurrence probability over a specified period.
For example, if a 5-day winning streak occurs only 0.3% of the time, it indicates that the price movement is not random, but rather a clear sign of capital inflows — making it a useful metric for analysis.

Fractal Suite: MTF Fractals + BOS/CHOCH + OB + FVG + Targets Kese Way
Fractals (Multi-Timeframe): Automatically detects both current-timeframe and higher-timeframe Bill Williams fractals, with customizable left/right bar settings.
Break of Structure (BOS) & CHoCH: Marks structural breaks and changes of character in real time.
Liquidity Sweeps: Identifies sweep patterns where price takes out a previous swing high/low but closes back within range.
Order Blocks (OB): Highlights the last opposite candle before a BOS, with customizable extension bars.
Fair Value Gaps (FVG): Finds 3-bar inefficiencies with a minimum size filter.
Confluence Zones: Optionally require OB–FVG overlap for high-probability setups.
Entry, Stop, and Targets: Automatically calculates entry price, stop loss, and up to three take-profit targets based on risk-reward ratios.
Visual Dashboard: Mini on-chart table summarizing structure, last swing points, and settings.
Alerts: Set alerts for new fractals, BOS events, and confluence-based trade setups.

Gamma & Max Pain HelperGamma & Max Pain Helper
Plots Call Wall, Put Wall, and Max Pain levels directly on your chart so you can see where options positioning might influence price.
Features:
Manually enter Call Wall, Put Wall, and Max Pain strike prices.
Lines auto-update each bar — no redrawing needed.
Labels display name + strike price.
Option to only show lines near current price (within a % you choose).
Color-coded:
Red = Call Wall (potential resistance)
Green = Put Wall (potential support)
Blue = Max Pain (price magnet into expiry)
Adjustable line width & extension.
Use Case:
Perfect for traders combining options open interest/gamma analysis with price action, pivots, VWAP, and other intraday levels. Quickly spot overlaps between option walls and technical barriers for high-probability reaction zones.

Linh's Anomaly Radar v2What this script does
It’s an event detector for price/volume anomalies that often precede or confirm moves.
It watches a bunch of patterns (Wyckoff tests, squeezes, failed breakouts, turnover bursts, etc.), applies robust z-scores, optional trend filters, cooldowns (to avoid spam), and then fires:
A shape/label on the bar,
A row in the mini panel (top-right),
A ready-made alertcondition you can hook into.
How to add & set up (TradingView)
Paste the script → Save → Add to chart on Daily first (works on any TF).
Open Settings → Inputs:
General
• Use Robust Z (MAD): more outlier-resistant; keep on.
• Z Lookback: 60 bars is ~3 months; bump to 120 for slower regimes.
• Cooldown: min bars to wait before the same signal can fire again (default 5).
• Use trend filter: if on, “bullish” signals only fire above SMA(tfLen), “bearish” below.
Thresholds: fine-tune sensitivity (defaults are sane).
To create alerts: Right-click chart → Add alert
Condition: Linh’s Anomaly Radar v2 → choose a specific signal or Composite (Σ).
Options: “Once per bar close” (recommended).
Customize message if you want ticker/timeframe in your phone push.
The mini panel (top-right)
Signal column: short code (see cheat sheet below).
Fired column: a dot “•” means that on the latest bar this signal fired.
Score (right column): total count of signals that fired this bar.
Σ≥N shows your composite threshold (how many must fire to trigger the “Composite” alert).
Shapes & codes (what’s what)
Code Name (category) What it’s looking for Why it matters
STL Stealth Volume z(volume)>5 & ** z(return)
EVR Effort vs Result squeeze z(vol)>3 & z(TR)<−0.5 Heavy effort, tiny spread → absorption
TGV Tight+Heavy (HL/ATR)<0.6 & z(vol)>3 Tight bar + heavy tape → pro activity
CLS Accumulation cluster ≥3 of last 5 bars: up, vol↑, close near high Classic accumulation footprint
GAP Open drive failure Big gap not filled (≥80%) & vol↑ One-sided open stalls → fade risk
BB↑ BB squeeze breakout Squeeze (z(BBWidth)<−1.3) → close > upperBB & vol↑ Regime shift with confirmation
ER↑ Effort→Result inversion Down day on vol then next bar > prior high Demand overwhelms supply
OBV OBV divergence OBV slope up & ** z(ret20)
WER Wide Effort, Opposite Result z(vol)>3, close+1 Selling into strength / distribution
NS No-Supply (Wyckoff) Down bar, HL<0.6·ATR, vol << avg Sellers absent into weakness
ND No-Demand (Wyckoff) Up bar, HL<0.6·ATR, vol << avg Buyers absent into strength
VAC Liquidity Vacuum z(vol)<−1.5 & ** z(ret)
UTD UTAD (failed breakout) Breaks swing-high, closes back below, vol↑ Stop-run, reversal risk
SPR Spring (failed breakdown) Breaks swing-low, closes back above, vol↑ Bear trap, reversal risk
PIV Pocket Pivot Up bar; vol > max down-vol in lookback Quiet base → sudden demand
NR7 Narrow Range 7 + Vol HL is 7-bar low & z(vol)>2 Coiled spring with participation
52W 52-wk breakout quality New 52-wk close high + squeeze + vol↑ High-quality breakouts
VvK Vol-of-Vol kink z(ATR20,200)>0.5 & z(ATR5,60)<0 Long-vol wakes up, short-vol compresses
TAC Turnover acceleration SMA3 vol / SMA20 vol > 1.8 & muted return Participation surging before move
RBd RSI Bullish div Price LL, RSI HL, vol z>1 Exhaustion of sellers
RS↑ RSI Bearish div Price HH, RSI LH, vol z>1 Exhaustion of buyers
Σ Composite Count of all fired signals ≥ threshold High-conviction bar
Placement:
Triangles up (below bar) → bullish-leaning events.
Triangles down (above bar) → bearish-leaning events.
Circles → neutral context (VAC, VvK, Composite).
Key inputs (quick reference)
General
Use Robust Z (MAD): keep on for noisy tickers.
Z Lookback (lenZ): 60 default; 120 if you want fewer alerts.
Trend filter: when on, bullish signals require close > SMA(tfLen), bearish require <.
Cooldown: prevents repeated firing of the same signal within N bars.
Phase-1 thresholds (core)
Stealth: vol z > 5, |ret z| < 1.
EVR: vol z > 3, TR z < −0.5.
Tight+Heavy: (HL/ATR) < 0.6, vol z > 3.
Cluster: window=5, min=3 strong bars.
GapFail: gap/ATR ≥1.5, fill <80%, vol z > 2.
BB Squeeze: z(BBWidth)<−1.3 then breakout with vol z > 2.
Eff→Res Up: prev bar heavy down → current bar > prior high.
OBV Div: OBV uptrend + |z(ret20)|<0.3.
Phase-2 thresholds (extras)
WER: vol z > 3, close1.
No-Supply/No-Demand: tight bar & very light volume vs SMA20.
Vacuum: vol z < −1.5, |ret z|>1.5.
UTAD/Spring: swing lookback N (default 20), vol z > 2.
Pocket Pivot: lookback for prior down-vol max (default 10).
NR7: 7-bar narrowest range + vol z > 2.
52W Quality: new 52-wk high + squeeze + vol z > 2.
VoV Kink: z(ATR20,200)>0.5 AND z(ATR5,60)<0.
Turnover Accel: SMA3/SMA20 > 1.8 and |ret z|<1.
RSI Divergences: compare to n bars back (default 14).
How to use it (playbooks)
A) Daily scan workflow
Run on Daily for your VN watchlist.
Turn Composite (Σ) alert on with Σ≥2 or ≥3 to reduce noise.
When a bar fires Σ (or a fav combo like STL + BB↑), drop to 60-min to time entries.
B) Breakout quality check
Look for 52W together with BB↑, TAC, and OBV.
If WER/ND appear near highs → downgrade the breakout.
C) Spring/UTAD reversals
If SPR fires near major support and RBd confirms → long bias with stop below spring low.
If UTD + WER/RS↑ near resistance → short/fade with stop above UTAD high.
D) Accumulation basing
During bases, you want CLS, OBV, TGV, STL, NR7.
A pocket pivot (PIV) can be your early add; manage risk below base lows.
Tuning tips
Too many signals? Raise stealthVolZ to 5.5–6, evrVolZ to 3.5, use Σ≥3.
Fast movers? Lower bbwZthr to −1.0 (less strict squeeze), keep trend filter on.
Illiquid tickers? Keep MAD z-scores on, increase lookbacks (e.g., lenZ=120).
Limitations & good habits
First lenZ bars on a new symbol are less reliable (incomplete z-window).
Some ideas (VWAP magnet, close auction spikes, ETF/foreign flows, options skew) need intraday/external feeds — not included here.
Pine can’t “screen” across the whole market; set alerts or cycle your watchlist.
Quick troubleshooting
Compilation errors: make sure you’re on Pine v6; don’t nest functions in if blocks; each var int must be declared on its own line.
No shapes firing: check trend filter (maybe price is below SMA and you’re waiting for bullish signals), and verify thresholds aren’t too strict.

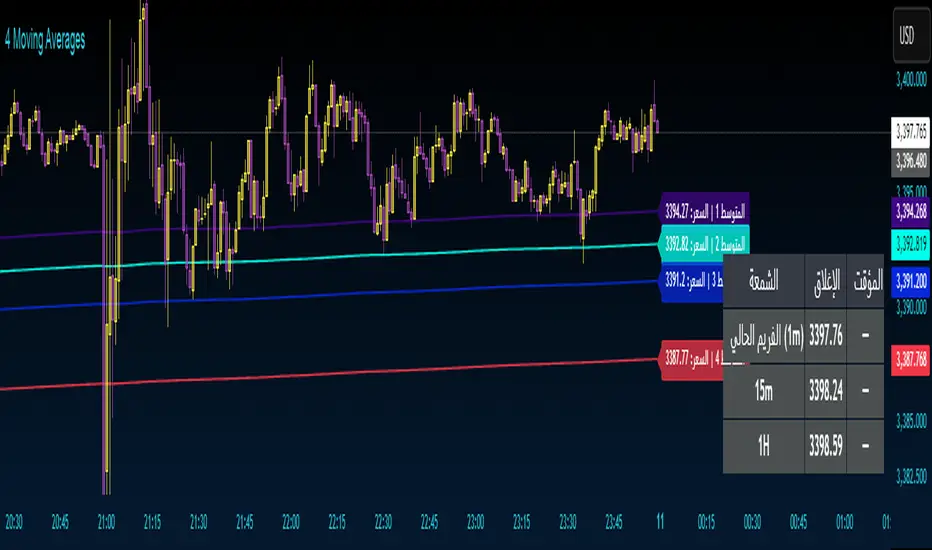
4 Moving Averages 4 Moving Averages
An indicator with four moving averages with ready-to-use settings. Use them as support and resistance.
VN30 Effort-vs-Result Multi-Scanner — LinhVN30 Effort-vs-Result Multi-Scanner (Pine v5)
Cross-section scanner for Vietnam’s VN30 stocks that surfaces Effort vs Result footprints and related accumulation/distribution and volatility tells. It renders a ranked table (Top-N) with per-ticker signals and key metrics.
What it does
Scans up to 30 tickers (editable input.symbol slots) using one security() call per symbol → stays under Pine’s 40-call limit and runs reliably on any chart.
Scores each ticker by counting active signals, then ranks and lists the top names.
Optional metrics columns: zVol(60), zTR(60), ATR(20), HL/ATR(20).
Signals (toggleable)
Price/Volume – Effort vs Result
EVR Squeeze (stealth): z(Vol,60) > 4 & z(TR,60) < −0.5
5σ Vol, ≤1σ Ret: z(Vol,60) > 5 & |z(Return,60)| < 1
Wide Effort, Opposite Result: z(Vol,60) > 3 & close < open & z(CLV×Vol,60) > 1
Spread Compression, Heavy Tape: (H−L)/ATR(20) < 0.6 & z(Vol,60) > 3
No-Supply / No-Demand: close < close & range < 0.6×ATR(20) & vol < 0.5×SMA(20)
Momentum & Volatility
Vol-of-Vol Kink: z(ATR20,200) rising & z(ATR5,60) falling
BB Squeeze → Expansion: BBWidth(20) in low regime (z<−1.3) then close > upper band & z(Vol,60) > 2
RSI Non-Confirmation: Price LL/HH with RSI HL/LH & z(Vol,60) > 1
Accumulation/Distribution
OBV Divergence w/ Flat Price: OBV slope > 0 & |z(ret20,260)| < 0.3
Accumulation Days Cluster: ≥3/5 bars: up close, higher vol, close near high
Effort-Result Inversion (Down): big vol on down day then next day close > prior high
How to use
Set the timeframe (works best on 1D for EOD scans).
Edit the 30 symbol slots to your VN30 constituents.
Choose Top N, toggle Show metrics/Only matches and enable/disable scenarios.
Read the table: Rank, Ticker, (metrics), Score, and comma-separated Signals fired.
Method notes
Z-scores use a population-std estimate; CLV×Vol is used for effort/location.
Rolling counts avoid ta.sum; OBV is computed manually; all logic is Pine v5-safe.
Intraday-only ideas (true VWAP magnets, auction volume, flows, futures/options) are not included—Pine can’t cross-scan those datasets.
Disclaimer: Educational tool, not financial advice. Always confirm signals on the chart and with your process.

VP-Period with Previous Day Levels & Historical POC# Volume Profile with Previous Day Levels & Historical POCs
## Description
Comprehensive indicator combining Volume Profile analysis, previous day levels, and historical POC (Point of Control) levels for advanced technical analysis.
## Key Features
### Volume Profile
- **Customizable period**: 3 to 500 days
- **Calculation resolution**: 400 to 700 points
- **Current VPOC**: Point of Control line for current period
- **Volume bars**: graphical display of volume profile distribution
### Historical POCs
- **POC history**: up to 20 previous days
- **Time labels**: shows how many days ago for each POC
- **Dashed lines**: easy identification of historical levels
### Previous Day Levels (last 5 days)
- **High/Low**: daily highs and lows
- **Midpoint**: 50% level (High+Low)/2
- **Open/Close**: opening and closing prices
- **Progressive thickness**: day 1 thicker, decreasing for previous days
## Customization
- Fully configurable colors for each element
- Toggle on/off switches for every component
- Different line styles (solid, dashed, dotted)
## Usage
Perfect for traders using volume analysis and support/resistance based on previous daily levels. Ideal for identifying key zones and significant breakout points.

Multi Timeframe 7 Bollinger Bands by CSPMulti Timeframe 7 Bollinger Bands by CSP IT SHOW 1MT,5MT,10MT,1HR,D, W,M BOLLINGER BAND IN ASINGLE CHART.